| 行业类别 | 格式 | 大小 |
|---|---|---|
| 冀教版八年级数学下册 | pptx | 6 MB |
描述
"Frequency Distribution Table and Histogram" PPT download
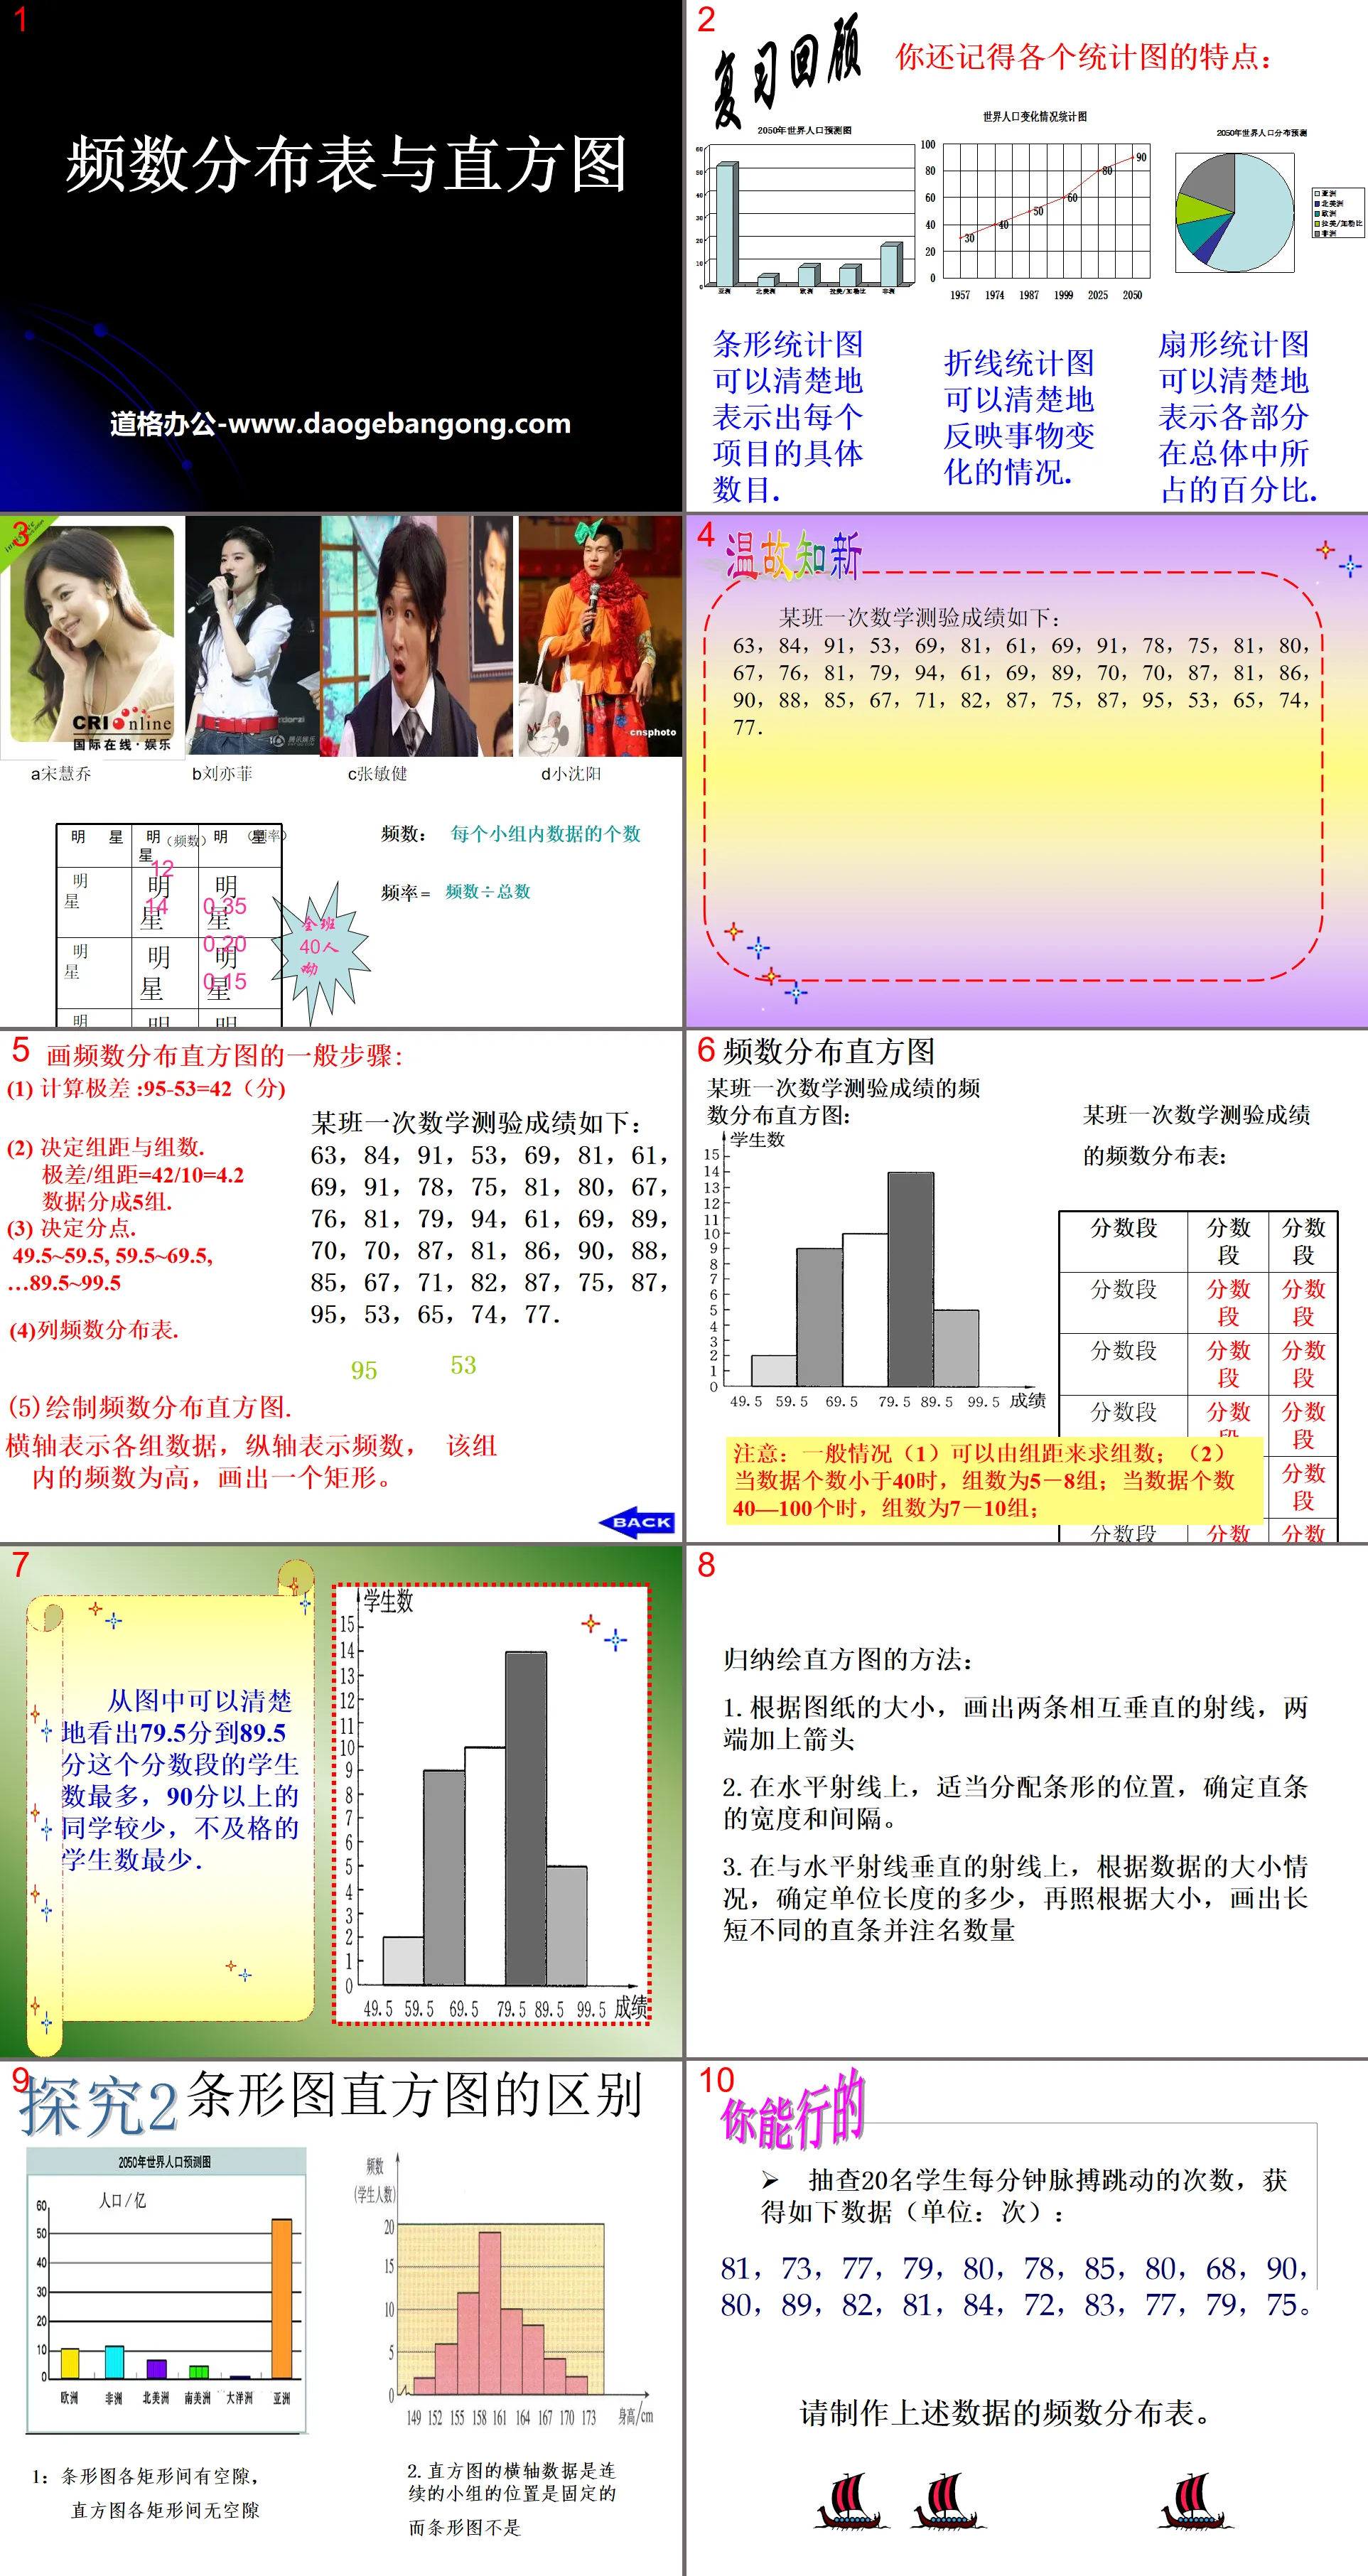
Part One: Review and Review
Do you still remember the characteristics of each statistical chart:
Bar charts can clearly show the specific number of each item.
Line statistical charts can clearly reflect changes in things.
A fan chart can clearly show the percentage of each part in the whole.
Frequency distribution table and histogram PPT, part 2: drawing frequency distribution histogram
General steps for drawing a frequency distribution histogram:
(1) Calculation range: 95-53=42 (minutes)
(2) Determine the group distance and number of groups.
Range/group distance=42/10=4.2
The data is divided into 5 groups.
(3) Decide on points.
49.5~59.5, 59.5~69.5,
…89.5~99.5
(4) Column frequency distribution table.
(5) Draw a frequency distribution histogram.
The horizontal axis represents each group of data, and the vertical axis represents frequency. If the frequency within the group is high, a rectangle is drawn.
Summarize the method of drawing a histogram:
1. According to the size of the drawing, draw two mutually perpendicular rays and add arrows at both ends.
2. On the horizontal ray, appropriately allocate the positions of the bars and determine the width and spacing of the straight bars.
3. On the ray perpendicular to the horizontal ray, determine the unit length according to the size of the data, and then draw straight bars of different lengths according to the size and note the quantity.
Frequency distribution table and histogram PPT, the third part: the difference between bar chart and histogram
1. There are gaps between the rectangles in the bar chart, but there are no gaps between the rectangles in the histogram.
2. The horizontal axis data of the histogram is continuous and the position of the group is fixed, but the bar chart is not.
Randomly check the number of pulse beats per minute of 20 students and obtain the following data (unit: times):
81, 73, 77, 79, 80, 78, 85, 80, 68, 90,
80, 89, 82, 81, 84, 72, 83, 77, 79, 75.
untie:
(1) Column frequency distribution table: Frequency distribution table of the number of pulse beats per minute for 20 students
(2) Take the line segments with the two boundary points of each group on the horizontal axis as the endpoints as the base, and draw a rectangle with the height of the corresponding frequency to get the desired frequency distribution histogram, as shown in the figure:
Keywords: Free download of Hebei Education Edition mathematics PPT courseware for eighth grade volume 2, frequency distribution table and histogram PPT download, .PPT format;
For more information about the "Frequency Distribution Table and Histogram" PPT courseware, please click the Frequency Distribution Table and Histogram ppt tab.
"Frequency Distribution Table and Histogram" PPT courseware:
"Frequency Distribution Table and Histogram" PPT courseware Part One: Preparation before class Questionnaire: Books are the ladder of human progress. What kind of books do students like to read most after class? A. Literature ( ) B. Comics ( ) C. Popular science ( ) D. History ( ..
"Frequency Distribution Table and Histogram" PPT:
"Frequency Distribution Table and Histogram" PPT Part One Content: New Lesson Exploration In order to understand the market share of different brands of beverages, Xiaoliang and Xiaoming chose a supermarket to conduct a survey and recorded the brands of beverages purchased by 50 customers that day. Use the letters K,B,L,C...
文件信息
更新时间: 2024-11-23
本模板属于 数学课件 冀教版八年级数学下册 行业PPT模板
"Frequency Distribution Table and Histogram" PPT download简约校园招聘活动策划方案总结企事业单位招聘宣传演讲会PPT模板是由文稿PPT提供的商务岗位竞聘通用PPT模板,简约校园招聘活动策划方案总结企事业单位招聘宣传演讲会PPT模板,下载源文件即可自行编辑修改源文件里的文字和图片,如果想要更多精美商务PPT模板,可以来道格办公。道格办公PPT,海量PPT模板幻灯片素材下载,我们只做精品的PPT模板!
Tips:如果打开模版觉得不合适您全部需求的话,可以检索相关内容「"Frequency Distribution Table and Histogram" PPT download」即可。
Windows系统模版使用方法
直接解压文件后使用office 或者 wps即可使用
Mac系统模版使用方法
直接解压文件后使用office 或者 wps即可使用
相关阅读
更详细的PPT相关的教程、字体的教程可以查看: 点击查看
注意事项
不要在微信、知乎、QQ、内置浏览器下载、请用手机浏览器下载! 如果您是手机用户,请移步电脑端下载!
1、文稿PPT,仅供学习参考,请在下载后24小时删除。
2、如果资源涉及你的合法权益,第一时间删除。
3、联系方式:service@daogebangong.com
"Frequency Distribution Table and Histogram" PPT download由于使用限制,仅供个人学习与参考使用,如需商业使用请到相关官网授权。
(个人非商业用途是指以个人为单位、非商业产品运作的方式,运用该字体完成个人作品的展示,包括但不限于个人论文、简历等作品的设计)
预览效果


