Western Normal University Edition First Grade Mathematics Volume 1
Beijing Normal University Edition Seventh Grade Mathematics Volume 1
People's Education Press First Grade Mathematics Volume 1
People's Education Press Second Grade Mathematics Volume 1
Beijing Normal University Edition Seventh Grade Mathematics Volume 2
People's Education Press Third Grade Mathematics Volume 1
Beijing Normal University Edition Eighth Grade Mathematics Volume 1
Qingdao Edition Seventh Grade Mathematics Volume 1
Hebei Education Edition Seventh Grade Mathematics Volume 2
Beijing Normal University Edition Fifth Grade Mathematics Volume 1
Hebei Education Edition Third Grade Mathematics Volume 1
People's Education High School Mathematics Edition B Compulsory Course 2
Qingdao Edition Seventh Grade Mathematics Volume 2
People's Education Press First Grade Mathematics Volume 2
Hebei Education Edition Fourth Grade Mathematics Volume 2
Beijing Normal University Edition Fifth Grade Mathematics Volume 2

| Category | Format | Size |
|---|---|---|
| People's Education High School Mathematics Edition A Compulsory Course 2 | pptx | 6 MB |
Description
"Using Samples to Estimate the Population" Statistics PPT Courseware (Estimation of Population Value Rules)
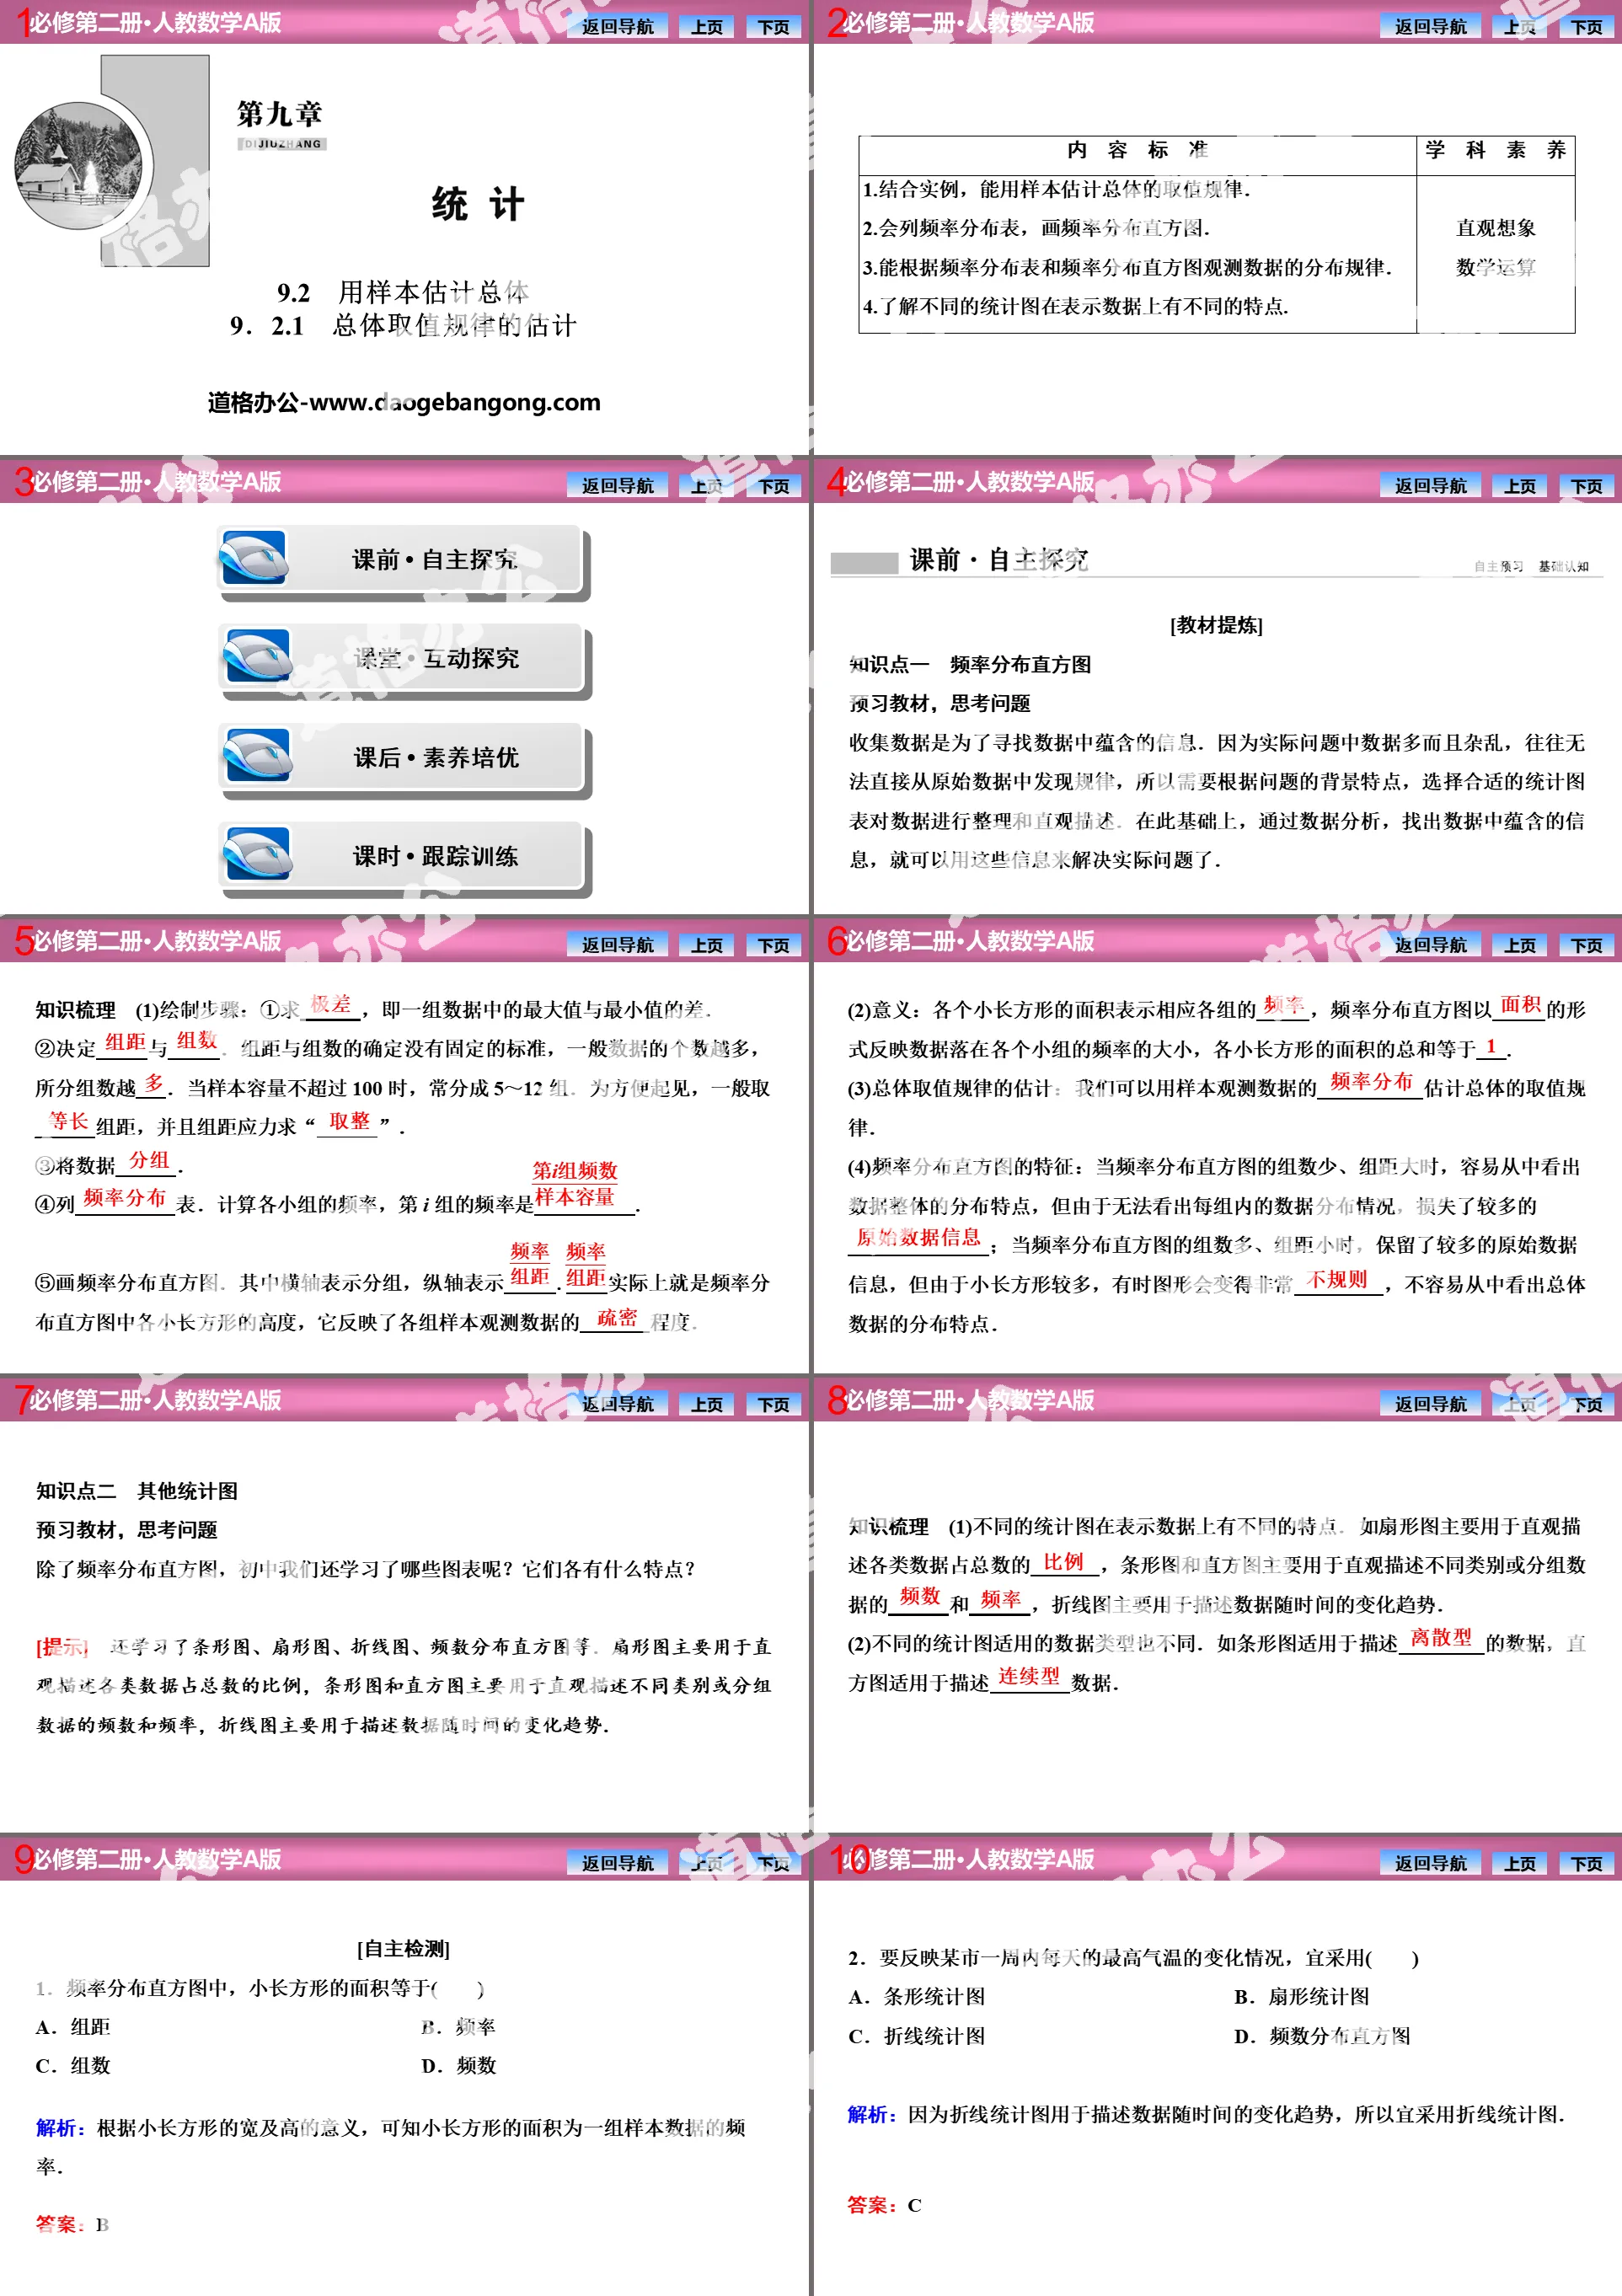
Part One: Content Standards
1. Combined with examples, samples can be used to estimate the value rules of the population.
2. Be able to make frequency distribution tables and draw frequency distribution histograms.
3. Be able to observe the distribution patterns of data based on frequency distribution tables and frequency distribution histograms.
4. Understand that different statistical charts have different characteristics in representing data.
Estimating the population using samples PPT, Part 2 content: Before class • Independent exploration
[Textbook Extraction]
Knowledge point 1 Frequency distribution histogram
Preview the teaching materials and think about the questions
The purpose of collecting data is to find the information contained in the data. Because the data in actual problems are large and messy, it is often impossible to find patterns directly from the original data. Therefore, it is necessary to select appropriate statistical charts to organize and intuitively describe the data according to the background characteristics of the problem. On this basis, through data analysis, we can find out the information contained in the data, and then we can use this information to solve practical problems.
Knowledge Point 2: Other Statistical Charts
Preview the teaching materials and think about the questions
In addition to frequency distribution histograms, what other charts did we learn in junior high school? What are the characteristics of each of them?
[Tips] I also learned about bar charts, fan charts, line charts, frequency distribution histograms, etc. The fan chart is mainly used to visually describe the proportion of various types of data to the total number. The bar chart and histogram are mainly used to visually describe the frequency and frequency of different categories or grouped data. The line chart is mainly used to describe the changing trend of data over time.
[Autonomous detection]
1. In the frequency distribution histogram, the area of the small rectangle is equal to ()
A. Group distance B. frequency
C. Number of groups D. Frequency
2. To reflect the daily maximum temperature changes in a city within a week, it is appropriate to use ()
A. Bar chart B. fan chart
C. Line chart D. Frequency distribution histogram
Estimating the population using samples PPT, Part 3: Classroom • Interactive inquiry
Study 1 Frequency distribution table and frequency distribution histogram method
[Example 1] To investigate the height of first-grade boys in a certain school, 40 first-grade boys were randomly selected. The measured height data (unit: cm) are as follows:
171 163 163 166 166 168 168 160 168 165 171 169 167 169 151 168 170 168 160 174 165 168 174 158 167 156 157 164 169 180 176 157 162 161 158 164 163 163 167 161
(1) Make a frequency distribution table;
(2) Draw a frequency distribution histogram.
method promotion
1. When making a frequency distribution table, the range, group distance, and number of groups have the following relationship:
(1) If the range group distance is an integer, then the range group distance = the number of groups;
(2) If the range group distance is not an integer, then the integer part of the range group distance + 1 = number of groups.
2. There is no fixed standard for determining the group distance and number of groups. When grouping data, the number of groups should be appropriate. Even if the distribution pattern of the data can be clearly presented, too many or too few groups will affect our understanding of the distribution of the data. , if the sample size does not exceed 100, it is usually divided into 5 to 12 groups according to the amount of data. Generally, the larger the sample size, the greater the number of groups.
Exploration 2: Applications of other statistical charts
[Example 2] Expired household medicines are "national hazardous waste". Improper handling will pollute the environment and endanger health. In order to understand the way citizens' households deal with expired drugs, the drug regulatory department of a certain city decided to conduct a simple random sampling survey among households in the city.
(1) The most reasonable method of selecting samples below is _________. (Just fill in the serial number of the correct answer)
① Randomly select families as a unit in a residential area in the city center; ② Randomly select families as a unit among medical workers in the city; ③ Randomly select families as a unit among the permanent residents of the city.
(2) This sampling survey found that the households surveyed had expired drugs. The relevant data are now presented as follows:
①m=________, n=________;
② Complete the bar chart;
③Based on survey data, what do you think is the most common way for households in this city to dispose of expired drugs?
④The correct way to dispose of expired medicines at home is to send them to recycling points. If there are 1.8 million households in the city, please estimate how many households dispose of expired medicines by sending them to recycling points.
Using samples to estimate the overall PPT, Part 4: After-school • Quality development
1. The data is clear and the characteristics are obvious - the outstanding characteristics of the frequency distribution histogram
Mathematical modeling, data analysis, mathematical operations
(1) Using the frequency distribution of samples to estimate the distribution of the population is the main purpose of making frequency distribution tables and drawing frequency distribution histograms. Frequency distribution tables more accurately reflect the frequency distribution of samples, while frequency distribution histograms can intuitively reflect frequency distribution of the sample.
(2) The frequency distribution histogram reflects the possibility of the sample taking values in various ranges. Based on the representativeness of sampling and using the frequency of the sample in a certain range, the possibility of the population in this range can be approximately estimated.
2. Failure to understand frequency distribution histograms leads to mistakes
Data analysis, logical reasoning, mathematical operations
[Typical Example 2] An e-commerce company made statistics on the consumption of 10,000 online shoppers in 2019 and found that the consumption amounts (unit: 10,000 yuan) were all in the range of [0.3,0.9&# 093;, its frequency distribution histogram is as shown in the figure.
(1) a = ________ in the histogram;
(2) Among these shoppers, the number of shoppers whose spending amount is within the interval [0.5,0.9] is ________.
[Literacy Improvement] When using frequency distribution histograms to solve related problems, you should correctly understand the meaning of each quantity in the chart. Understanding the graph and mastering the information is the key to solving such problems. The frequency distribution histogram has the following key points:
(1) The vertical axis represents frequency/group distance;
(2) The ratio of the heights of each rectangle in the frequency distribution histogram is the ratio of its frequencies;
(3) The area of each rectangle in the histogram is the frequency at which the sample data falls in this interval. The sum of the areas of all small rectangles is equal to 1, that is, the sum of the frequencies is 1.
Keywords: Free download of PPT courseware for the compulsory course II of Mathematics of High School People's Education A version, download of PPT for estimating the population using samples, download of statistics PPT, download of PPT for estimating the regularity of overall values, .PPT format;
For more information about the PPT courseware "Statistics PPT uses samples to estimate the population and estimates of the population value rules", please click the Statistics PPT uses samples to estimate the population PPT and estimates the population value rules PPT tag.
"Using Samples to Estimate the Population" Statistics PPT Courseware (Estimation of the Dispersion Degree of a Population):
"Using Samples to Estimate the Population" Statistics PPT Courseware (Estimation of the Dispersion Degree of the Population) Part One Content: Content Standards 1. Combined with examples, be able to use samples to estimate the dispersion parameters (standard deviation, variance, range) of the population. 2. Be able to find the variance, standard deviation, and extreme of sample data..
"Using Samples to Estimate the Population" Statistics PPT Courseware (Estimation of Population Central Tendency):
"Using Samples to Estimate the Population" Statistics PPT Courseware (Estimation of the Central Tendency of the Population) Part One Content: Content Standards 1. Combined with examples, be able to use samples to estimate the central tendency parameters (mean, median, mode) of the population. 2. Able to find the mean and median of sample data..
"Using Samples to Estimate the Population" Statistics PPT Courseware (Estimation of Population Percentiles):
"Using Samples to Estimate the Population" Statistics PPT Courseware (Estimation of Population Percentiles) Part One: Content Standards 1. Combined with examples, be able to use samples to estimate percentiles. 2. Understand the statistical meaning of percentiles. 3. Can find the p-th percentile of sample data. ... ....
File Info
Update Time: 2024-11-03
This template belongs to Mathematics courseware People's Education High School Mathematics Edition A Compulsory Course 2 industry PPT template
"Using Samples to Estimate the Population" Statistics PPT Courseware (Estimation of Population Value Rules) Simple campus recruitment activity planning plan summary enterprise and institution recruitment publicity lecture PPT template is a general PPT template for business post competition provided by the manuscript PPT, simple campus recruitment activity planning plan summary enterprise and institution recruitment promotion Lecture PPT template, you can edit and modify the text and pictures in the source file by downloading the source file. If you want more exquisite business PPT templates, you can come to grid resource. Doug resource PPT, massive PPT template slide material download, we only make high-quality PPT templates!
Tips: If you open the template and feel that it is not suitable for all your needs, you can search for related content "Using Samples to Estimate the Population" Statistics PPT Courseware (Estimation of Population Value Rules) is enough.
How to use the Windows system template
Directly decompress the file and use it with office or wps
How to use the Mac system template
Directly decompress the file and use it Office or wps can be used
Related reading
For more detailed PPT-related tutorials and font tutorials, you can view: Click to see
How to create a high-quality technological sense PPT? 4 ways to share the bottom of the box
Notice
Do not download in WeChat, Zhihu, QQ, built-in browsers, please use mobile browsers to download! If you are a mobile phone user, please download it on your computer!
1. The manuscript PPT is only for study and reference, please delete it 24 hours after downloading.
2. If the resource involves your legitimate rights and interests, delete it immediately.
3. Contact information: service@daogebangong.com
"Using Samples to Estimate the Population" Statistics PPT Courseware (Estimation of Population Value Rules), due to usage restrictions, it is only for personal study and reference use. For commercial use, please go to the relevant official website for authorization.
(Personal non-commercial use refers to the use of this font to complete the display of personal works, including but not limited to the design of personal papers, resumes, etc.)
Preview


