"Using Samples to Estimate the Population" PPT Courseware 2 Simple campus recruitment activity planning plan summary enterprise and institution recruitment publicity lecture PPT template is a general PPT template for business post competition provided by the manuscript PPT, simple campus recruitment activity planning plan summary enterprise and institution recruitment promotion Lecture PPT template, you can edit and modify the text and pictures in the source file by downloading the source file. If you want more exquisite business PPT templates, you can come to grid resource. Doug resource PPT, massive PPT template slide material download, we only make high-quality PPT templates!
| 文件名 如何下载使用 | 下载次数 | Download Points | 下载地址 |
|---|---|---|---|
| "Using Samples to Estima... | 5625次 | 0.00 | Free Download |
Tips: If you open the template and feel that it is not suitable for all your needs, you can search for related content "Using Samples to Estimate the Population" PPT Courseware 2 is enough.
How to use the Windows system template
Directly decompress the file and use it with office or wps
How to use the Mac system template
Directly decompress the file and use it Office or wps can be used
Related reading
For more detailed PPT-related tutorials and font tutorials, you can view: Click to see
How to create a high-quality technological sense PPT? 4 ways to share the bottom of the box
Notice
Do not download in WeChat, Zhihu, QQ, built-in browsers, please use mobile browsers to download! If you are a mobile phone user, please download it on your computer!
1. The manuscript PPT is only for study and reference, please delete it 24 hours after downloading.
2. If the resource involves your legitimate rights and interests, delete it immediately.
3. Contact information: service@daogebangong.com
"Using Samples to Estimate the Population" PPT Courseware 2, due to usage restrictions, it is only for personal study and reference use. For commercial use, please go to the relevant official website for authorization.
(Personal non-commercial use refers to the use of this font to complete the display of personal works, including but not limited to the design of personal papers, resumes, etc.)

Related reading
For more detailed PPT-related tutorials and font tutorials, you can view:Please click to see


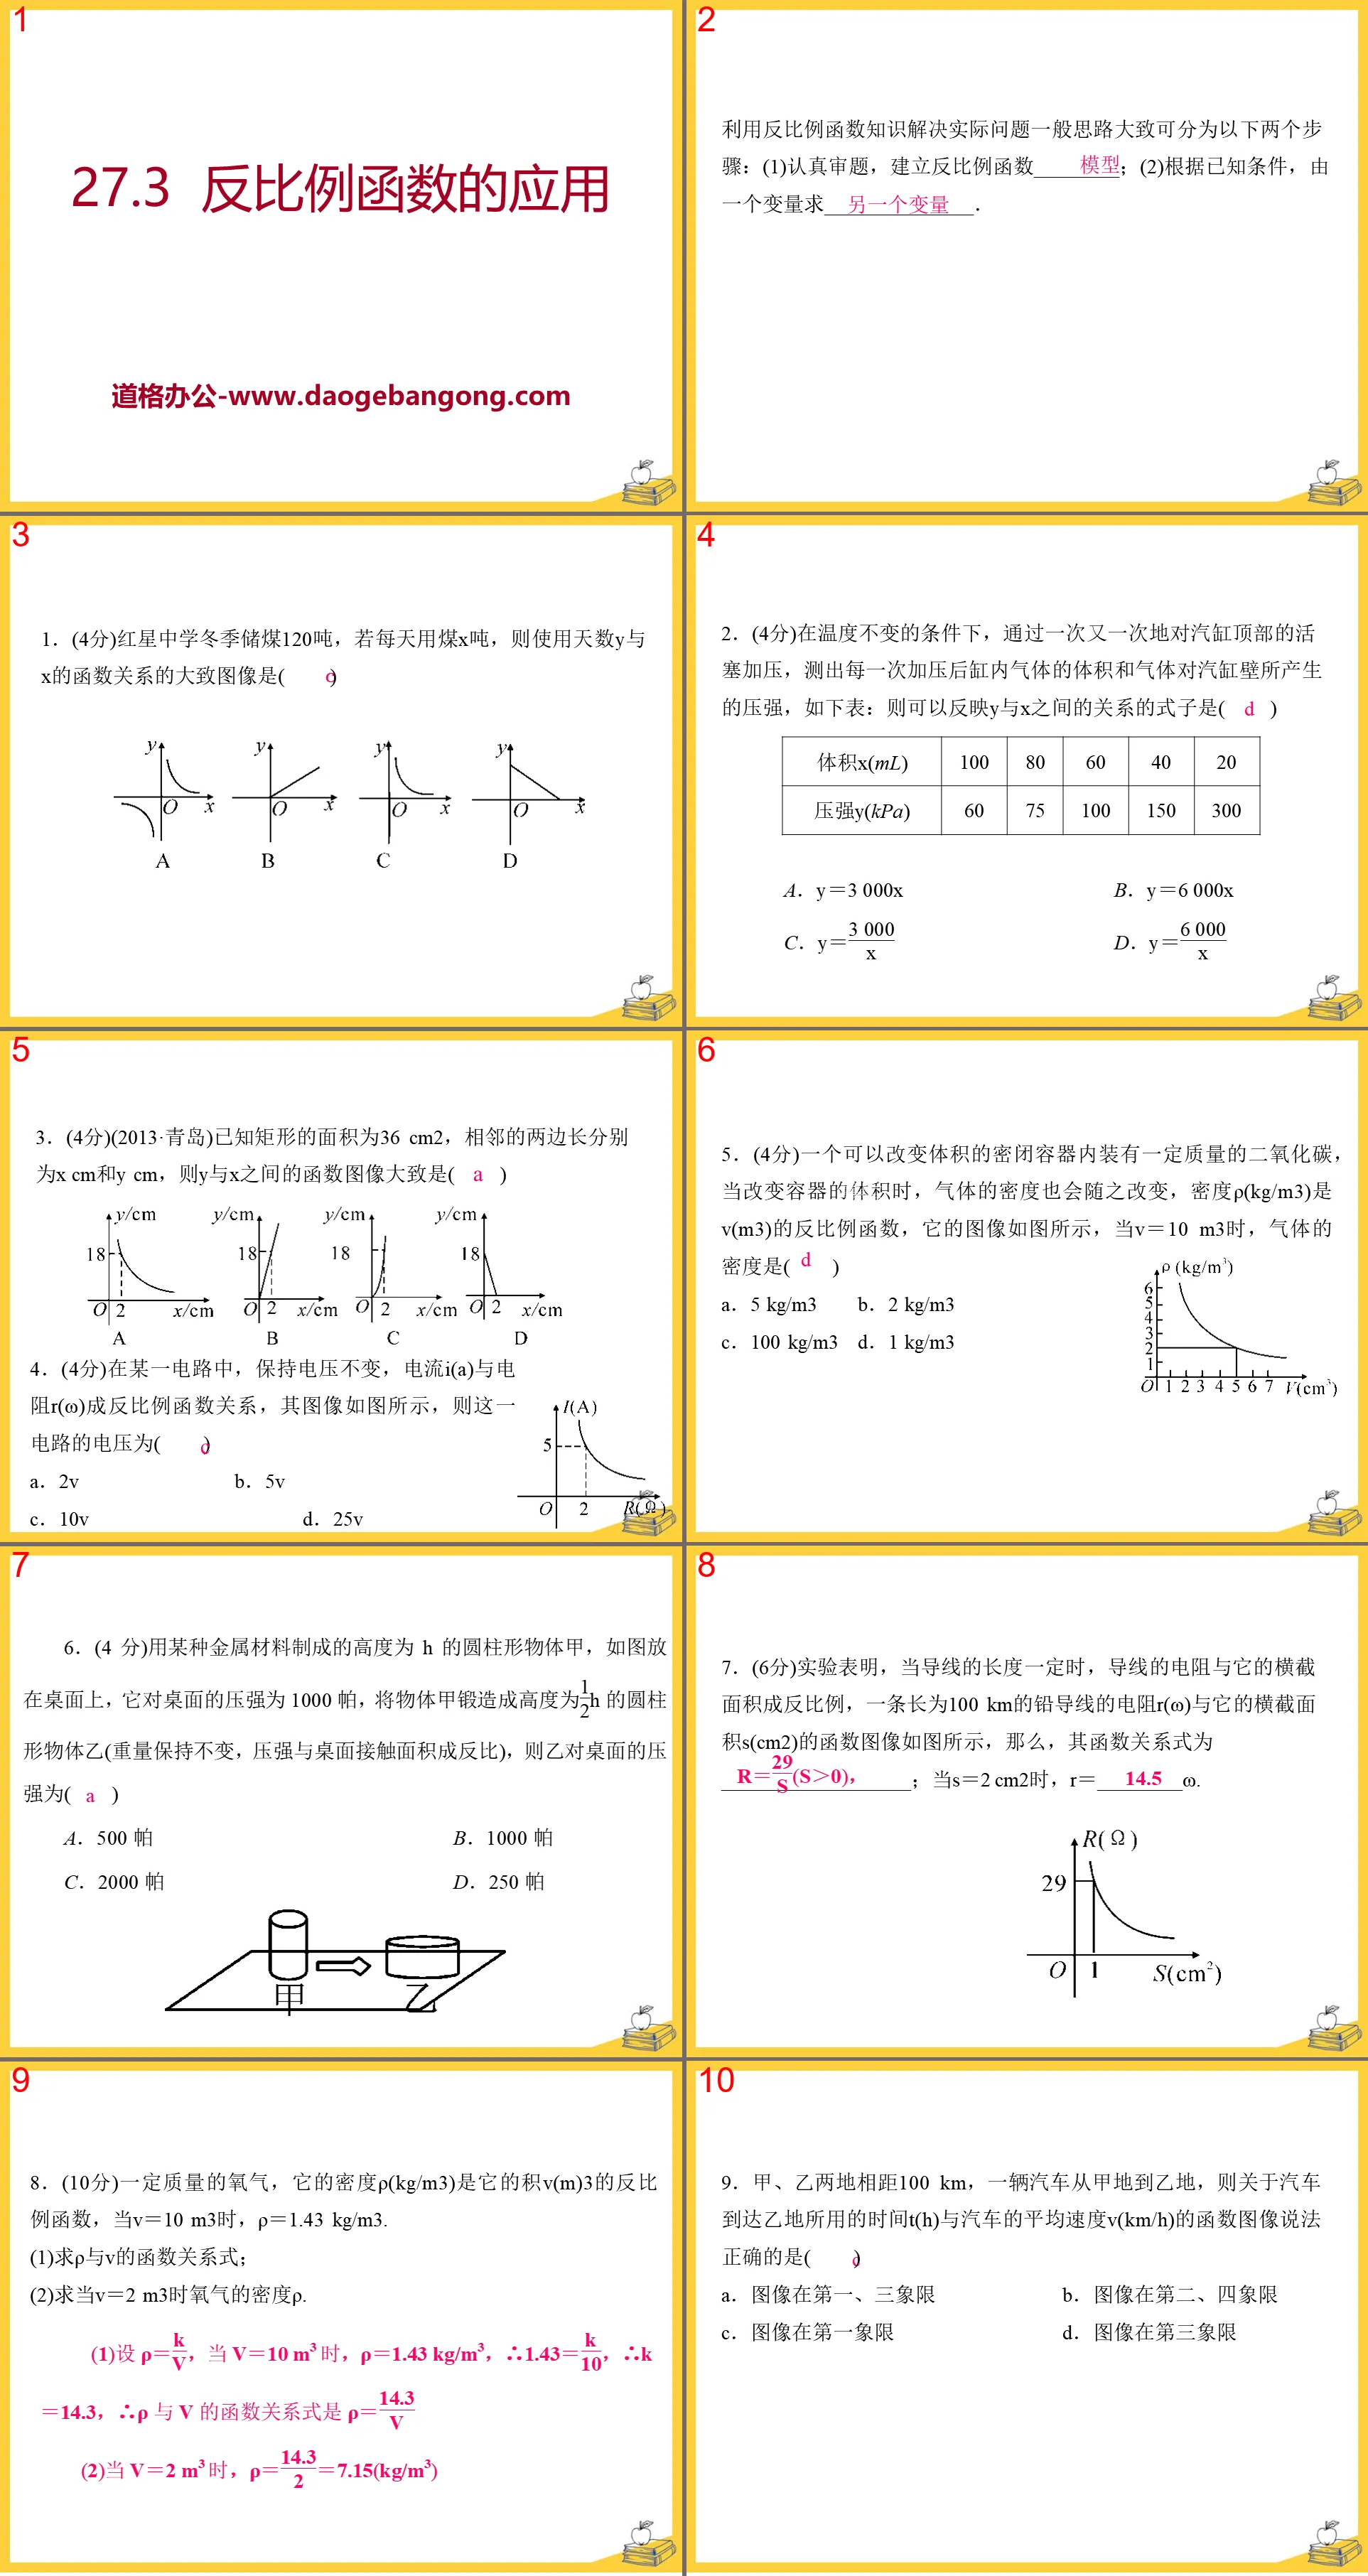
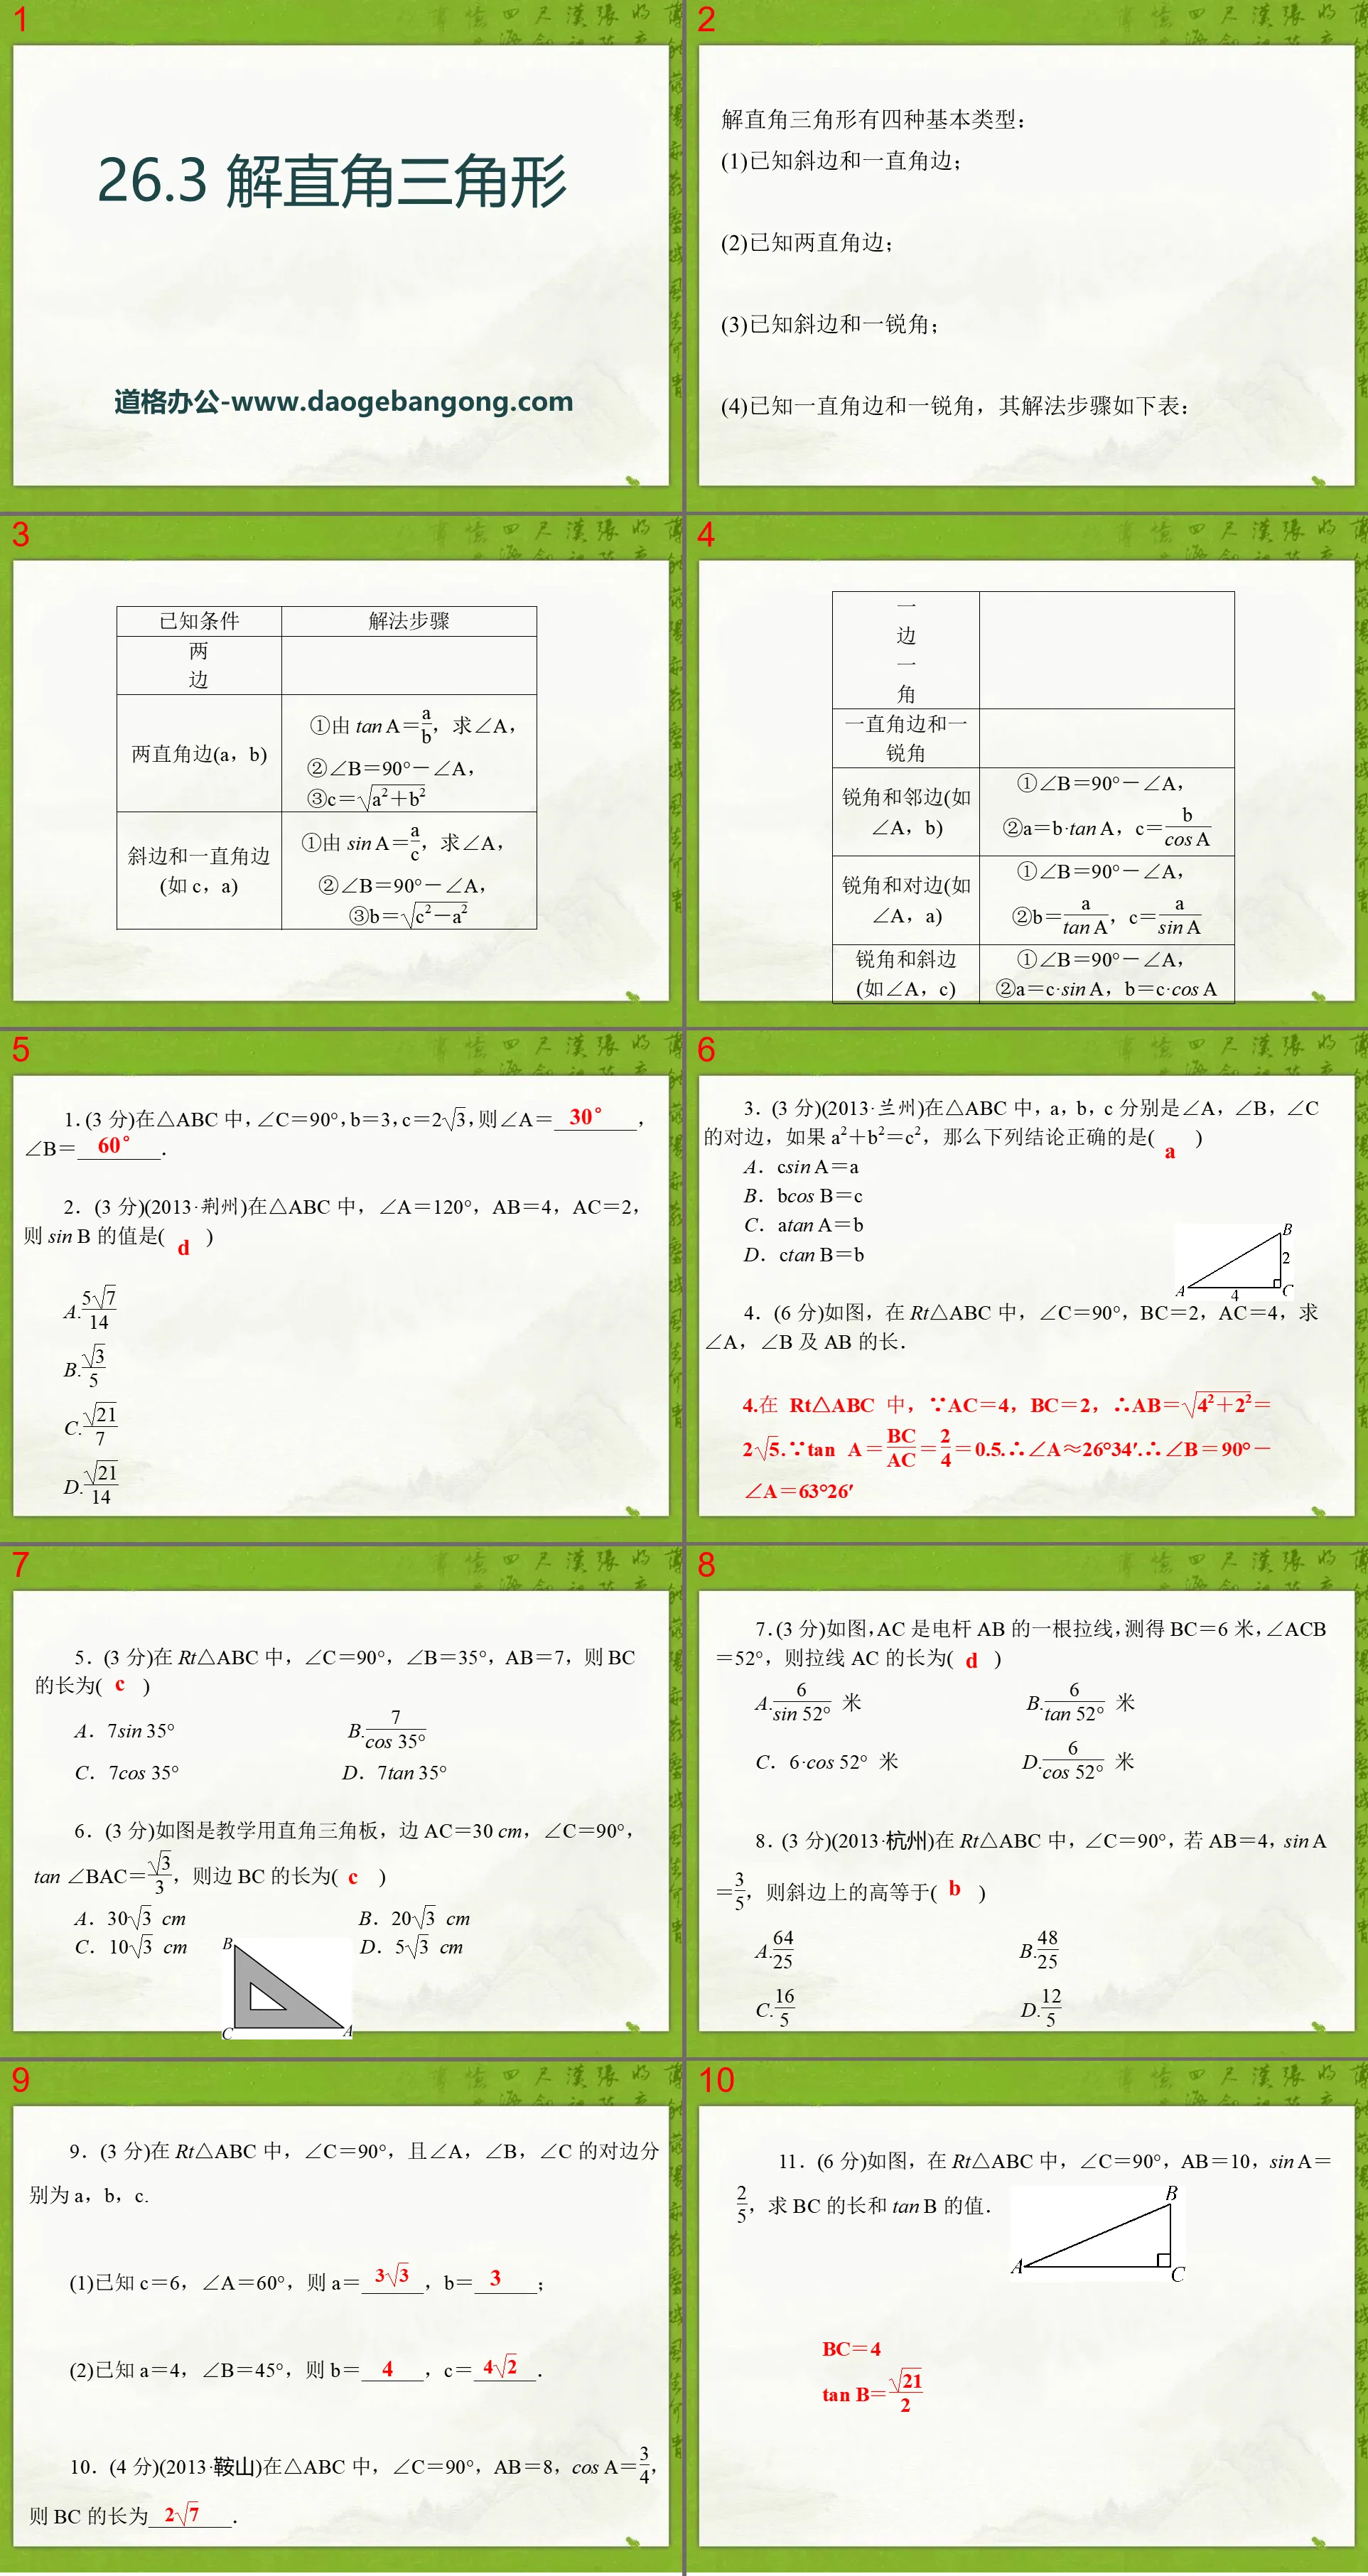
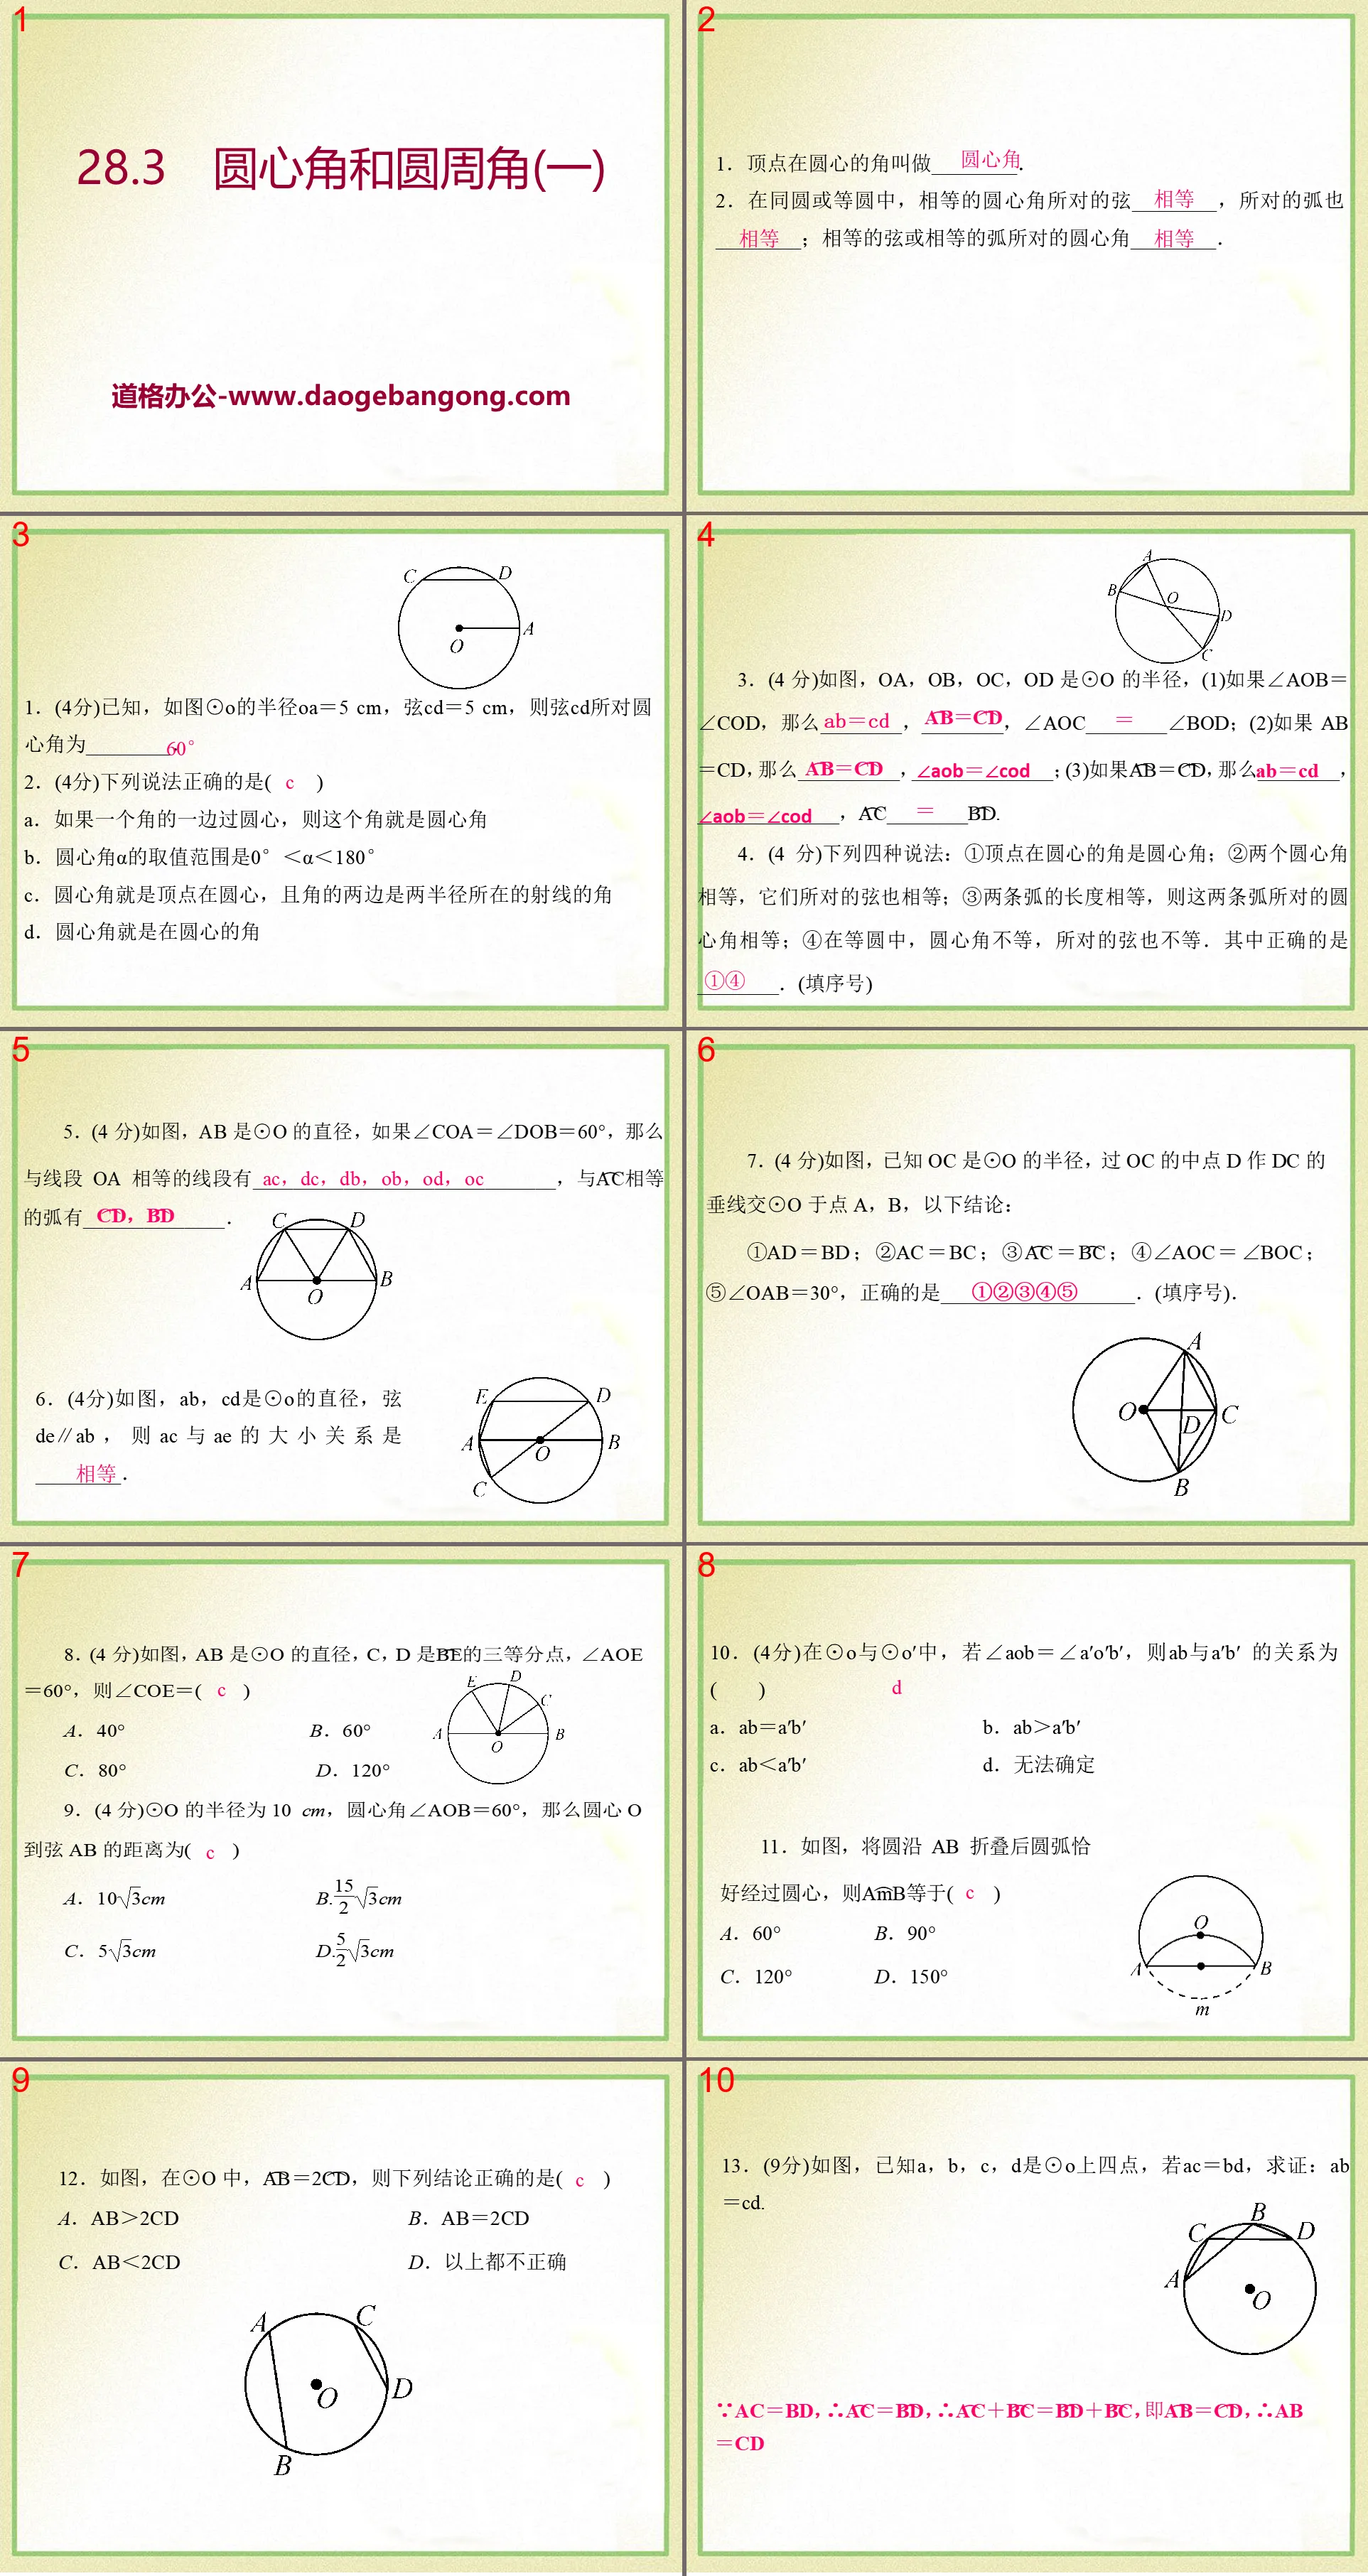
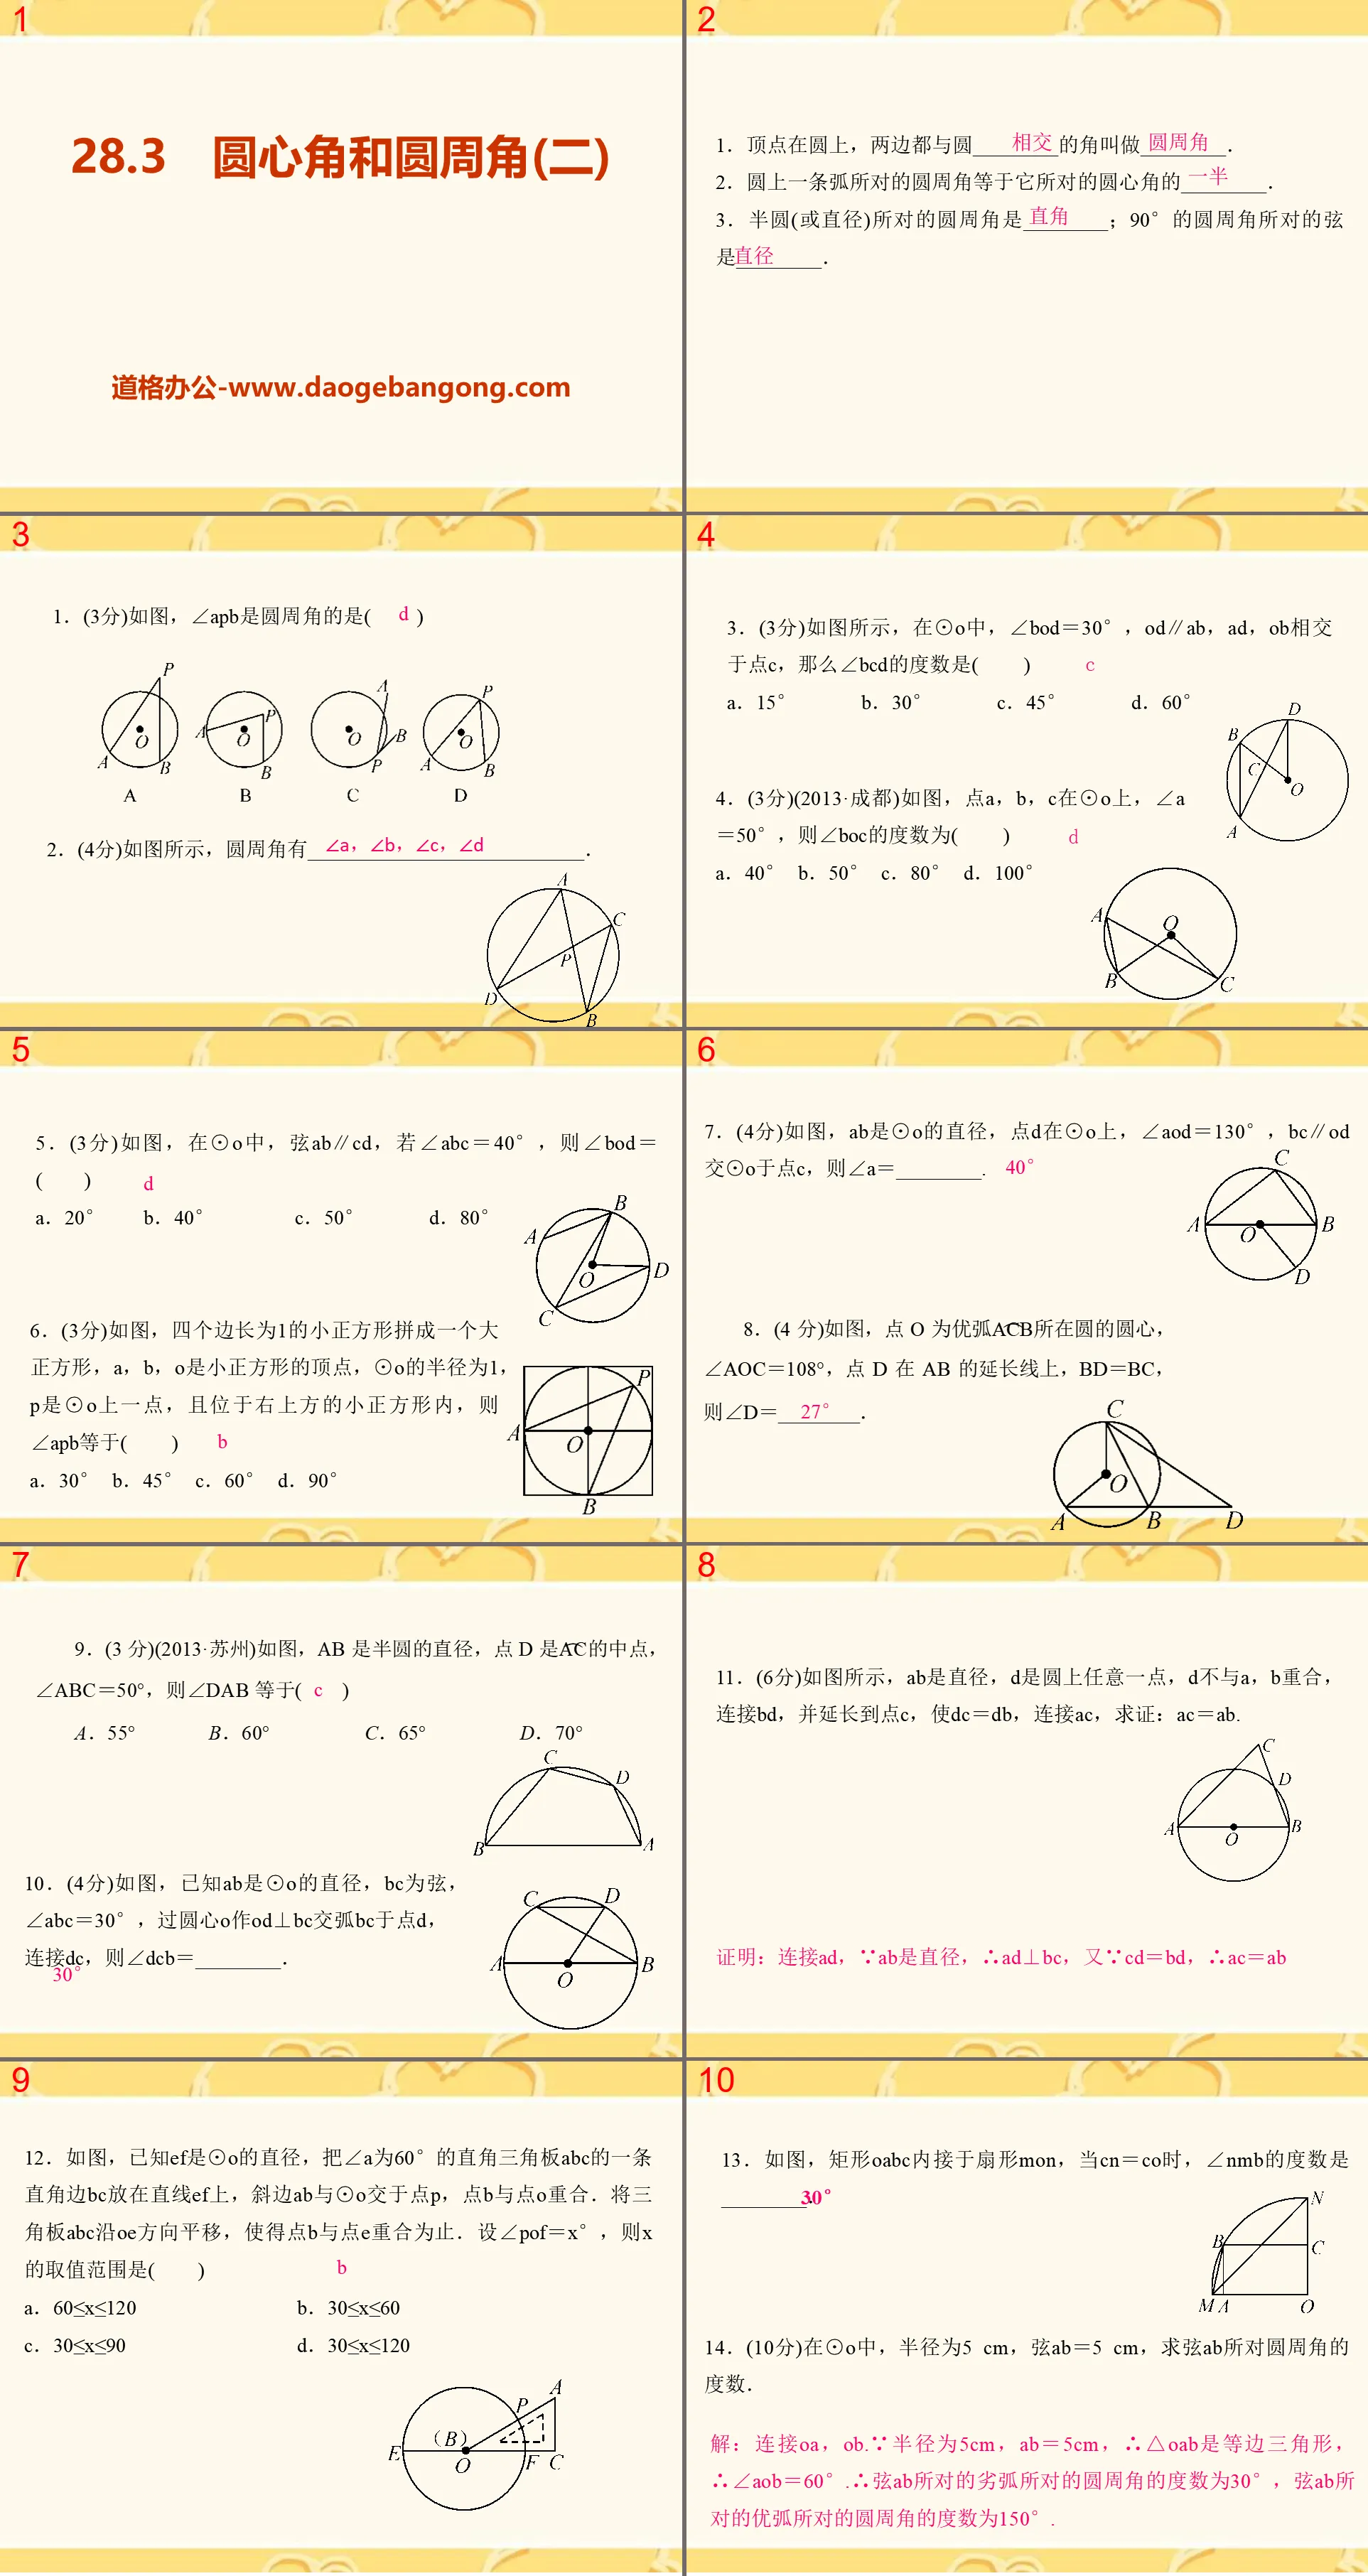

Authoritative PPT Summary
"Using Samples to Estimate the Population" PPT Courseware 2
Case:
There are 50 high-quality apples in a box. Randomly pick out 2 apples. Use the average mass (g) of these two apples to estimate the average mass of each apple in the whole box. Do you think this estimate is accurate? How about taking any 5? How about taking any 10?
Weigh 50 apples one by one. The mass data are as follows:
200 256 268 253 280 248 240 265 258 246
272 267 242 212 262 252 268 250 255 223
261 251 248 238 195 246 295 235 256 270
253 256 249 252 275 254 235 260 228 245
270 246 236 285 218 260 232 254 250 255
practice:
Write 50 pieces of data on 50 pieces of paper respectively, put the pieces of paper in a box and mix them evenly, take out 5 pieces of paper at random, count these 5 pieces of paper, calculate the average of these 5 numbers, repeat 8 times ;Take out 10 random pieces of paper and calculate the average of these 10 numbers. Repeat 8 times.
(1) Fill in the calculation results in the table below
(2) Observe and compare the averages of the two groups. Which group of averages is stable?
(3) After calculation, the average of these 50 data is 250.5. Which set of averages is closer to 250.5?
Summarize:
Generally, due to the arbitrariness of sampling, the averages of different samples are generally different; when the sample data is small, the difference may also be large.
When there are many individuals in the sample and they are well representative, Yang Ben's average tends to be stable and is closer to the overall average.
Therefore, we often use the sample mean to estimate the population mean. Similarly, the variance of the sample is also used to estimate the variance of the population.
Practice in class
Example 1: A certain lathe is used to process a bearing. The average diameter of the bearing is specified to be 20cm, and the variance does not exceed 0.05. Ten pieces were randomly selected from the bearings processed on a certain day, and their diameters (mm) were measured as follows:
20.1 19.9 20.3 20.2 19.8 19.7 19.9 20.3 20 19.8
(1) Calculate the mean of the sample and the variance of the sample
(2) Use the average and variance of the sample to estimate the average and variance of the population, and infer whether the production situation of this lathe is normal.
Example 2: The apple orchard contracted by Xiao Liang’s family has a total of 3,000 apple trees of the same age. In order to estimate the total apple production this year, Xiao Liang randomly selected 6 apple trees and counted the number of fruits they had:
260 340 280 420 360 380
Based on experience in previous years, the average mass of each apple is about 250g. Please estimate the total production of apples.
Keywords: Using samples to estimate the population teaching courseware, Hebei Education Edition ninth grade mathematics volume PPT courseware download, ninth grade mathematics slide courseware download, using samples to estimate the population PPT courseware download, .PPT format;
For more information about the PPT courseware "Using Samples to Estimate Populations", please click the "Using Samples to Estimate Populations" ppt tag.
"Using Samples to Estimate Populations" PPT courseware:
"Using Samples to Estimate Populations" PPT Courseware When examining the population variance, if the population to be examined contains many individuals, or the examination itself is destructive, in practice, the sample mean (or variance) is often used to estimate the population mean (or variance). 1. (4 points) Zhuzhou City is concerned about...