Beijing Normal University Edition Seventh Grade Mathematics Volume 1
Western Normal University Edition First Grade Mathematics Volume 1
People's Education Press First Grade Mathematics Volume 1
People's Education Press Second Grade Mathematics Volume 1
Beijing Normal University Edition Seventh Grade Mathematics Volume 2
People's Education Press Third Grade Mathematics Volume 1
Beijing Normal University Edition Eighth Grade Mathematics Volume 1
Qingdao Edition Seventh Grade Mathematics Volume 1
Beijing Normal University Edition Fifth Grade Mathematics Volume 1
Hebei Education Edition Third Grade Mathematics Volume 1
Hebei Education Edition Seventh Grade Mathematics Volume 2
People's Education Press First Grade Mathematics Volume 2
People's Education High School Mathematics Edition B Compulsory Course 2
Qingdao Edition Seventh Grade Mathematics Volume 2
Beijing Normal University Edition Fifth Grade Mathematics Volume 2
Hebei Education Edition Fourth Grade Mathematics Volume 2

| Category | Format | Size |
|---|---|---|
| Hebei Education Edition Sixth Grade Mathematics Volume 1 | pptx | 6 MB |

"Sector Chart" PPT courseware 6
2024-11-25
Copyright statement: This material is compiled and released by the user of Daoge Resources. The copyright belongs to the author. For commercial use, please contact the copyright owner. If there is any infringement, please contact the webmaster to remove the resource.
Download Points: 0.00
Free Download
Upgrade VIP
Favorite
Views: 1316 / Downloads: 722
Description
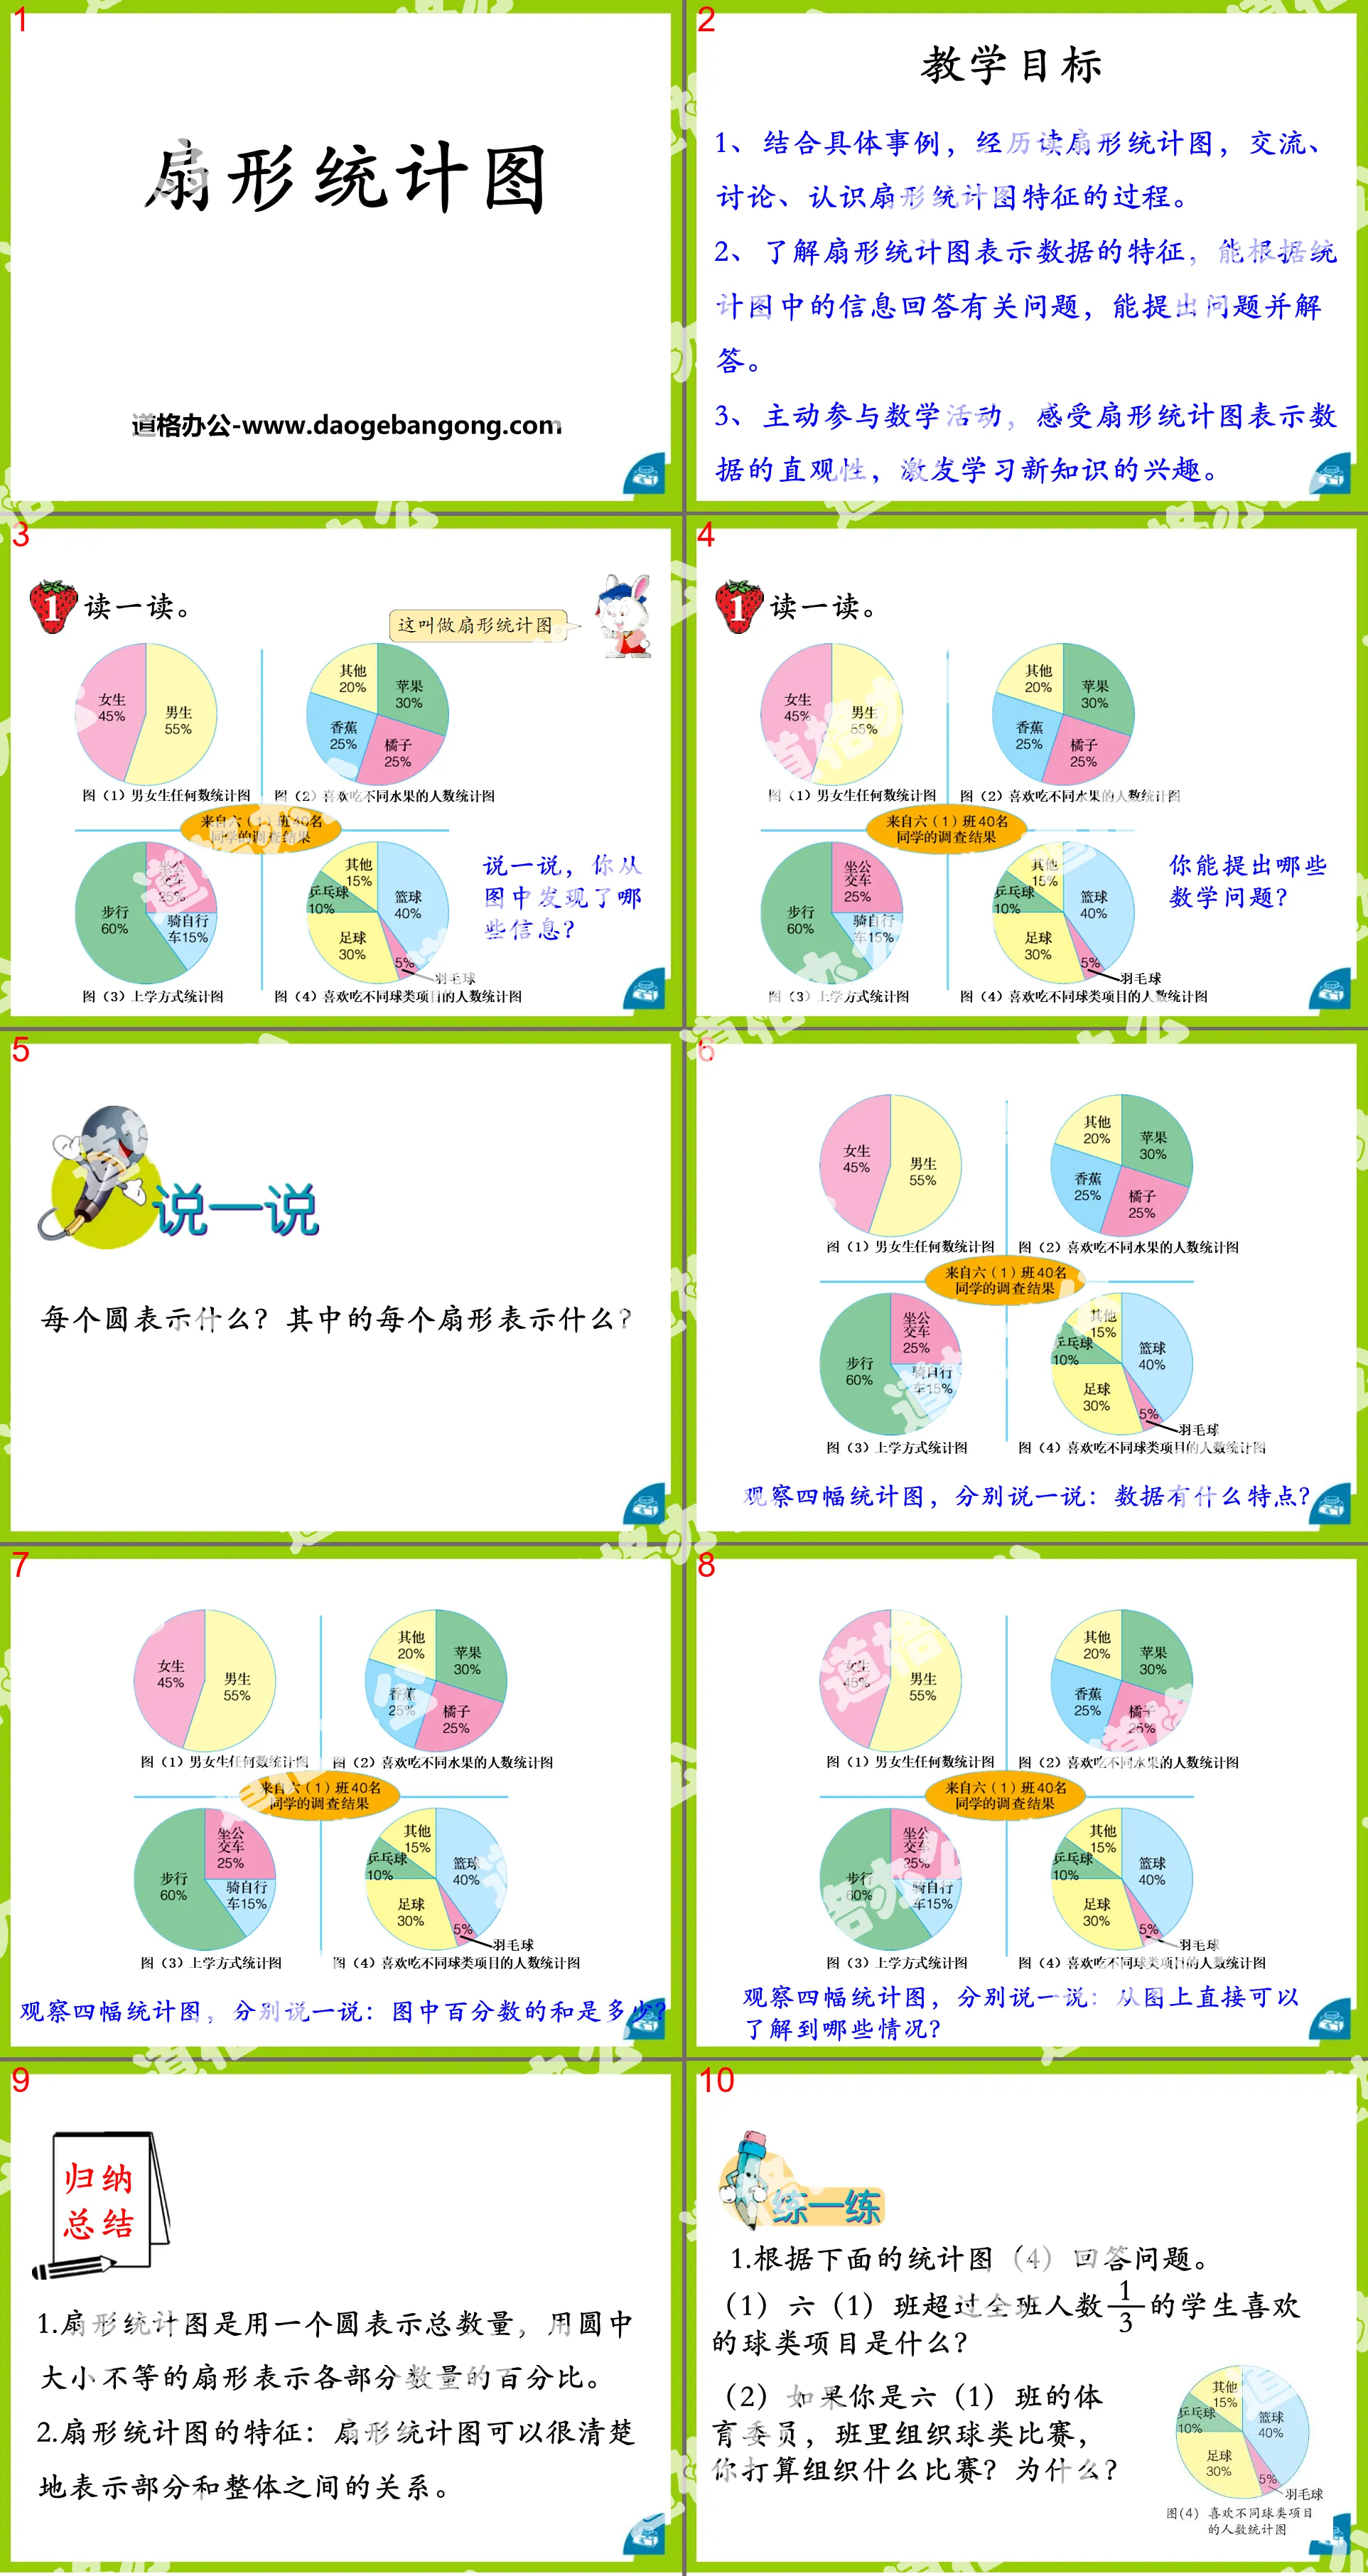
"Sector Chart" PPT courseware 6
teaching objectives
1. Combined with specific examples, experience the process of reading fan charts, communicating, discussing, and understanding the characteristics of fan charts.
2. Understand the characteristics of data represented by fan charts, be able to answer relevant questions based on the information in the statistical charts, and be able to ask questions and answer them.
3. Actively participate in mathematical activities, feel the intuitiveness of data represented by fan charts, and stimulate interest in learning new knowledge.
Read it.
Tell me, what information did you discover from the picture?
What math questions can you ask?
What does each circle represent? What does each sector represent?
Observe the four statistical charts and talk about each one: What are the characteristics of the data?
Observe the four statistical graphs and talk about each one: What is the sum of the percentages in the graph?
Observe the four statistical graphs and talk about each one: What can be learned directly from the graph?
In conclusion
1. A sector chart uses a circle to represent the total quantity, and sectors of different sizes in the circle to represent the percentage of each part of the quantity.
2. Characteristics of fan charts: Fan charts can clearly represent the relationship between parts and the whole.
practice
1. Answer the questions based on the statistical chart (4) below.
(1) What is the ball game that more than 1/3 of the students in Class 6 (1) like?
(2) If you are the sports committee member of Class 6 (1) and the class organizes a ball game, what game do you plan to organize? Why?
2. There are 80 people in the Children's Palace Chorus. Their age structure is as shown below. Fill in the blanks by looking at the picture.
(1) The largest number of students are _____ years old, accounting for _____% of the total number of choir members, with _____ people.
(2) The number of 12-year-old students accounts for _____% of the choir, and there are _____ people.
(3) Ask questions and answer them yourself.
3. Below is a statistical chart of the planting area of various crops in Lizhuang in autumn.
(1) How many hectares of cotton are planted in Lizhuang?
400×25%=100 (hectare)
(2) How many hectares of soybeans are planted in Lizhuang?
400×12.5%=50 (hectare)
(3) Ask questions and answer them yourself.
Keywords: sector chart teaching courseware, Hebei Education Edition sixth-grade mathematics PPT courseware download, sixth-grade mathematics slide courseware download, sector chart PPT courseware download, .PPT format;
For more information about the "Fan Chart" PPT courseware, please click the "Fan Chart ppt" tab.
"Choose an appropriate statistical chart to represent data" sector statistical chart PPT courseware:
"Selecting the Appropriate Statistical Chart to Represent Data" Sector Chart PPT Courseware Teaching Objectives 1. Combined with specific examples, experience the process of selecting statistical charts, discussing the characteristics of statistical charts, and using statistical charts to represent data intuitively and effectively. 2. Able to select appropriate statistics according to needs..
"Application of Fan Chart" PPT Courseware of Fan Chart:
"Application of Fan Charts" Fan Chart PPT Courseware Teaching Objectives 1. Combined with specific examples, experience the process of reading statistical charts, analyzing data information, asking questions and answering questions. 2. Be able to read statistical graphs in daily life and answer questions related to statistical information..
"Sector Chart" Flash Animation Courseware 2:
"Sector Chart" Flash Animation Courseware 2 This courseware is a Flash animation courseware for the teaching material of Unit 7 of the Sixth Grade Mathematics Volume 1 of the Hebei Education Edition. The content is vivid and vivid. Please download it! Keywords: Fan chart teaching courseware, Hebei Education Edition for sixth graders..
File Info
Update Time: 2024-11-25
This template belongs to Mathematics courseware Hebei Education Edition Sixth Grade Mathematics Volume 1 industry PPT template
"Sector Chart" PPT courseware 6 Simple campus recruitment activity planning plan summary enterprise and institution recruitment publicity lecture PPT template is a general PPT template for business post competition provided by the manuscript PPT, simple campus recruitment activity planning plan summary enterprise and institution recruitment promotion Lecture PPT template, you can edit and modify the text and pictures in the source file by downloading the source file. If you want more exquisite business PPT templates, you can come to grid resource. Doug resource PPT, massive PPT template slide material download, we only make high-quality PPT templates!
Tips: If you open the template and feel that it is not suitable for all your needs, you can search for related content "Sector Chart" PPT courseware 6 is enough.
How to use the Windows system template
Directly decompress the file and use it with office or wps
How to use the Mac system template
Directly decompress the file and use it Office or wps can be used
Related reading
For more detailed PPT-related tutorials and font tutorials, you can view: Click to see
How to create a high-quality technological sense PPT? 4 ways to share the bottom of the box
Notice
Do not download in WeChat, Zhihu, QQ, built-in browsers, please use mobile browsers to download! If you are a mobile phone user, please download it on your computer!
1. The manuscript PPT is only for study and reference, please delete it 24 hours after downloading.
2. If the resource involves your legitimate rights and interests, delete it immediately.
3. Contact information: service@daogebangong.com
"Sector Chart" PPT courseware 6, due to usage restrictions, it is only for personal study and reference use. For commercial use, please go to the relevant official website for authorization.
(Personal non-commercial use refers to the use of this font to complete the display of personal works, including but not limited to the design of personal papers, resumes, etc.)
Preview
Related Search:
"Sector Chart" PPT courseware 6
2024-11-25
Copyright statement: This material is compiled and released by the user of Daoge Resources. The copyright belongs to the author. For commercial use, please contact the copyright owner. If there is any infringement, please contact the webmaster to remove the resource.
Download Points: 0.00
Free Download
Upgrade VIP
Favorite
Views: 1316 / Downloads: 722


