Western Normal University Edition First Grade Mathematics Volume 1
Beijing Normal University Edition Seventh Grade Mathematics Volume 1
People's Education Press First Grade Mathematics Volume 1
People's Education Press Second Grade Mathematics Volume 1
People's Education Press Third Grade Mathematics Volume 1
Beijing Normal University Edition Seventh Grade Mathematics Volume 2
Qingdao Edition Seventh Grade Mathematics Volume 1
Beijing Normal University Edition Fifth Grade Mathematics Volume 1
Beijing Normal University Edition Eighth Grade Mathematics Volume 1
Hebei Education Edition Third Grade Mathematics Volume 1
People's Education High School Mathematics Edition B Compulsory Course 2
Hebei Education Edition Seventh Grade Mathematics Volume 2
Hebei Education Edition Fourth Grade Mathematics Volume 2
Beijing Normal University Edition Fifth Grade Mathematics Volume 2
Qingdao Edition Seventh Grade Mathematics Volume 2
People's Education Press First Grade Mathematics Volume 2
| Category | Format | Size |
|---|---|---|
| Beijing Normal University eighth grade first volume mathematics | pptx | 6 MB |

"Median and Mode" Data Analysis PPT Courseware 2
2024-10-17
Copyright statement: This material is compiled and released by the user of Daoge Resources. The copyright belongs to the author. For commercial use, please contact the copyright owner. If there is any infringement, please contact the webmaster to remove the resource.
Download Points: 0.00
Free Download
Upgrade VIP
Favorite
Views: 4851 / Downloads: 920
Description
"Median and Mode" Data Analysis PPT Courseware 2
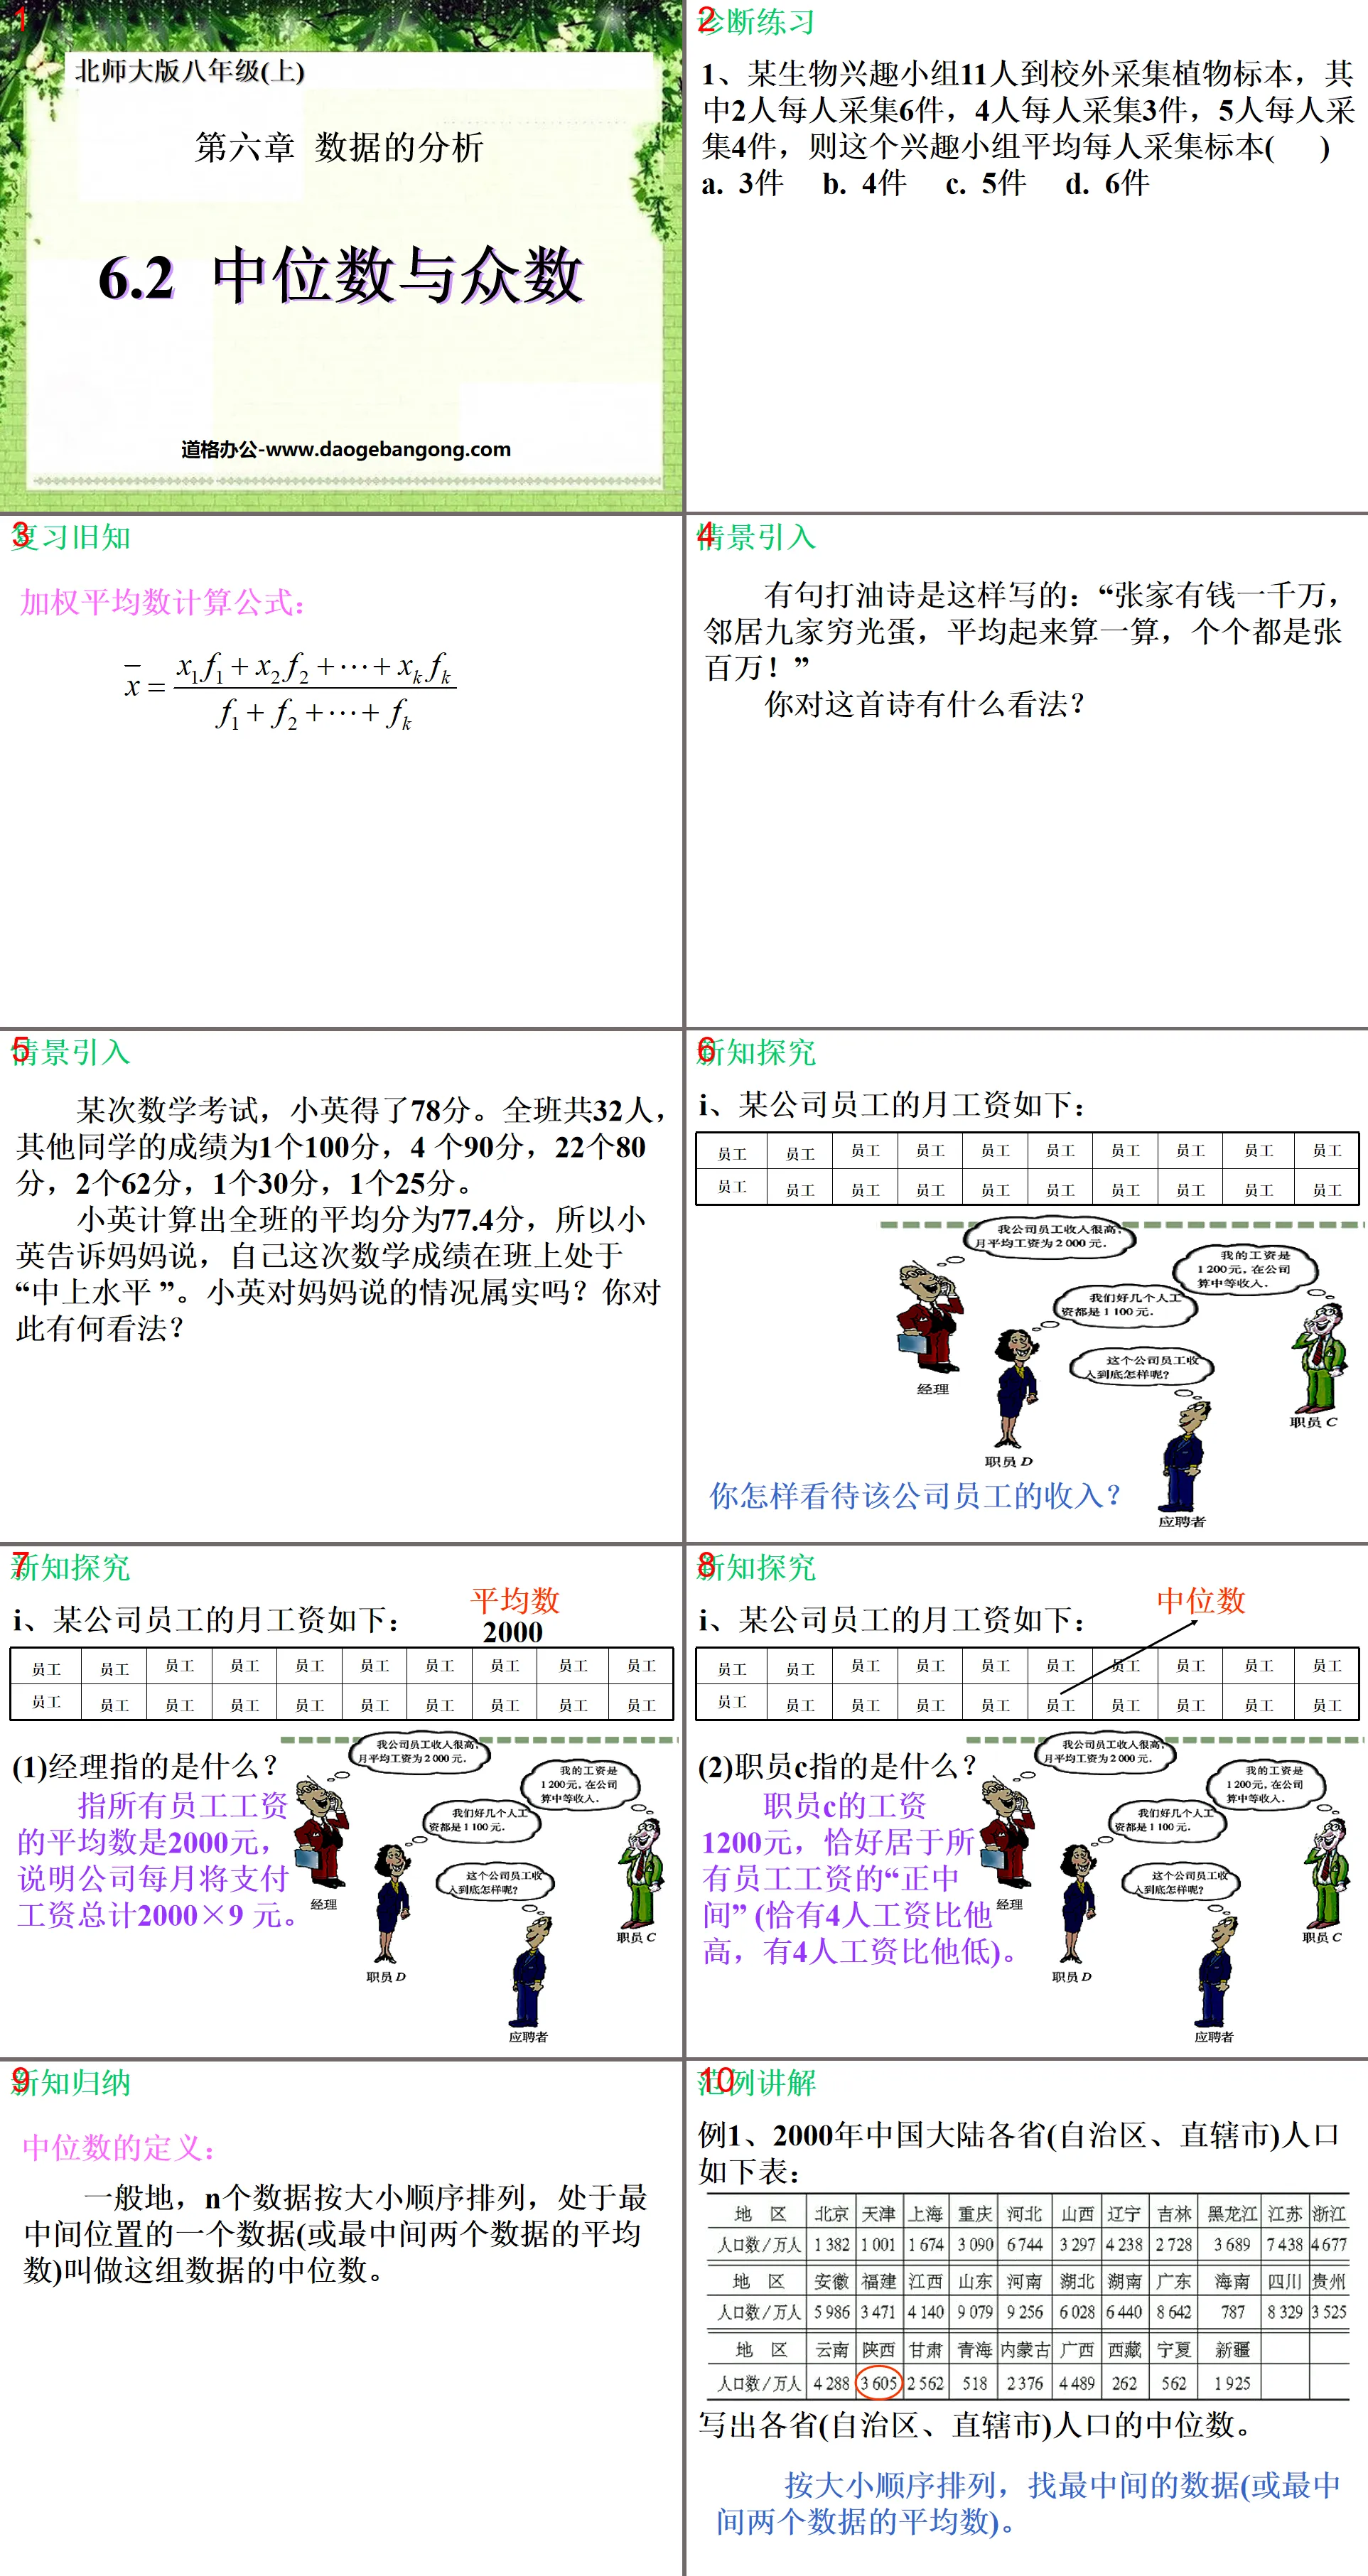
diagnostic exercise
1. A biological interest group of 11 people went outside the school to collect plant specimens. Among them, 2 people collected 6 specimens each, 4 people collected 3 specimens each, and 5 people each collected 4 specimens. Then the average number of specimens collected by each person in this interest group is ( )
A. 3 pieces B. 4 pieces C. 5 pieces D. 6 pieces
In a certain math test, Xiaoying scored 78 points. There are 32 people in the class. The scores of other students are 1 100 points, 4 90 points, 22 80 points, 2 62 points, 1 30 points, and 1 25 points.
Xiaoying calculated that the average score of the whole class was 77.4 points, so Xiaoying told her mother that her math score this time was at the "above average level" in the class. Is what Xiaoying told her mother true? What do you think about this?
Definition of median:
Generally, n data are arranged in order of size, and the data in the middle (or the average of the two middle data) is called the median of this set of data.
What the data represents:
The mean, median, and mode are all representatives of data, and they describe the "average level" of a set of data.
What are the characteristics of the median?
Using the median as a representative of a set of data has poor reliability. It cannot fully utilize the information of all data, but it is not affected by extreme values. When individual data in a set of data change significantly, it can be used to Describe the "central tendency" of this set of data.
What are the characteristics of mode?
Using the mode as a representative of a set of data has poor reliability. Its size is only related to part of the data in the set of data, but it is not affected by extreme values. When certain data appear repeatedly in a set of data, the mode is often a statistic that people are particularly concerned about.
Class summary
1. Definition of median: Generally, n data are arranged in order of size, and the data in the middle (or the average of the two middle data) is called the median of this set of data.
2. Definition of mode: The data that appears most frequently in a set of data is called the mode of this set of data.
3. The meaning of data representation: The average, median, and mode are all representatives of data. They describe the "average level" of a set of data.
Keywords: data analysis courseware, median and mode courseware, Beijing Normal University edition eighth grade mathematics volume PPT courseware, eighth grade mathematics slide courseware download, data analysis PPT courseware download, median and mode PPT courseware Download, .ppt format
For more information about the "Data Analysis Median and Mode" PPT courseware, please click the Data Analysis ppt Median and Mode ppt tag.
"Median and Mode" Data Analysis PPT Courseware 3:
"Median and Mode" Data Analysis PPT Courseware 2 Review Introduction What is the median? 1. Median: Arrange a set of data in order from small to large (or large to small), then the number in the middle is the median of this set of data; if the data...
"Median and Mode" data analysis PPT courseware:
"Median and Mode" Data Analysis PPT Courseware Average: used to reflect the central tendency of a set of data and reflect the average level of a set of data. The sign on the riverside says that the average depth is 1.1m. Can a pony with a height of only 1.4m wade across the river without being in danger?
File Info
Update Time: 2024-10-17
This template belongs to Mathematics courseware Beijing Normal University eighth grade first volume mathematics industry PPT template
"Median and Mode" Data Analysis PPT Courseware 2 Simple campus recruitment activity planning plan summary enterprise and institution recruitment publicity lecture PPT template is a general PPT template for business post competition provided by the manuscript PPT, simple campus recruitment activity planning plan summary enterprise and institution recruitment promotion Lecture PPT template, you can edit and modify the text and pictures in the source file by downloading the source file. If you want more exquisite business PPT templates, you can come to grid resource. Doug resource PPT, massive PPT template slide material download, we only make high-quality PPT templates!
Tips: If you open the template and feel that it is not suitable for all your needs, you can search for related content "Median and Mode" Data Analysis PPT Courseware 2 is enough.
How to use the Windows system template
Directly decompress the file and use it with office or wps
How to use the Mac system template
Directly decompress the file and use it Office or wps can be used
Related reading
For more detailed PPT-related tutorials and font tutorials, you can view: Click to see
How to create a high-quality technological sense PPT? 4 ways to share the bottom of the box
Notice
Do not download in WeChat, Zhihu, QQ, built-in browsers, please use mobile browsers to download! If you are a mobile phone user, please download it on your computer!
1. The manuscript PPT is only for study and reference, please delete it 24 hours after downloading.
2. If the resource involves your legitimate rights and interests, delete it immediately.
3. Contact information: service@daogebangong.com
"Median and Mode" Data Analysis PPT Courseware 2, due to usage restrictions, it is only for personal study and reference use. For commercial use, please go to the relevant official website for authorization.
(Personal non-commercial use refers to the use of this font to complete the display of personal works, including but not limited to the design of personal papers, resumes, etc.)
Preview
Related Search:
"Median and Mode" Data Analysis PPT Courseware 2
2024-10-17
Copyright statement: This material is compiled and released by the user of Daoge Resources. The copyright belongs to the author. For commercial use, please contact the copyright owner. If there is any infringement, please contact the webmaster to remove the resource.
Download Points: 0.00
Free Download
Upgrade VIP
Favorite
Views: 4851 / Downloads: 920


