
"Histogram" data collection, organization and description PPT courseware 2 Simple campus recruitment activity planning plan summary enterprise and institution recruitment publicity lecture PPT template is a general PPT template for business post competition provided by the manuscript PPT, simple campus recruitment activity planning plan summary enterprise and institution recruitment promotion Lecture PPT template, you can edit and modify the text and pictures in the source file by downloading the source file. If you want more exquisite business PPT templates, you can come to grid resource. Doug resource PPT, massive PPT template slide material download, we only make high-quality PPT templates!
| 文件名 如何下载使用 | 下载次数 | Download Points | 下载地址 |
|---|---|---|---|
| "Histogram" data collect... | 8525次 | 0.00 | Free Download |
Tips: If you open the template and feel that it is not suitable for all your needs, you can search for related content "Histogram" data collection, organization and description PPT courseware 2 is enough.
How to use the Windows system template
Directly decompress the file and use it with office or wps
How to use the Mac system template
Directly decompress the file and use it Office or wps can be used
Related reading
For more detailed PPT-related tutorials and font tutorials, you can view: Click to see
How to create a high-quality technological sense PPT? 4 ways to share the bottom of the box
Notice
Do not download in WeChat, Zhihu, QQ, built-in browsers, please use mobile browsers to download! If you are a mobile phone user, please download it on your computer!
1. The manuscript PPT is only for study and reference, please delete it 24 hours after downloading.
2. If the resource involves your legitimate rights and interests, delete it immediately.
3. Contact information: service@daogebangong.com
"Histogram" data collection, organization and description PPT courseware 2, due to usage restrictions, it is only for personal study and reference use. For commercial use, please go to the relevant official website for authorization.
(Personal non-commercial use refers to the use of this font to complete the display of personal works, including but not limited to the design of personal papers, resumes, etc.)

Related reading
For more detailed PPT-related tutorials and font tutorials, you can view:Please click to see


Authoritative PPT Summary
"Histogram" data collection, organization and description PPT courseware 2
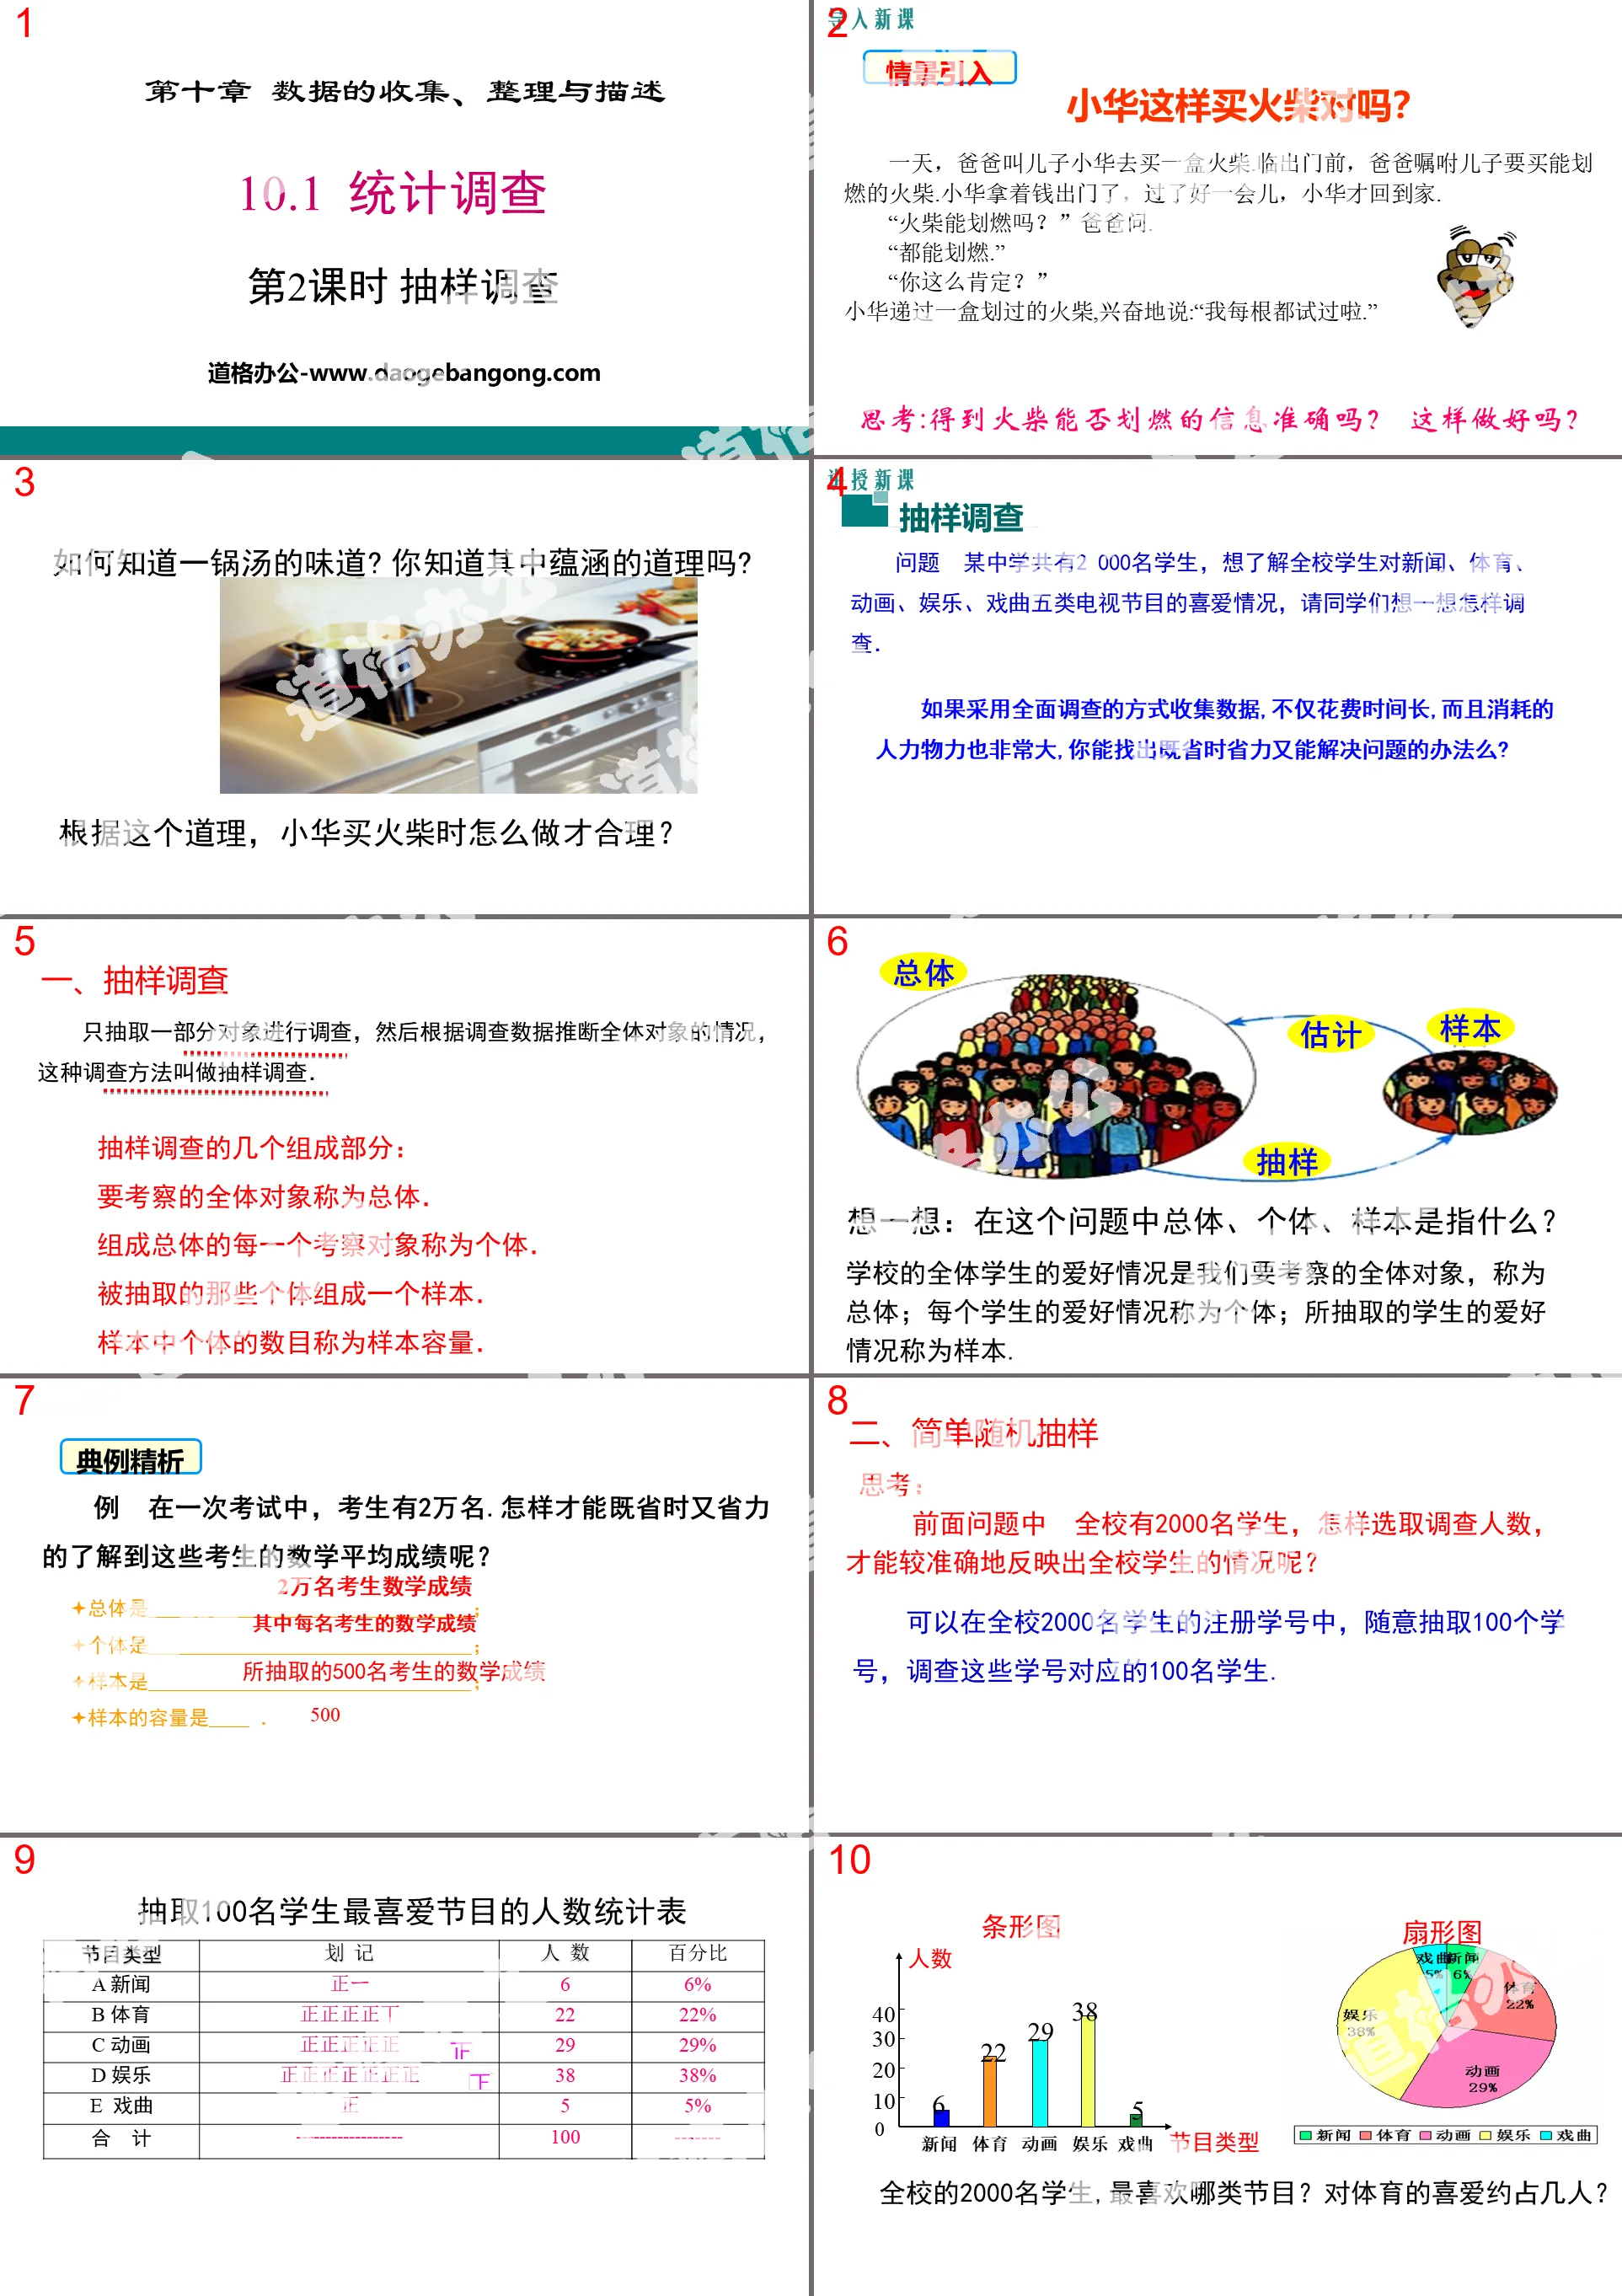
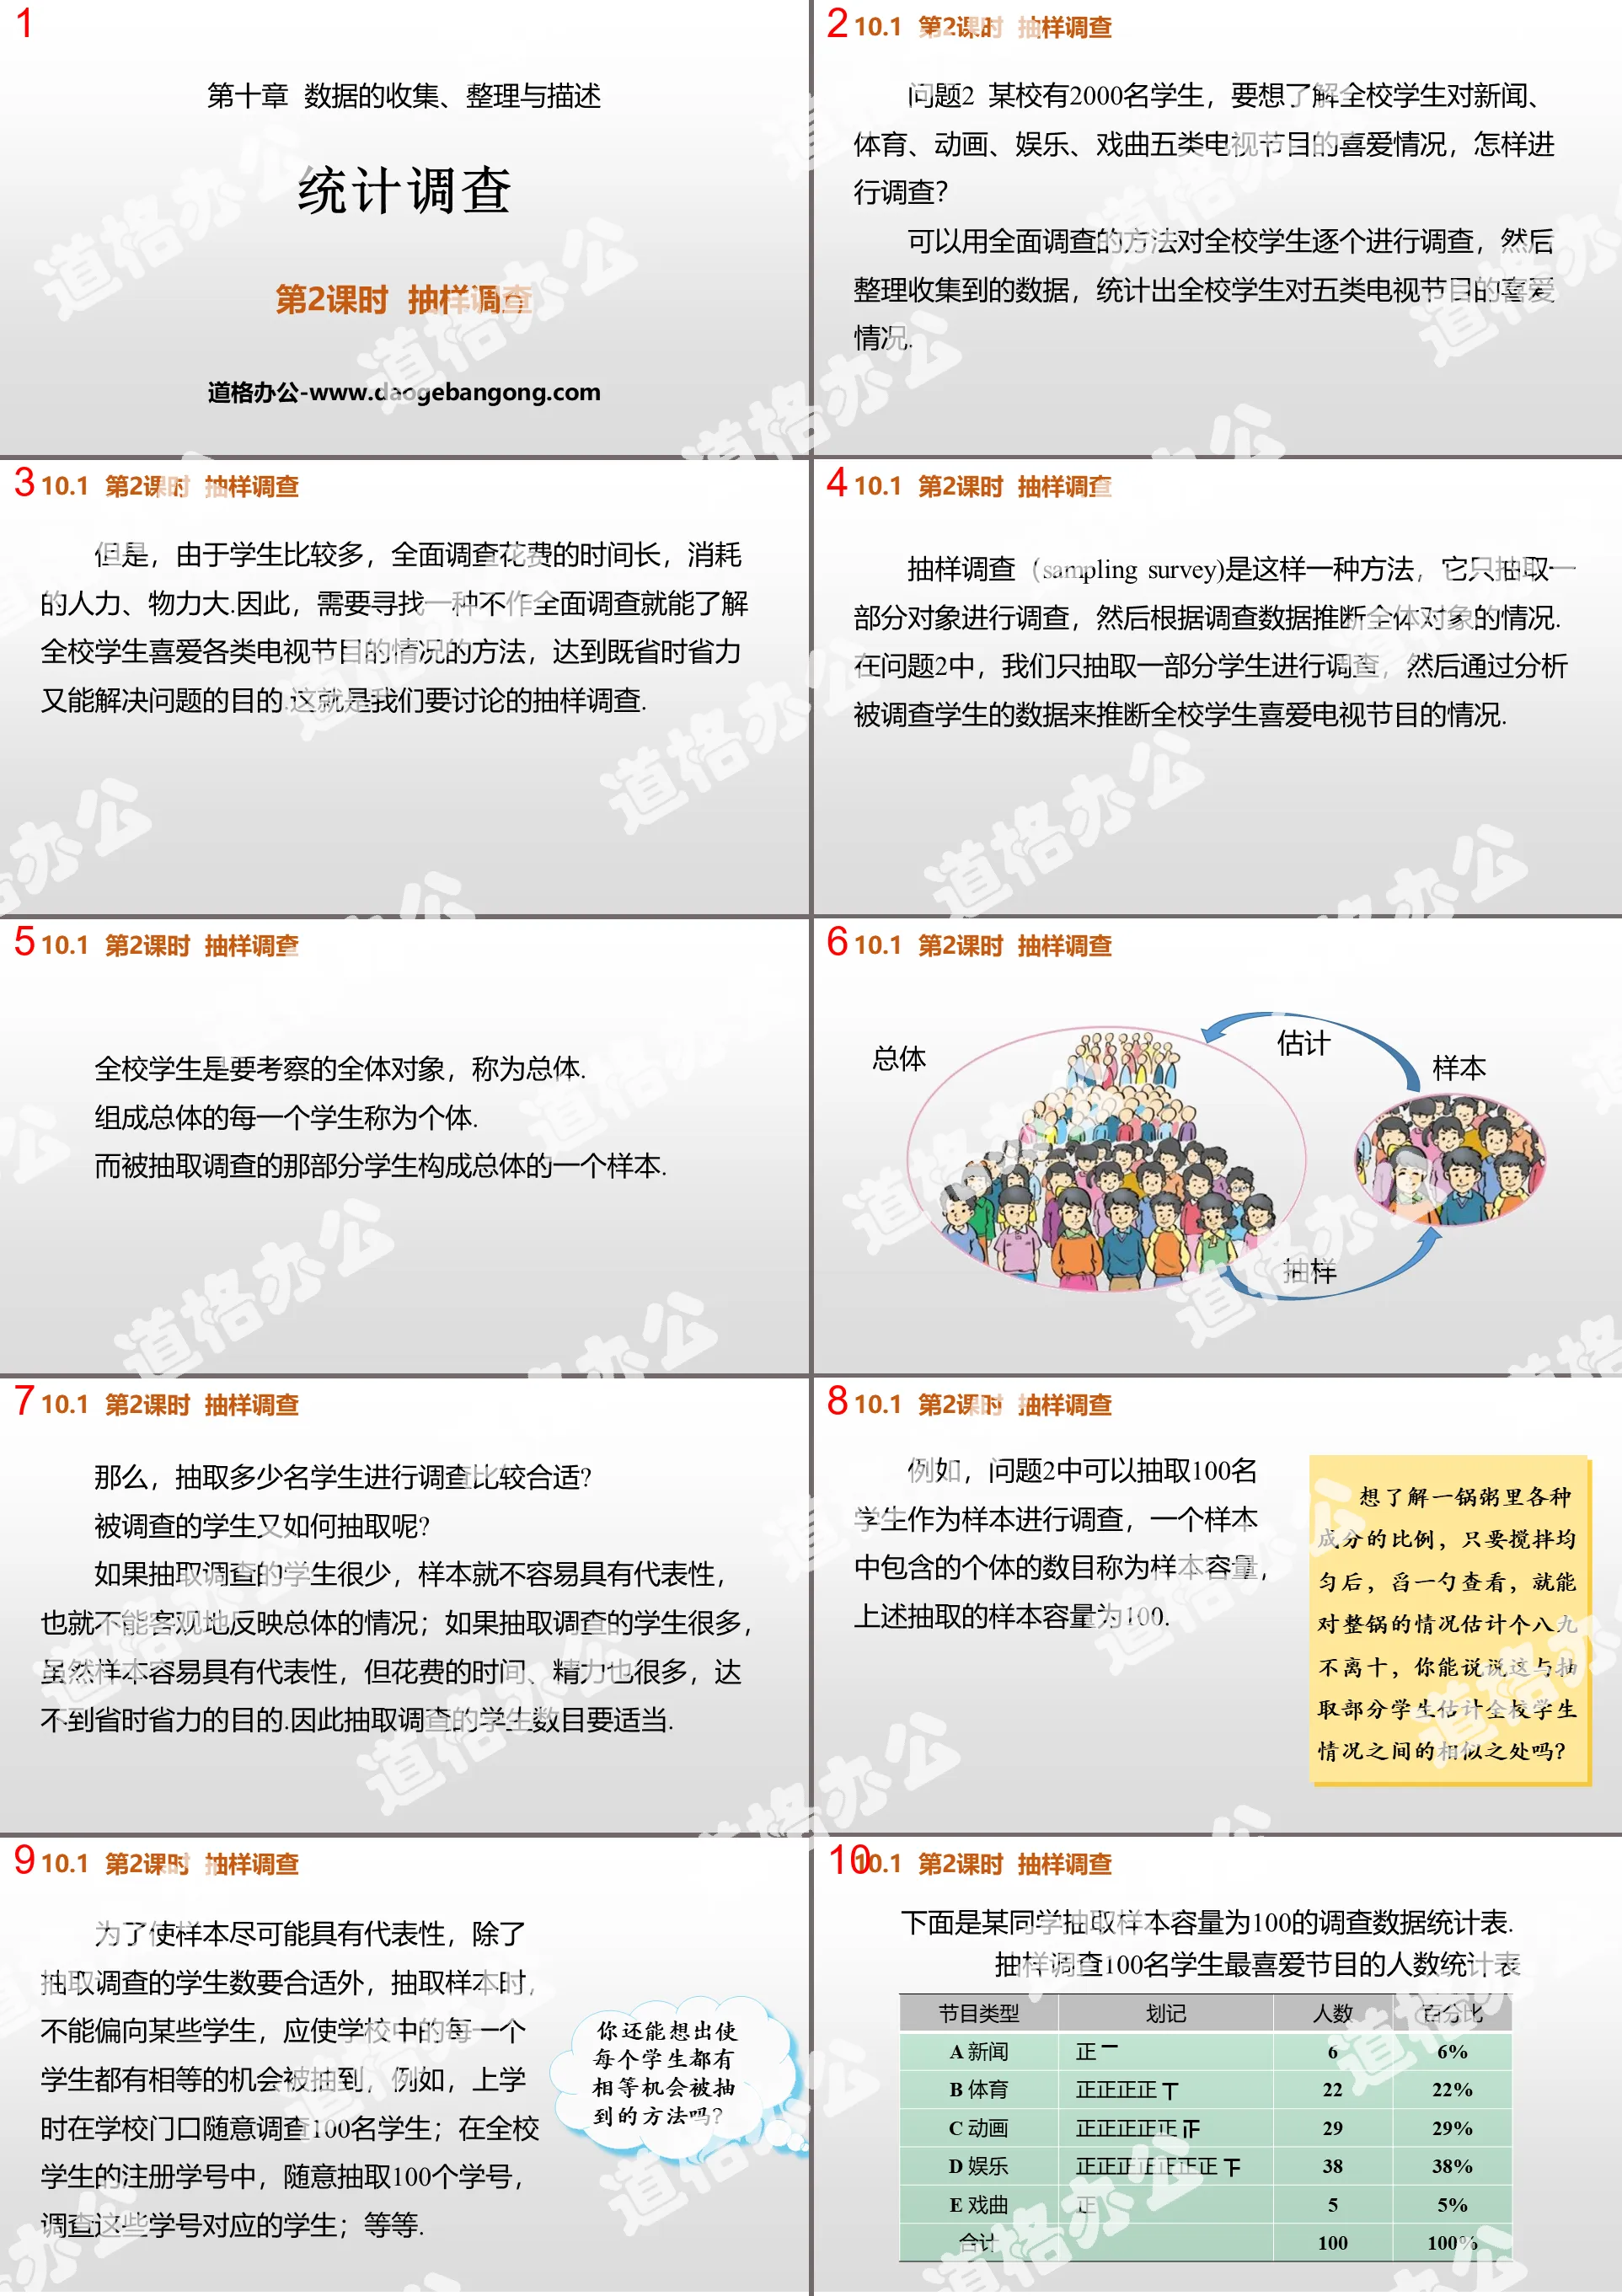
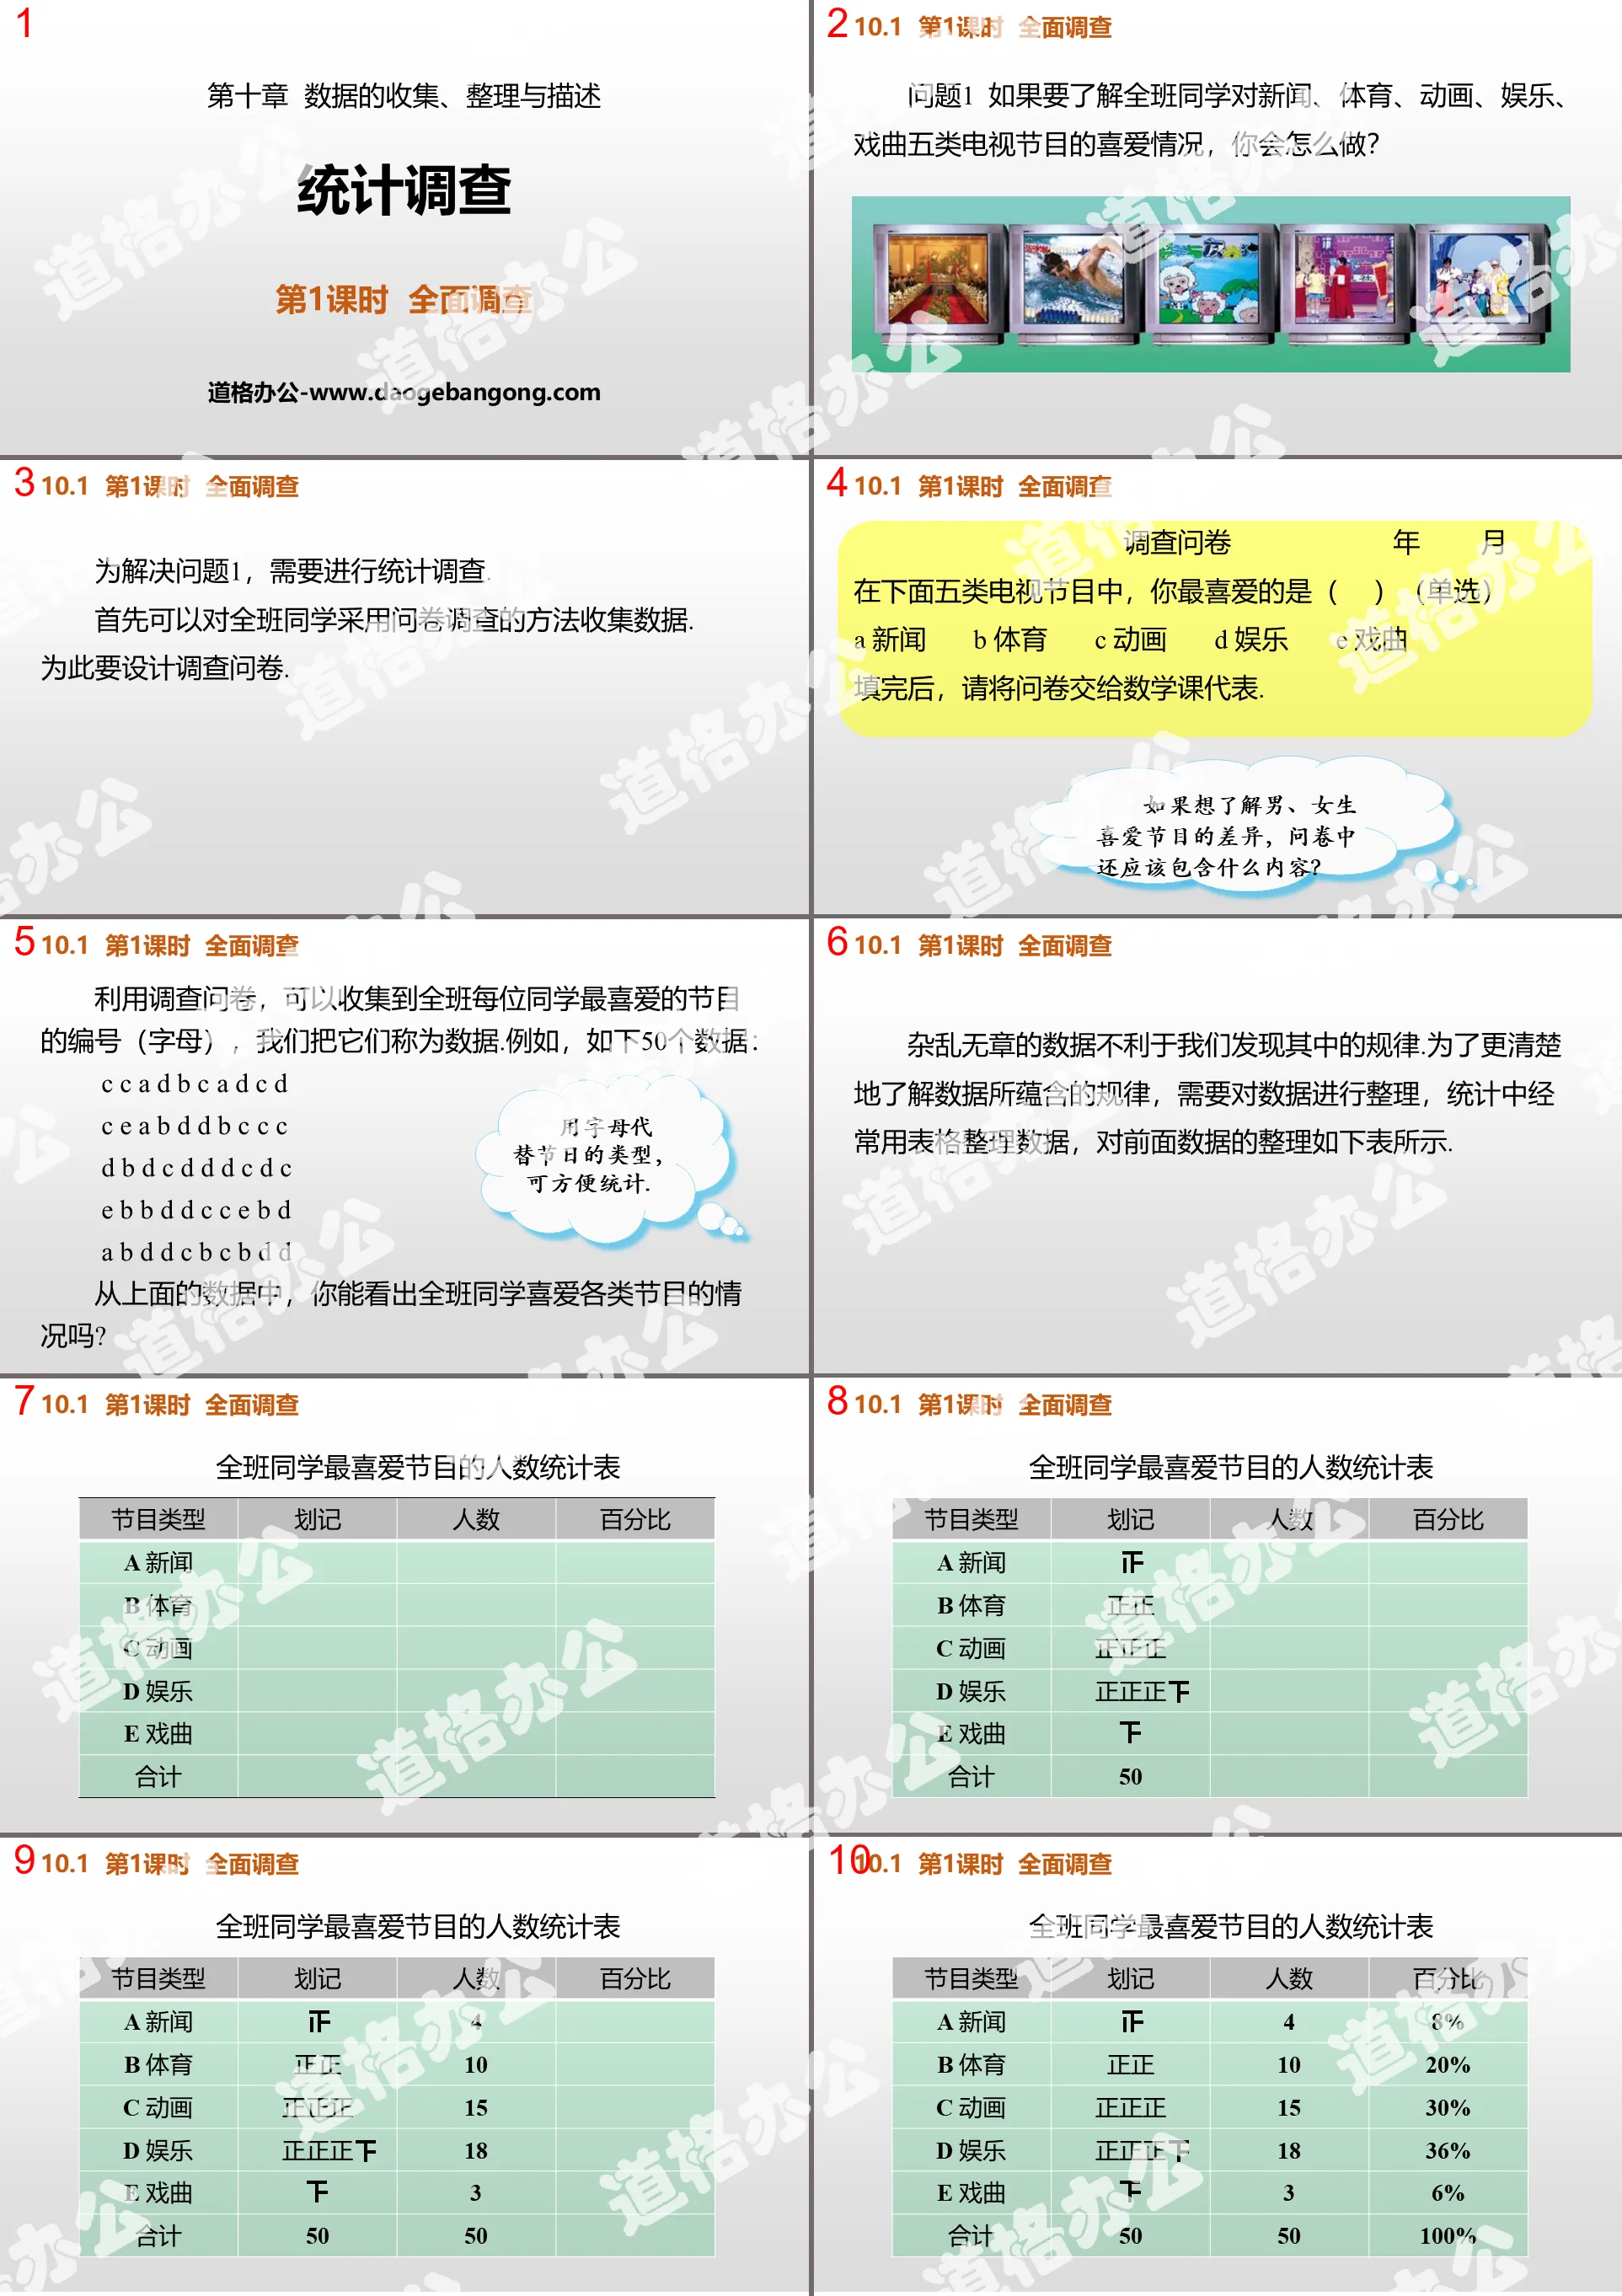
Import new class:
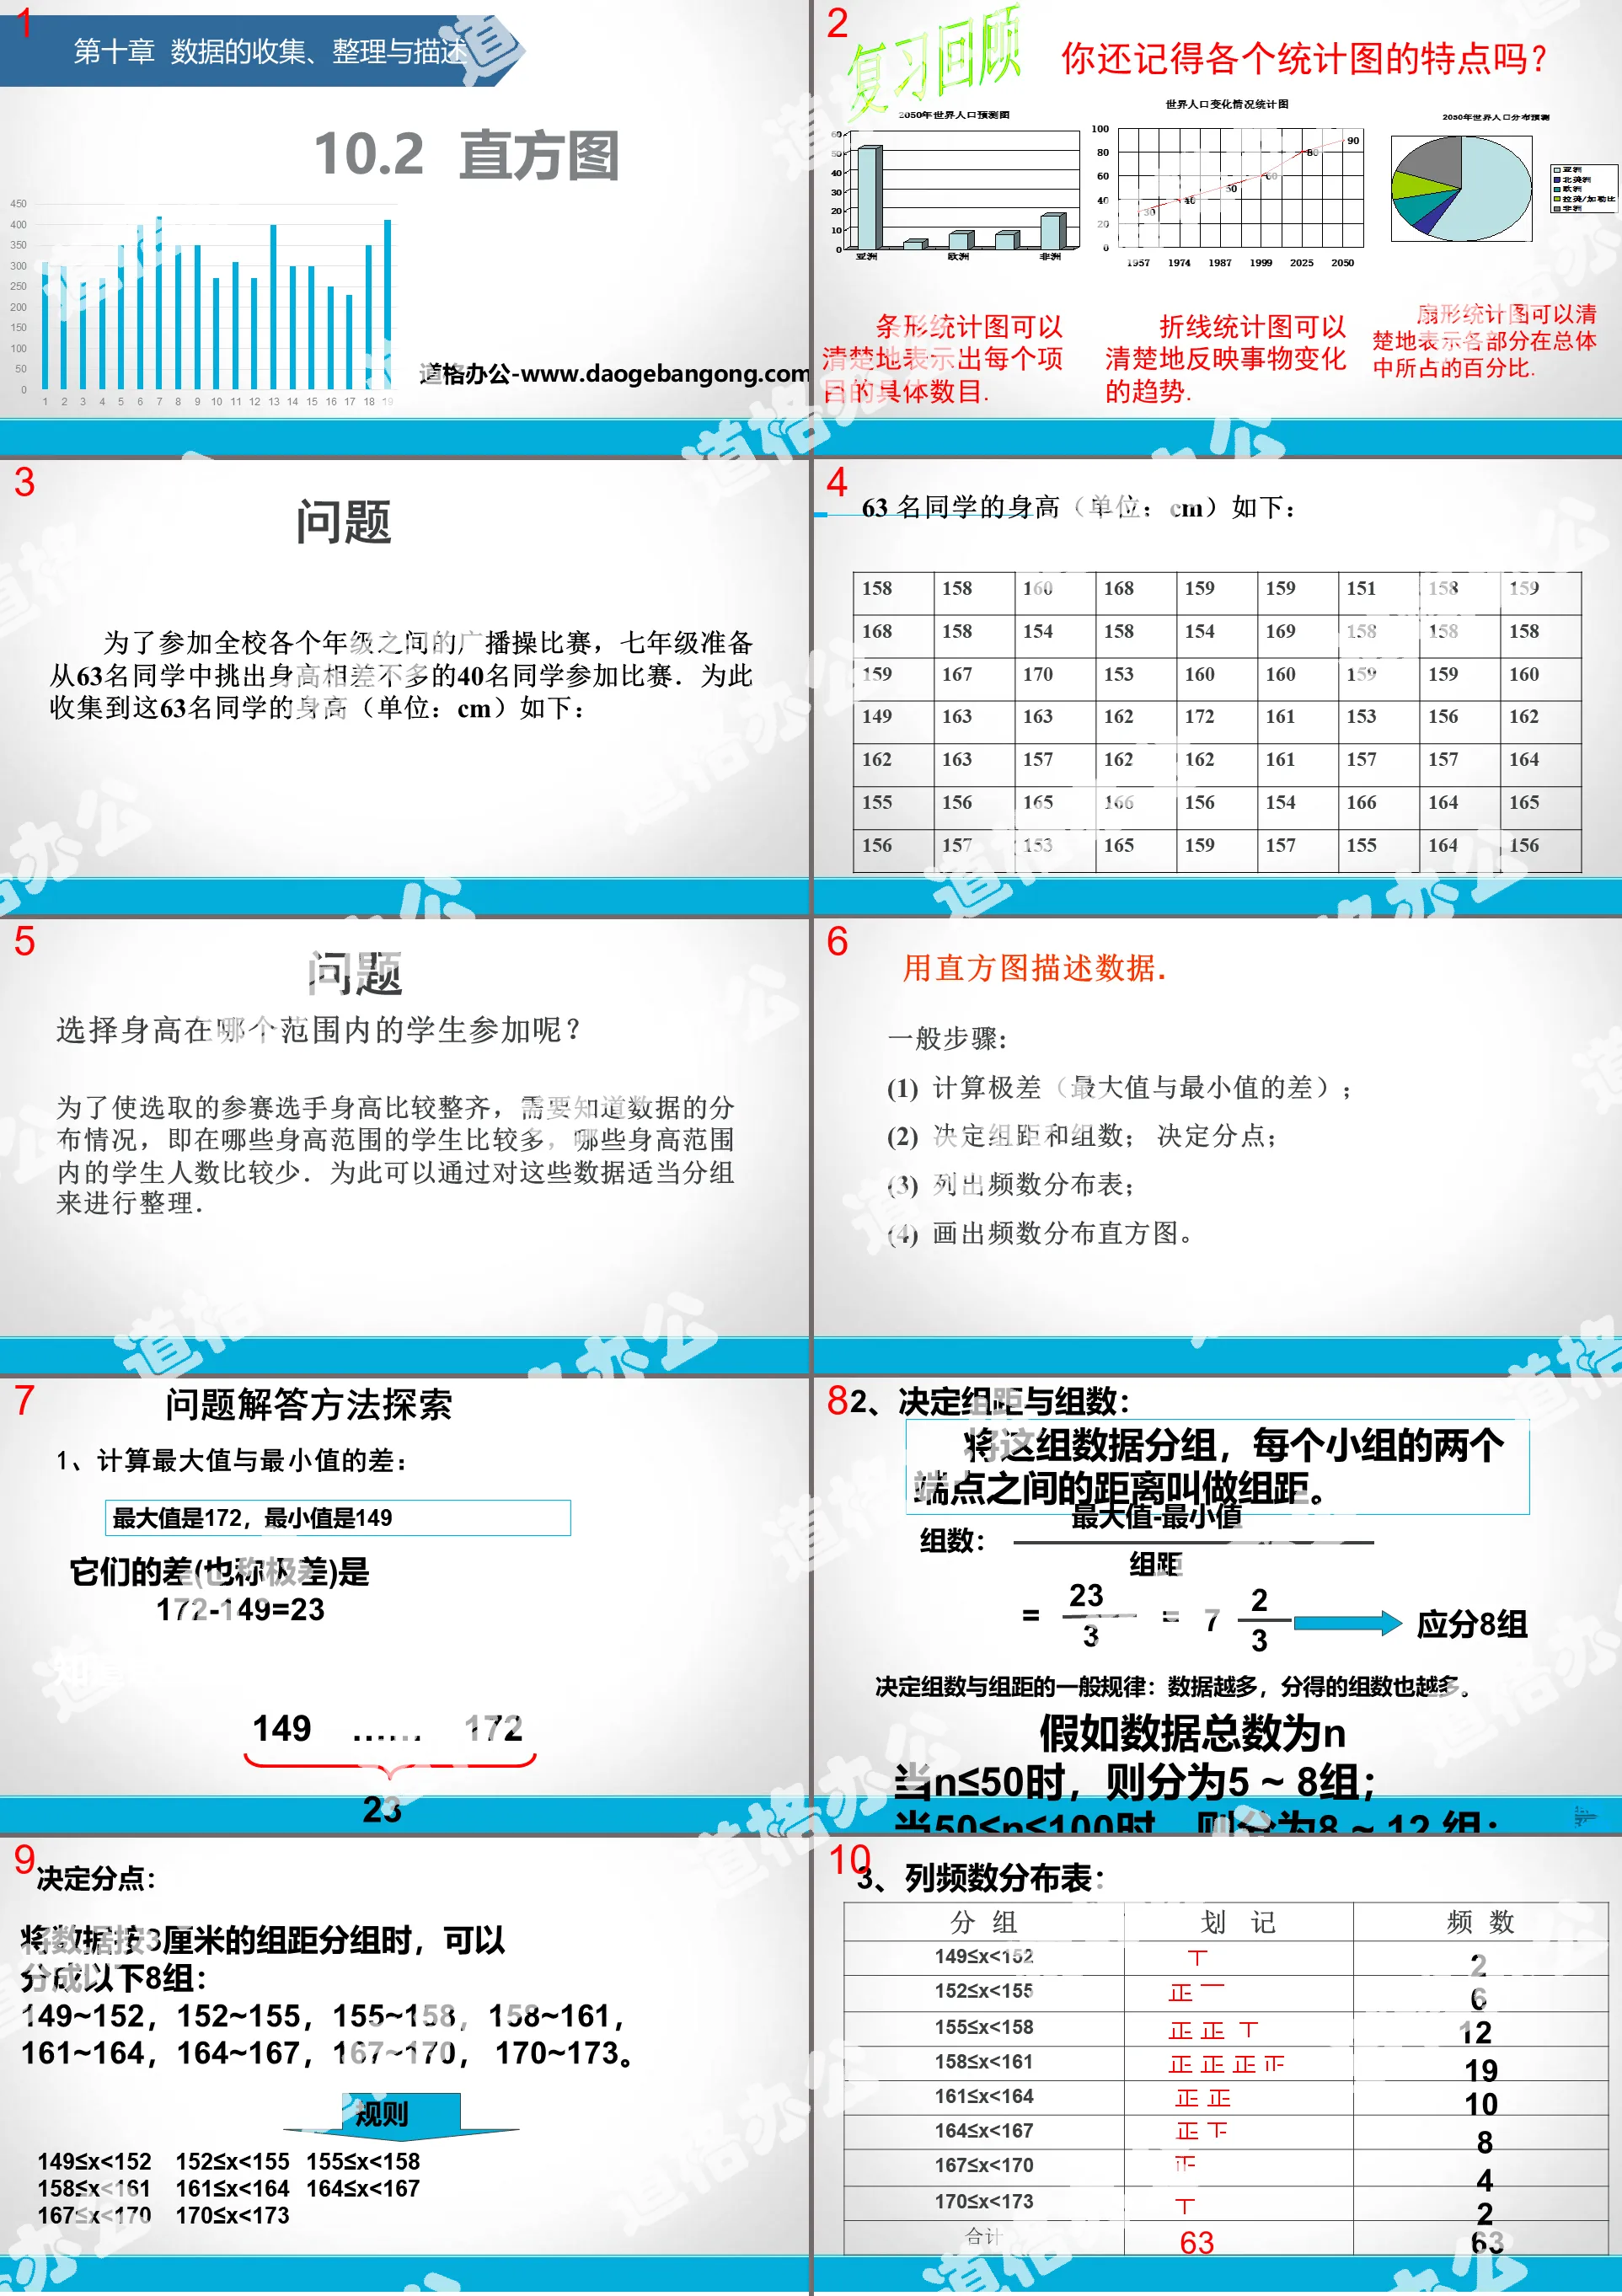
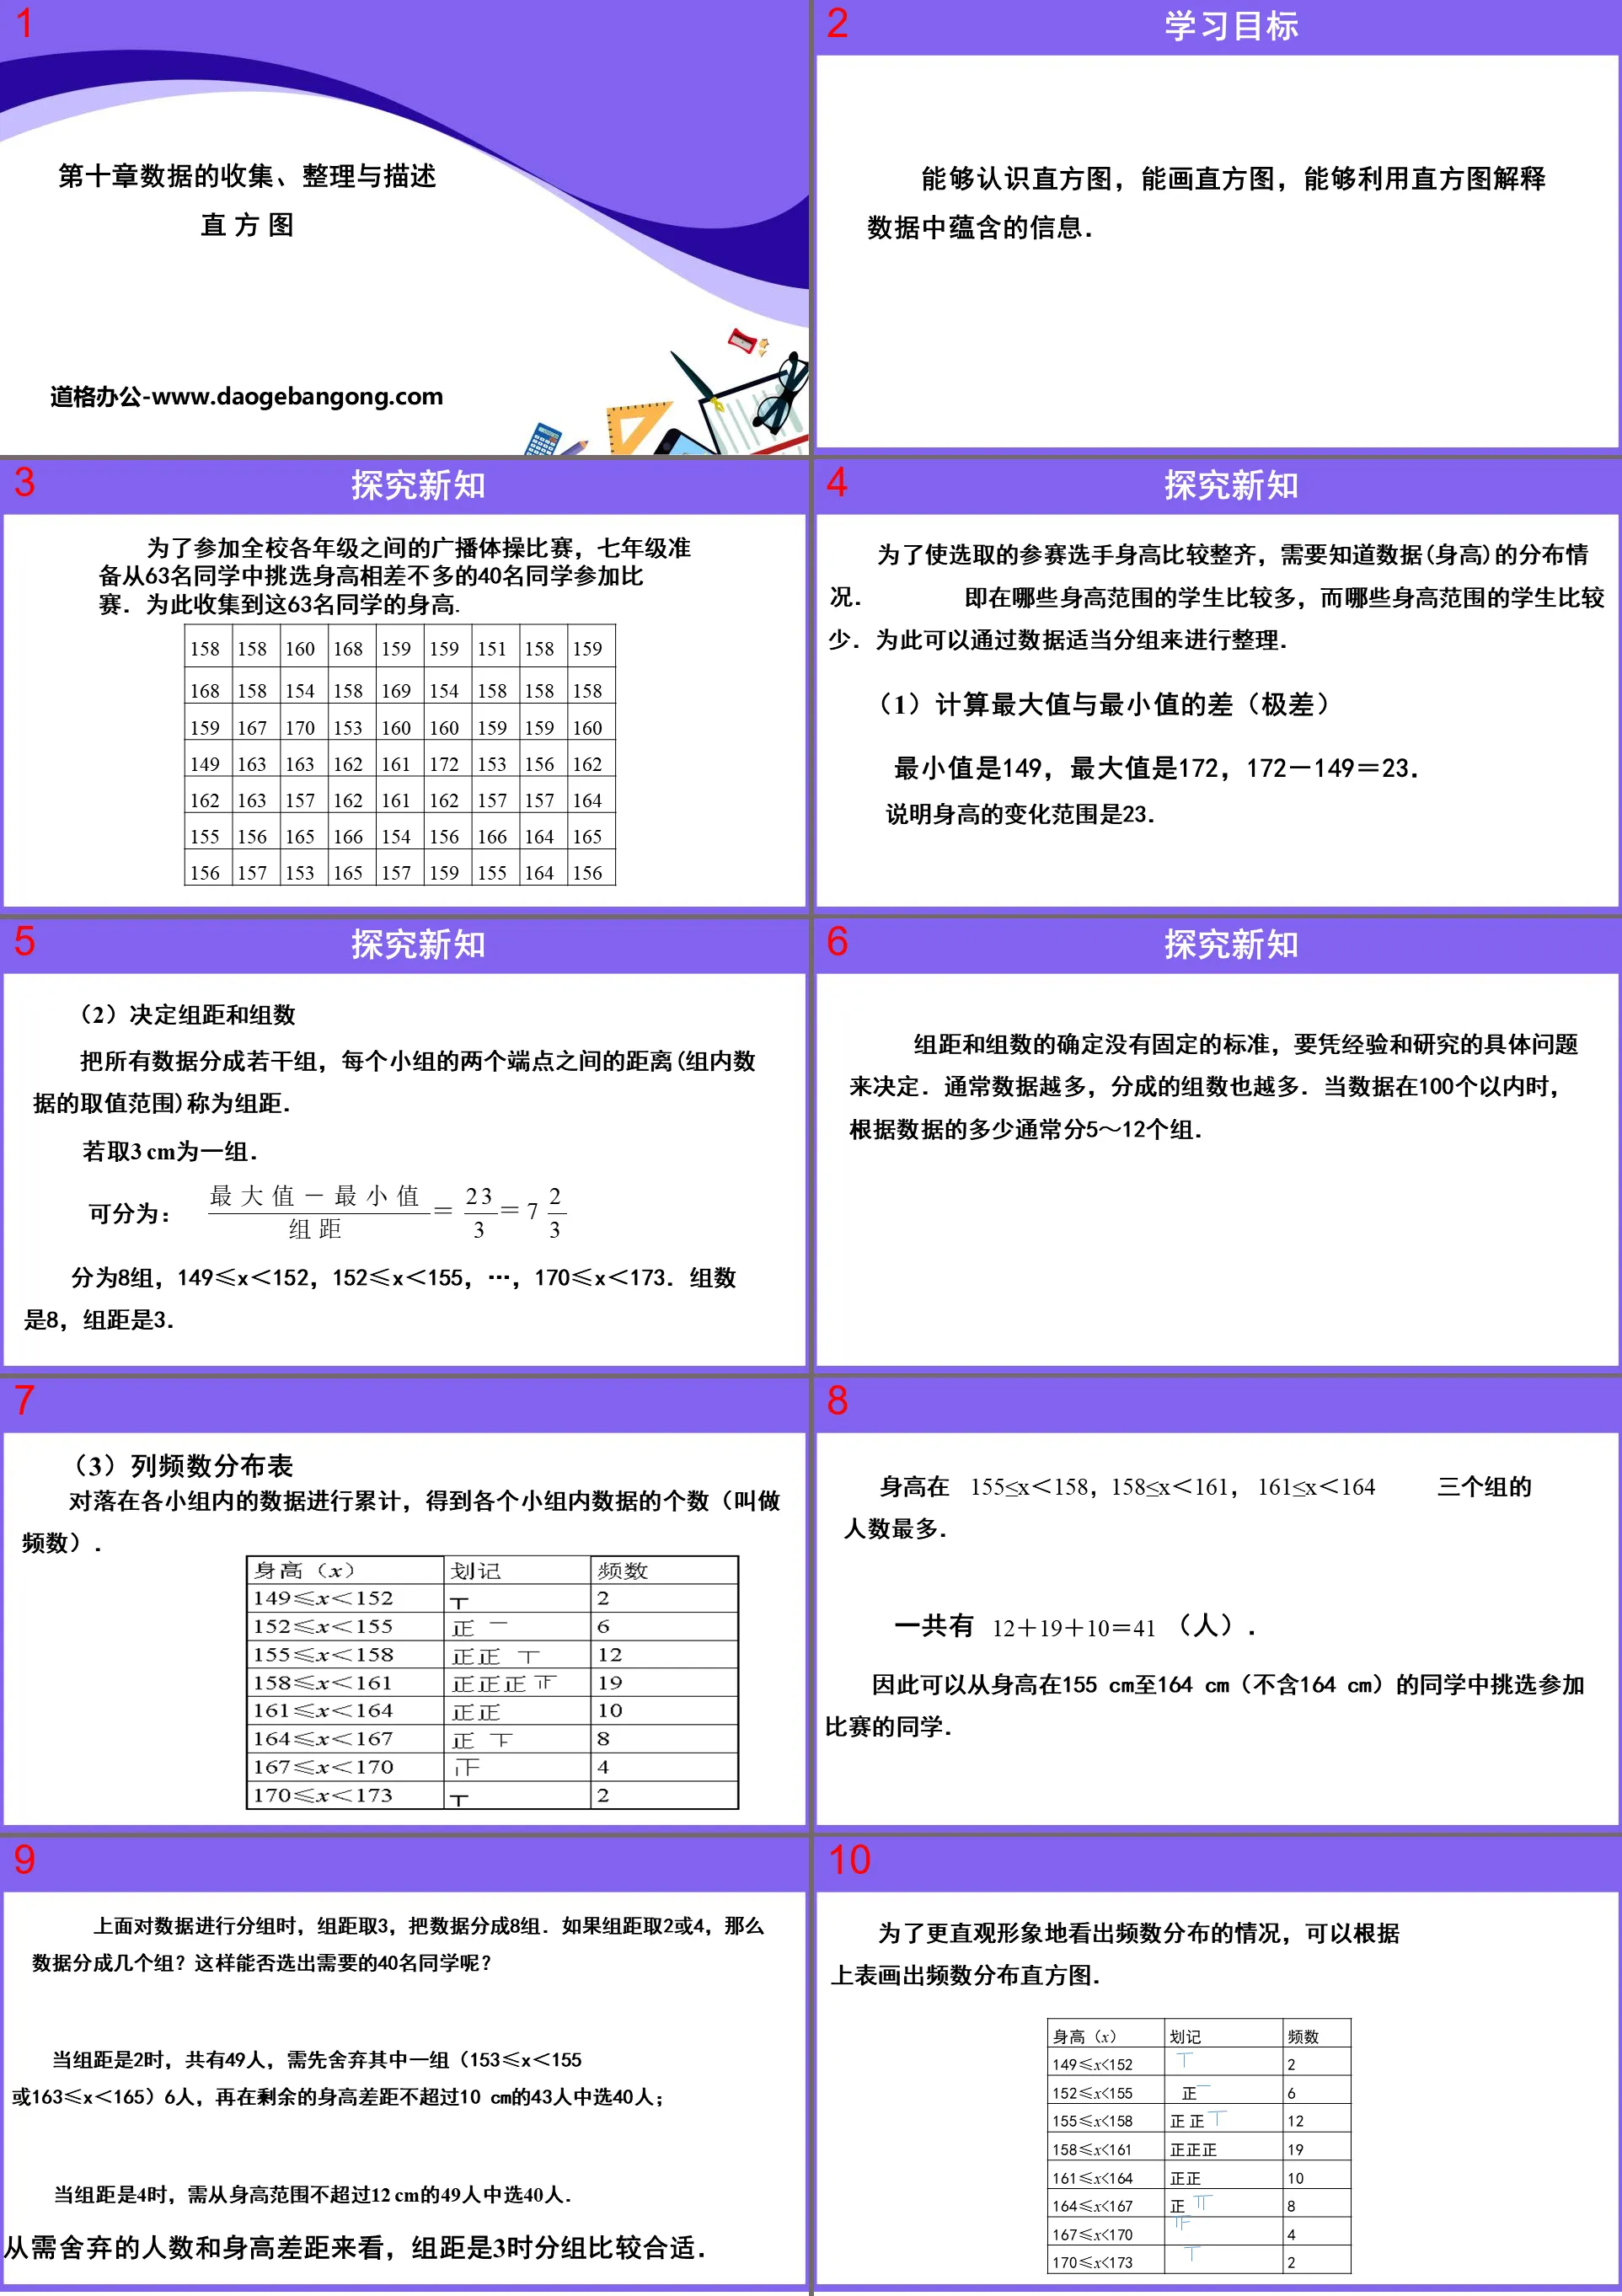
In order to understand the physical development of middle school students, the heights of 60 girls of the same age in a middle school were measured. The results are as follows (unit: cm)
167 154 159 166 169 159 156 166 162 158
159 156 166 160 164 160 157 156 157 161
160 156 166 160 164 160 157 156 157 161
158 158 153 158 164 158 163 158 153 157
162 162 159 154 165 166 157 151 146 151
158 160 165 158 163 163 162 161 154 165
162 162 159 157 159 149 164 168 159 153
To know the proportion of the height data of 60 girls in each small range, the data needs to be sorted.
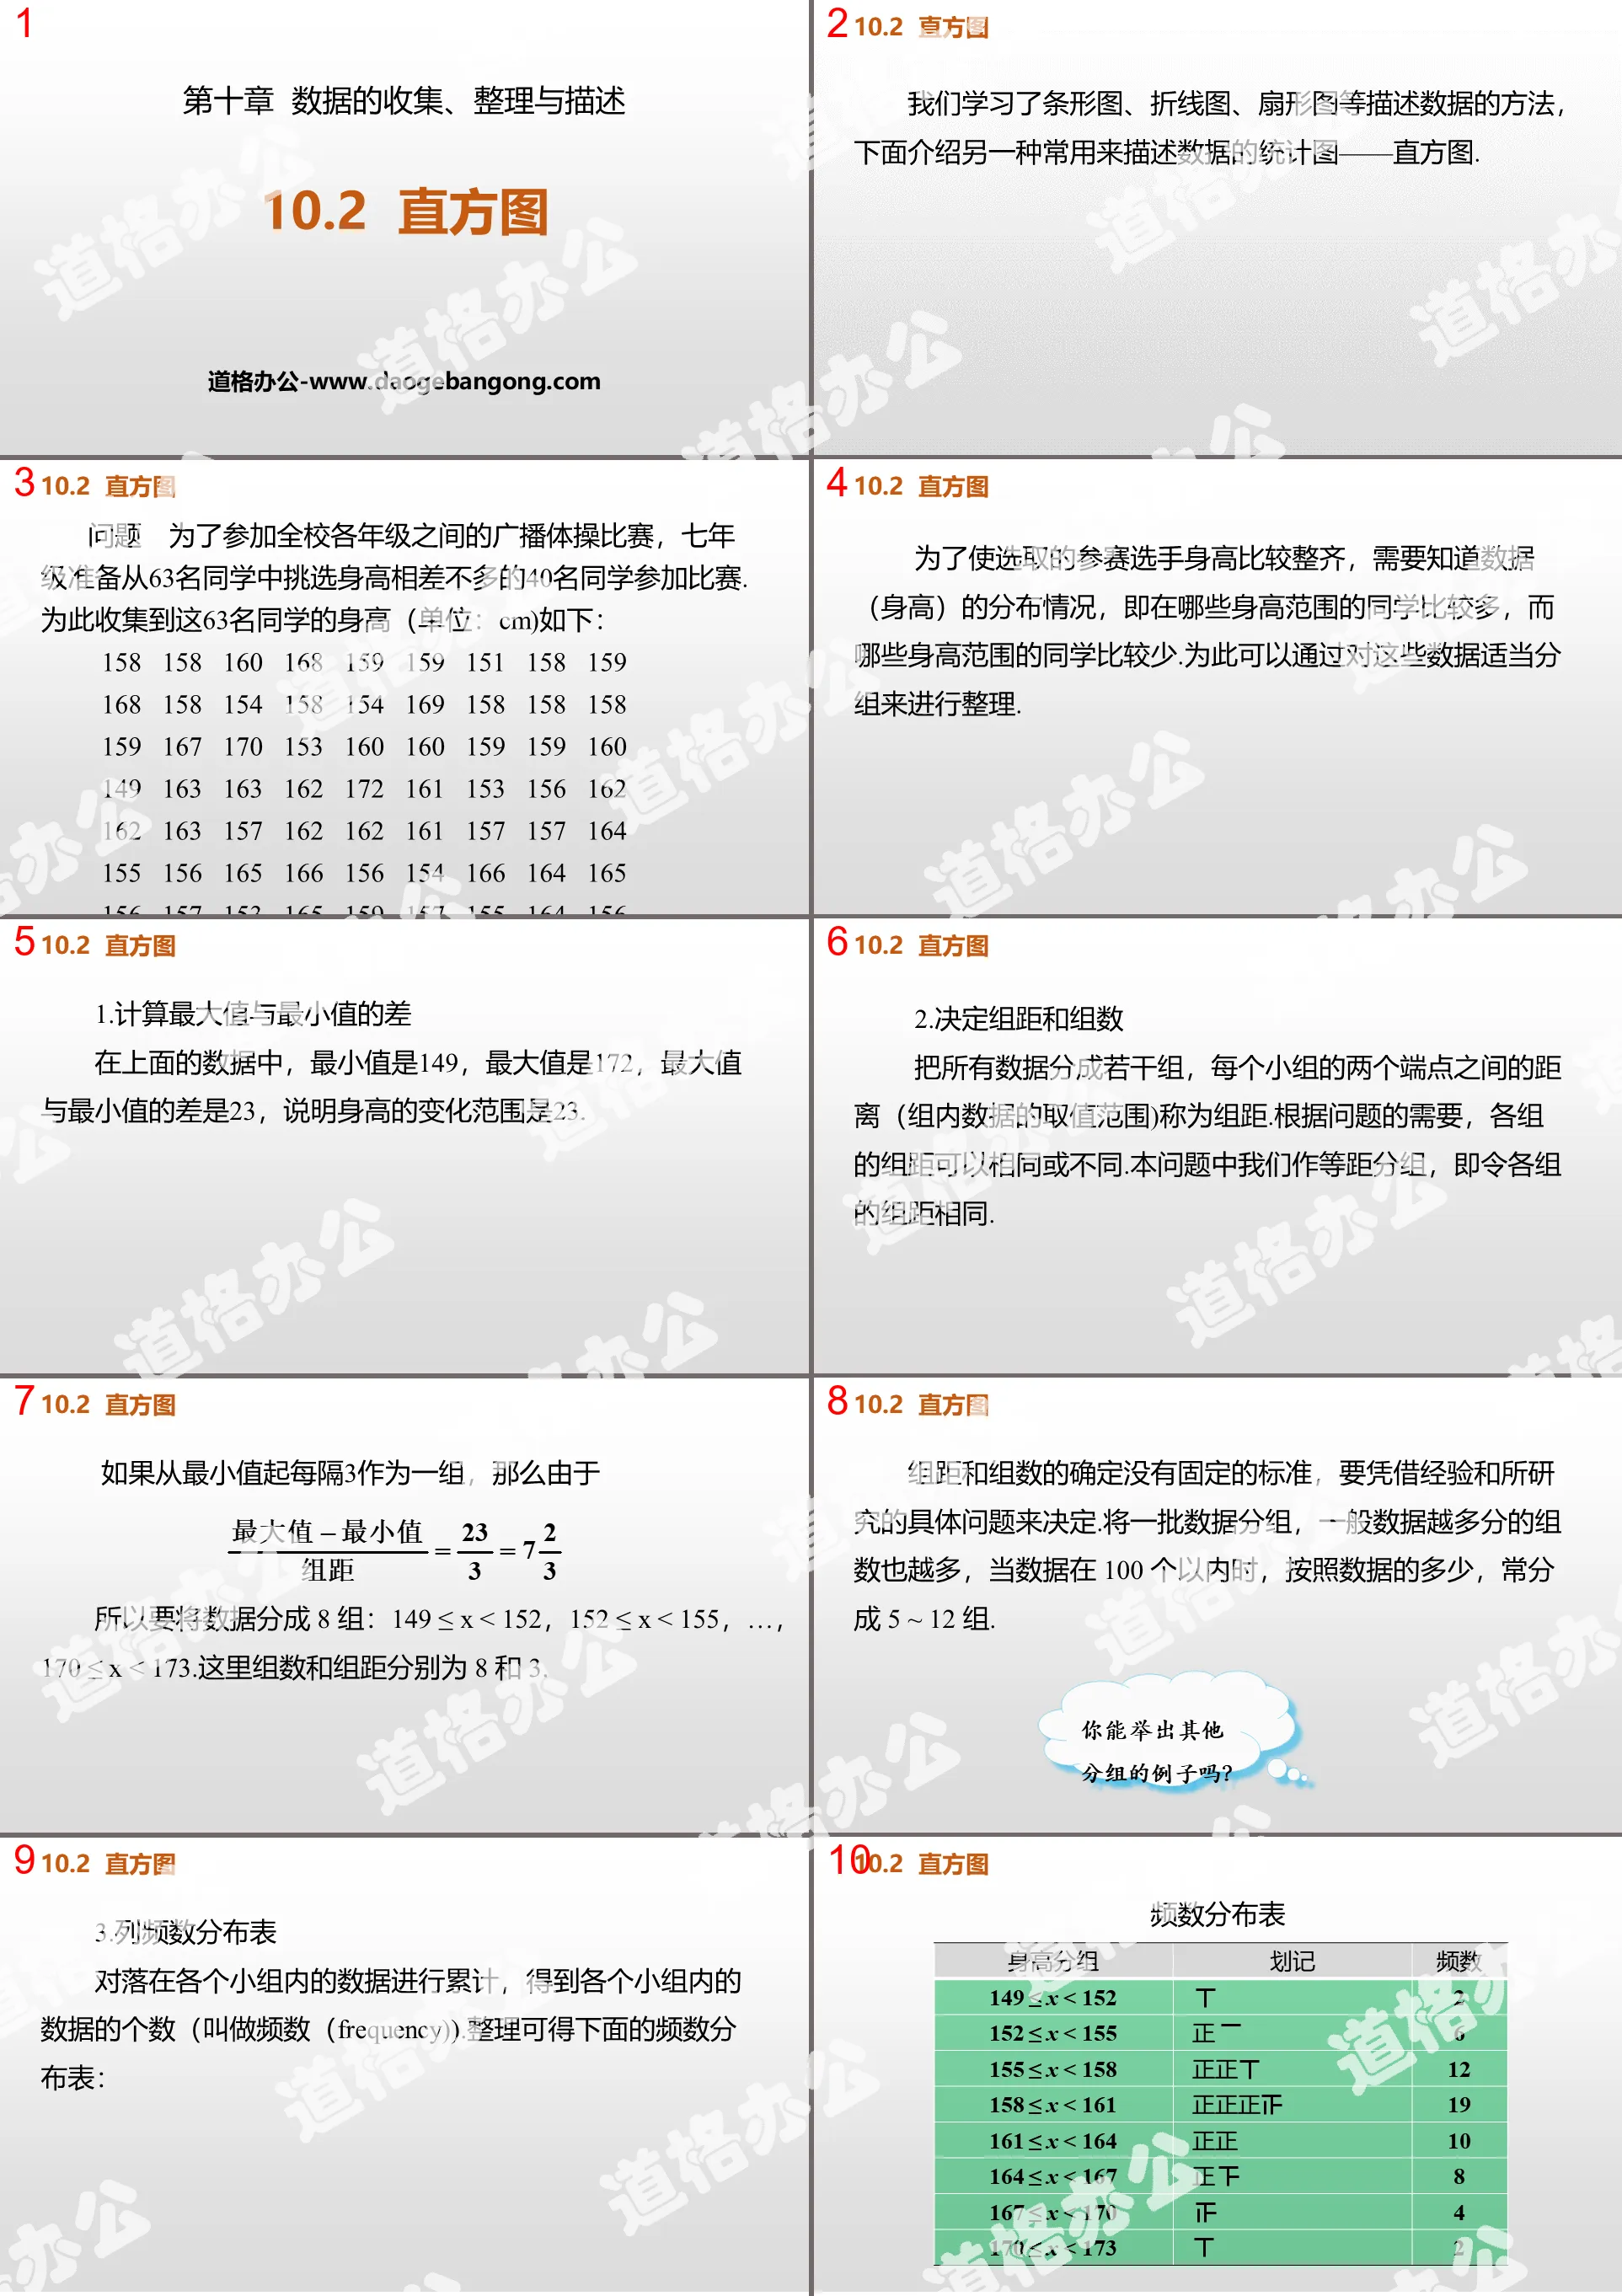
1. Calculate the difference between the maximum value and the minimum value:
The maximum value is 169 and the minimum value is 146
Their difference is: 169-146=23 (cm)
2. Determine the group distance and number of groups:
Group this set of data and determine the distance between the two endpoints of each group.
Number of groups = maximum value - minimum value / group distance = 23/3
Number of groups: The number of groups divided into is called the number of groups.
Group distance: The difference between the two endpoints of each group is called the group distance.
General methods for determining the number of groups and group spacing:
The more data you have, the more groups you get.
If the total number of data is n,
When n≤50, it is divided into 5 ~ 8 groups;
When 50≤n≤100, it is divided into 8 ~ 12 groups;
The key to a column frequency distribution table is grouping. Divide the data to be counted into several groups. There are no strict standards for grouping. It often needs to be decided based on the significance of the actual problem and experience.
For example, when analyzing students' scores, they are often divided into groups by 10; when analyzing the distribution of student heights, they are often grouped into groups by 5cm. The number of groups should be appropriate, not too many and not too few. 40 to 100 data is often used. It is appropriate to divide them into groups of 7 to 10.
The height of each rectangle represents the frequency of the corresponding group.
Features of histogram:
1: Histogram can display the frequency distribution of each group
2. Easily display the differences in frequencies between groups.
summary:
1. The concept of histogram.
2. Characteristics of histogram.
3. Obtain information from the histogram.
Keywords: data collection, organization and description teaching courseware, histogram teaching courseware, New People's Education Edition seventh grade mathematics volume 2 PPT courseware, seventh grade mathematics slide courseware download, data collection, organization and description PPT courseware download, histogram PPT Courseware download, .ppt format
For more information about the PPT courseware "Collection, Organization and Description of Data Histogram", please click the "Collection, Organization and Description of Data ppt Histogram ppt" tab.
"Frequency Distribution Table and Histogram" PPT download:
"Frequency Distribution Table and Histogram" PPT Download Part One Content: Review Do you still remember the characteristics of each statistical chart: Bar chart can clearly show the specific number of each item. Line chart can clearly reflect changes in things. situation. Sector..
"Frequency Distribution Table and Histogram" PPT courseware:
"Frequency Distribution Table and Histogram" PPT courseware Part One: Preparation before class Questionnaire: Books are the ladder of human progress. What kind of books do students like to read most after class? A. Literature ( ) B. Comics ( ) C. Popular science ( ) D. History ( ..
"Frequency Distribution Table and Histogram" PPT:
"Frequency Distribution Table and Histogram" PPT Part One Content: New Lesson Exploration In order to understand the market share of different brands of beverages, Xiaoliang and Xiaoming chose a supermarket to conduct a survey and recorded the brands of beverages purchased by 50 customers that day. Use the letters K,B,L,C...