Western Normal University Edition First Grade Mathematics Volume 1
Beijing Normal University Edition Seventh Grade Mathematics Volume 1
People's Education Press First Grade Mathematics Volume 1
People's Education Press Second Grade Mathematics Volume 1
Beijing Normal University Edition Seventh Grade Mathematics Volume 2
People's Education Press Third Grade Mathematics Volume 1
Beijing Normal University Edition Eighth Grade Mathematics Volume 1
Qingdao Edition Seventh Grade Mathematics Volume 1
Beijing Normal University Edition Fifth Grade Mathematics Volume 1
Hebei Education Edition Third Grade Mathematics Volume 1
Hebei Education Edition Seventh Grade Mathematics Volume 2
People's Education Press First Grade Mathematics Volume 2
People's Education High School Mathematics Edition B Compulsory Course 2
Qingdao Edition Seventh Grade Mathematics Volume 2
Beijing Normal University Edition Fifth Grade Mathematics Volume 2
Hebei Education Edition Fourth Grade Mathematics Volume 2

| Category | Format | Size |
|---|---|---|
| Beijing Normal University eighth grade mathematics volume 2 | pptx | 6 MB |

"Frequency and Frequency" Data Collection and Processing PPT Courseware 4
2024-11-22
Copyright statement: This material is compiled and released by the user of Daoge Resources. The copyright belongs to the author. For commercial use, please contact the copyright owner. If there is any infringement, please contact the webmaster to remove the resource.
Download Points: 0.00
Free Download
Upgrade VIP
Favorite
Views: 4421 / Downloads: 410
Description
"Frequency and Frequency" Data Collection and Processing PPT Courseware 4
Reflection
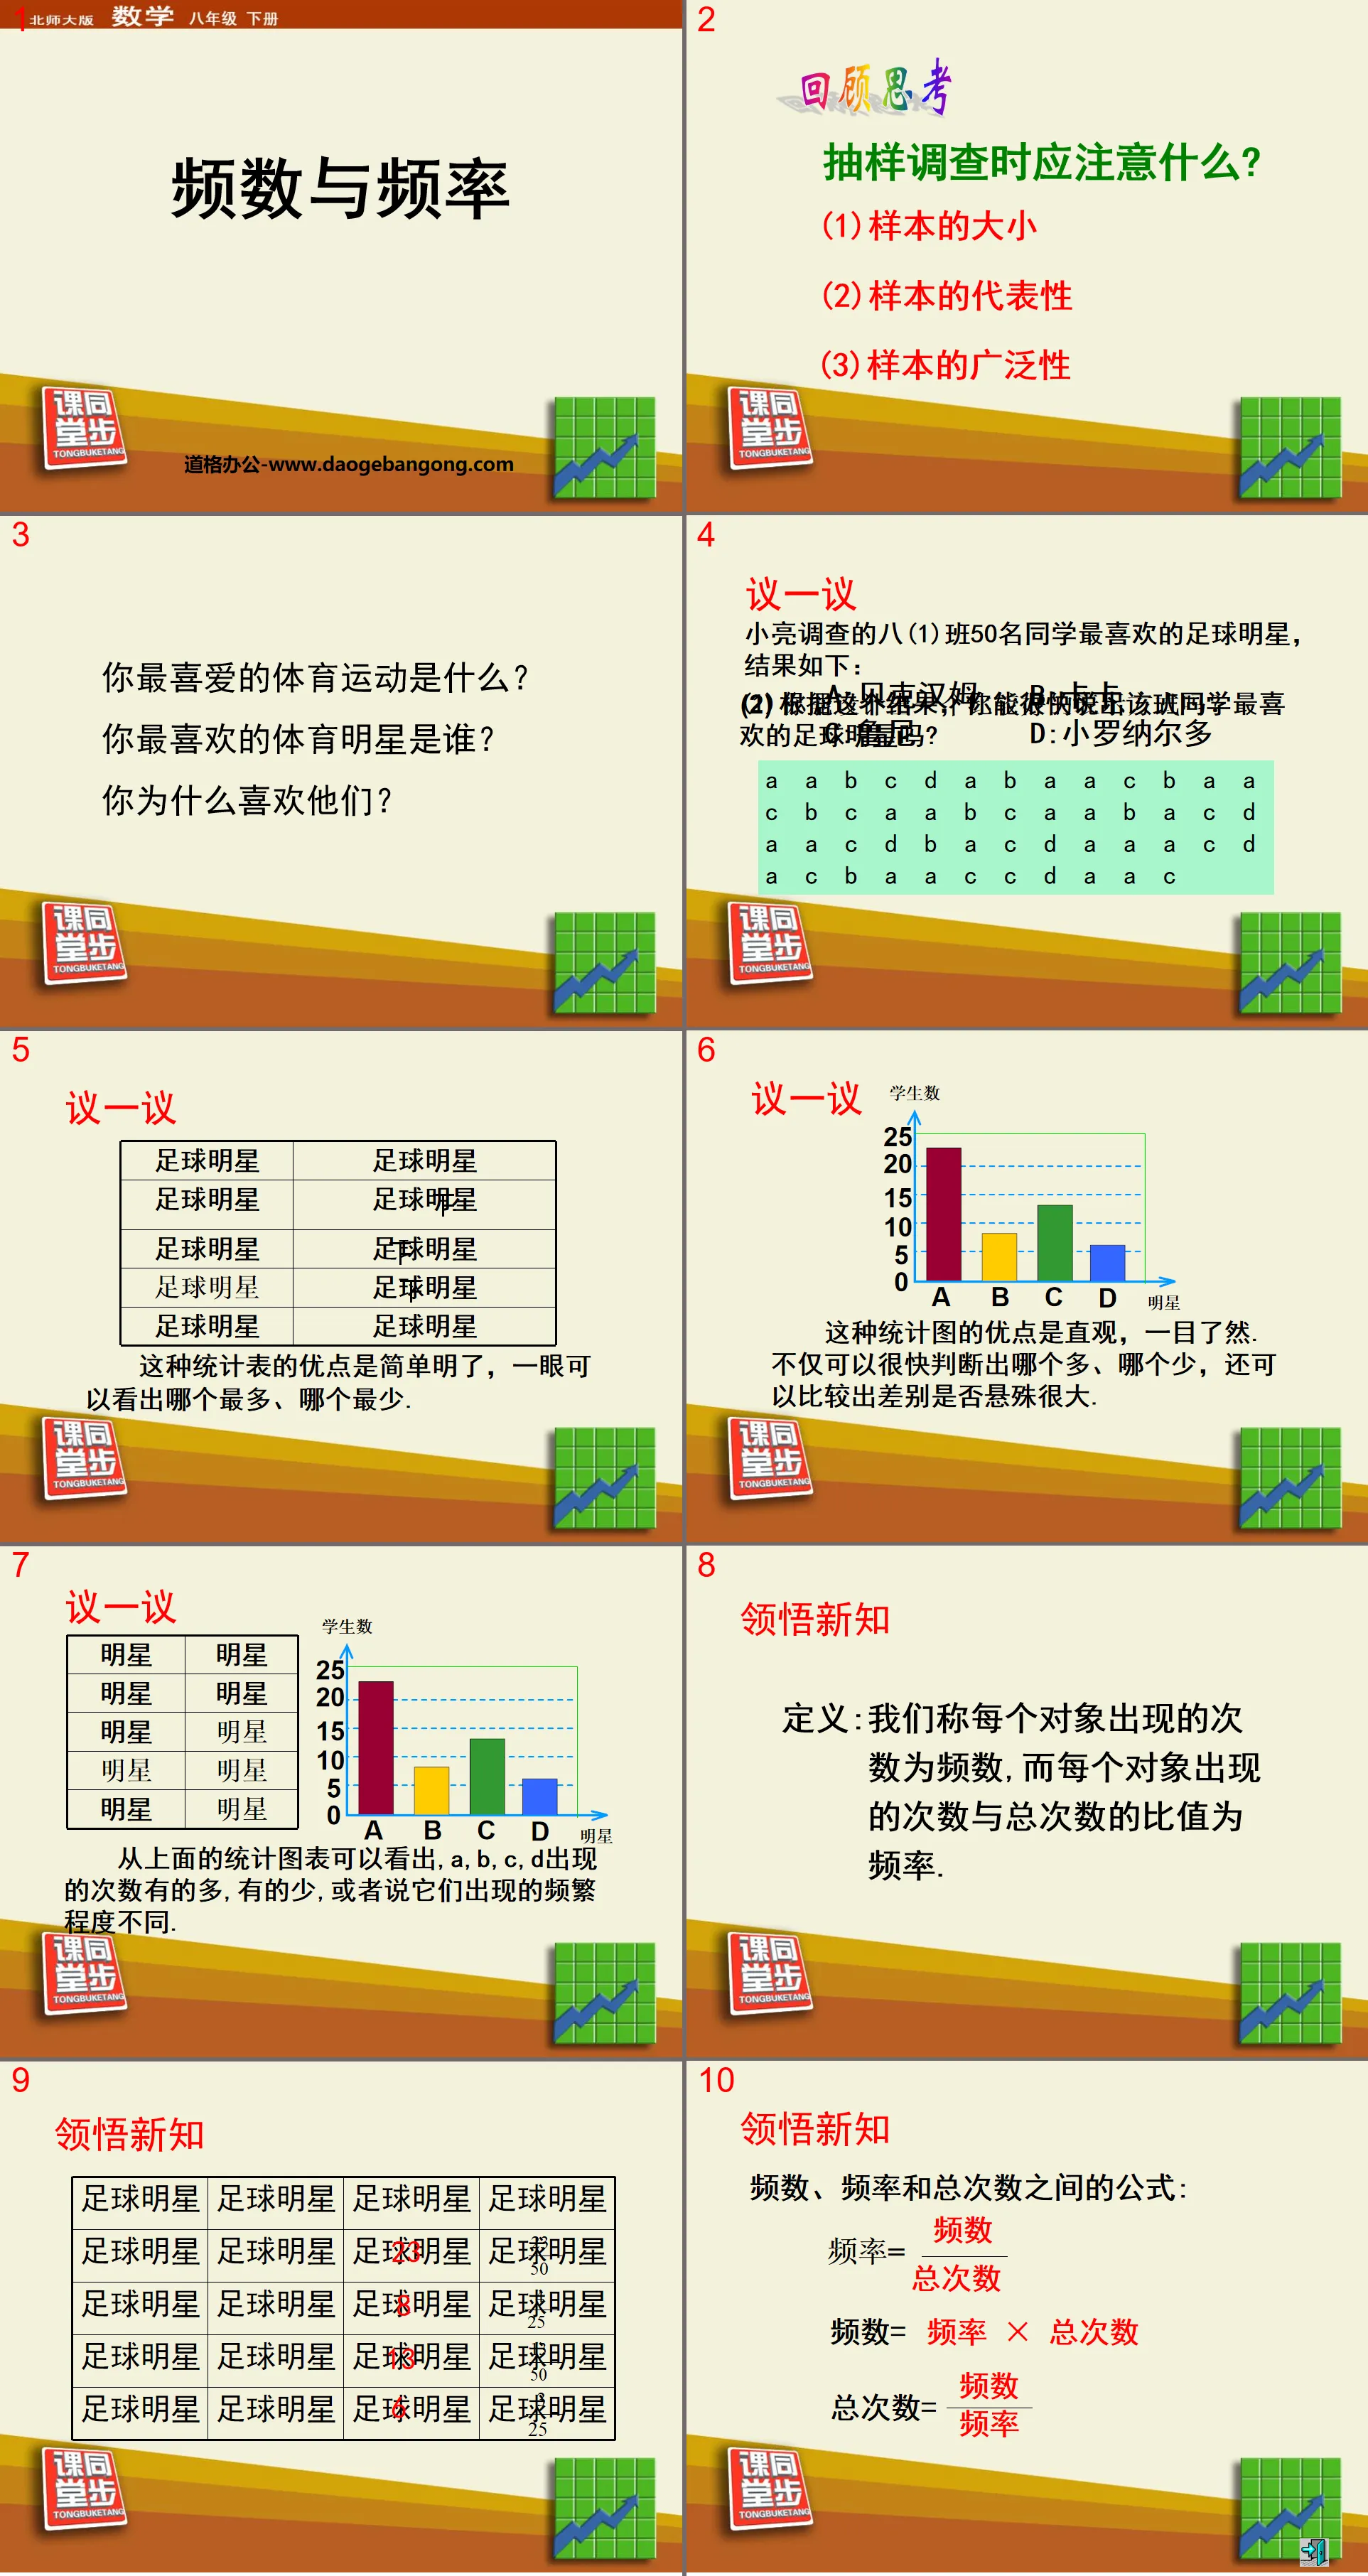
What should you pay attention to when conducting a sample survey?
(1)Sample size
(2) Representativeness of sample
(3) Extensiveness of the sample
What is your favorite sport?
Who is your favorite sports star?
Why do you like them?
Discuss
Xiaoliang surveyed 50 students in Class 8(1) about their favorite football stars. The results are as follows:
(1) Based on this result, can you quickly name the favorite football star of the class?
(2) Can you design a better representation?
Gain new knowledge
Definition: We call the number of times each object appears as frequency, and the ratio of the number of times each object appears to the total number of times is frequency.
Do it (P186)
(1) Which Chinese character do you think is used most frequently?
(2) Students with the same views form a group, design a simple survey plan, roughly estimate its frequency of use, and share the survey results with the whole class.
Summary
How do we collect and process data?
(1) Determine the investigation object by determining the purpose of the investigation;
(2) Collect relevant data;
(3) Choose a reasonable data presentation method to collect statistical data;
(4) Calculate based on the collected data and estimate the overall situation based on the characteristic numbers.
Discuss
This kind of statistical table is unorganized data, there is a lot of data, and the quantitative representation is not simple and intuitive. The number of people accounted for by each data is not directly given, and it still needs to be calculated.
Advantages: The quantitative representation is accurate, that is, it can accurately represent the number of people occupied by each data.
Disadvantages: It cannot intuitively reflect the overall pattern of data. There is also a lot of data.
Do it
Example: A sample is known to be: 61 79 63 57 81
55 54 66 59 80 56 83 70 80
60 54 76 69 64 67 58 72 75
85 79 61 58 58 68 81
Make a frequency distribution table and draw a frequency distribution histogram;
(1) The maximum value is 85, the minimum value is 54, and the difference is 31;
(2) Determine the group distance, and the group distance is 4;
(3) Determine the points;
(4) Column frequency distribution table;
(5) Draw a frequency distribution histogram.
summary
What are frequency and frequency? How to calculate frequency?
How is data collected?
How to draw frequency distribution histogram and frequency distribution line chart?
Frequency, frequency, frequency distribution table, frequency distribution histogram and frequency distribution line chart all reflect the distribution of a set of data.
Keywords: data collection and processing teaching courseware, frequency and frequency teaching courseware, Beijing Normal University edition eighth grade mathematics second volume PPT courseware, eighth grade mathematics slide courseware download, data collection and processing PPT courseware download, frequency and frequency PPT Courseware download, .ppt format
For more information about the "Collection and Processing of Frequency and Frequency Data" PPT courseware, please click the "Collection and Processing of Frequency and Frequency ppt Data" ppt tab.
"Frequency and Frequency" PPT courseware:
"Frequency and Frequency" PPT courseware Learning objectives (1) Be able to find the frequency and frequency of an event (2) Be able to list frequency and frequency distribution tables. Problem situation Do you like watching basketball games? Who is your favorite basketball star? (A represents Yao Ming, B represents Yi Jian...
"Frequency and Frequency" Data Collection and Processing PPT Courseware 3:
"Frequency and Frequency" Data Collection and Processing PPT Courseware 3 Let's talk about it. First answer the following questions, and then fill in the table below: (1) In these 10 trials, what is the frequency of tails? What is the relationship between the frequency of heads and the frequency of tails? ..
"Frequency and Frequency" Data Collection and Processing PPT Courseware 2:
"Frequency and Frequency" Data Collection and Processing PPT Courseware 2 The problem of two melon farmers, Lao Zhang and Lao Wang, planted watermelons on an acre of land. In order to compete with melon planting technology: Lao Zhang randomly weighed the weight of 10 watermelons (kg ) are: 2 8 10 4 6 6 4 2 8 10 old..
File Info
Update Time: 2024-11-22
This template belongs to Mathematics courseware Beijing Normal University eighth grade mathematics volume 2 industry PPT template
"Frequency and Frequency" Data Collection and Processing PPT Courseware 4 Simple campus recruitment activity planning plan summary enterprise and institution recruitment publicity lecture PPT template is a general PPT template for business post competition provided by the manuscript PPT, simple campus recruitment activity planning plan summary enterprise and institution recruitment promotion Lecture PPT template, you can edit and modify the text and pictures in the source file by downloading the source file. If you want more exquisite business PPT templates, you can come to grid resource. Doug resource PPT, massive PPT template slide material download, we only make high-quality PPT templates!
Tips: If you open the template and feel that it is not suitable for all your needs, you can search for related content "Frequency and Frequency" Data Collection and Processing PPT Courseware 4 is enough.
How to use the Windows system template
Directly decompress the file and use it with office or wps
How to use the Mac system template
Directly decompress the file and use it Office or wps can be used
Related reading
For more detailed PPT-related tutorials and font tutorials, you can view: Click to see
How to create a high-quality technological sense PPT? 4 ways to share the bottom of the box
Notice
Do not download in WeChat, Zhihu, QQ, built-in browsers, please use mobile browsers to download! If you are a mobile phone user, please download it on your computer!
1. The manuscript PPT is only for study and reference, please delete it 24 hours after downloading.
2. If the resource involves your legitimate rights and interests, delete it immediately.
3. Contact information: service@daogebangong.com
"Frequency and Frequency" Data Collection and Processing PPT Courseware 4, due to usage restrictions, it is only for personal study and reference use. For commercial use, please go to the relevant official website for authorization.
(Personal non-commercial use refers to the use of this font to complete the display of personal works, including but not limited to the design of personal papers, resumes, etc.)
Preview
Related Search:
"Frequency and Frequency" Data Collection and Processing PPT Courseware 4
2024-11-22
Copyright statement: This material is compiled and released by the user of Daoge Resources. The copyright belongs to the author. For commercial use, please contact the copyright owner. If there is any infringement, please contact the webmaster to remove the resource.
Download Points: 0.00
Free Download
Upgrade VIP
Favorite
Views: 4421 / Downloads: 410


