Western Normal University Edition First Grade Mathematics Volume 1
Beijing Normal University Edition Seventh Grade Mathematics Volume 1
People's Education Press First Grade Mathematics Volume 1
People's Education Press Second Grade Mathematics Volume 1
Beijing Normal University Edition Seventh Grade Mathematics Volume 2
People's Education Press Third Grade Mathematics Volume 1
Beijing Normal University Edition Eighth Grade Mathematics Volume 1
Qingdao Edition Seventh Grade Mathematics Volume 1
Beijing Normal University Edition Fifth Grade Mathematics Volume 1
Hebei Education Edition Third Grade Mathematics Volume 1
Hebei Education Edition Seventh Grade Mathematics Volume 2
People's Education Press First Grade Mathematics Volume 2
People's Education High School Mathematics Edition B Compulsory Course 2
Qingdao Edition Seventh Grade Mathematics Volume 2
Beijing Normal University Edition Fifth Grade Mathematics Volume 2
Hebei Education Edition Fourth Grade Mathematics Volume 2

| Category | Format | Size |
|---|---|---|
| Hebei Education Edition Sixth Grade Mathematics Volume 2 | pptx | 6 MB |
Description
"Experiencing the Misleading Data" PPT
Part One: Teaching Objectives
1. Combined with specific examples, experience the process of data analysis and problem discussion to understand the process of misleading data.
2. Be able to use statistics to analyze problems, initially understand that data may be misleading, and be able to choose appropriate statistics to represent the characteristics of data.
3. Experience the scientific nature of using data to explain problems, and realize that many practical problems can be solved with the help of mathematical ideas and methods.
Understanding the misleading caused by data PPT, part 2: analysis of example questions
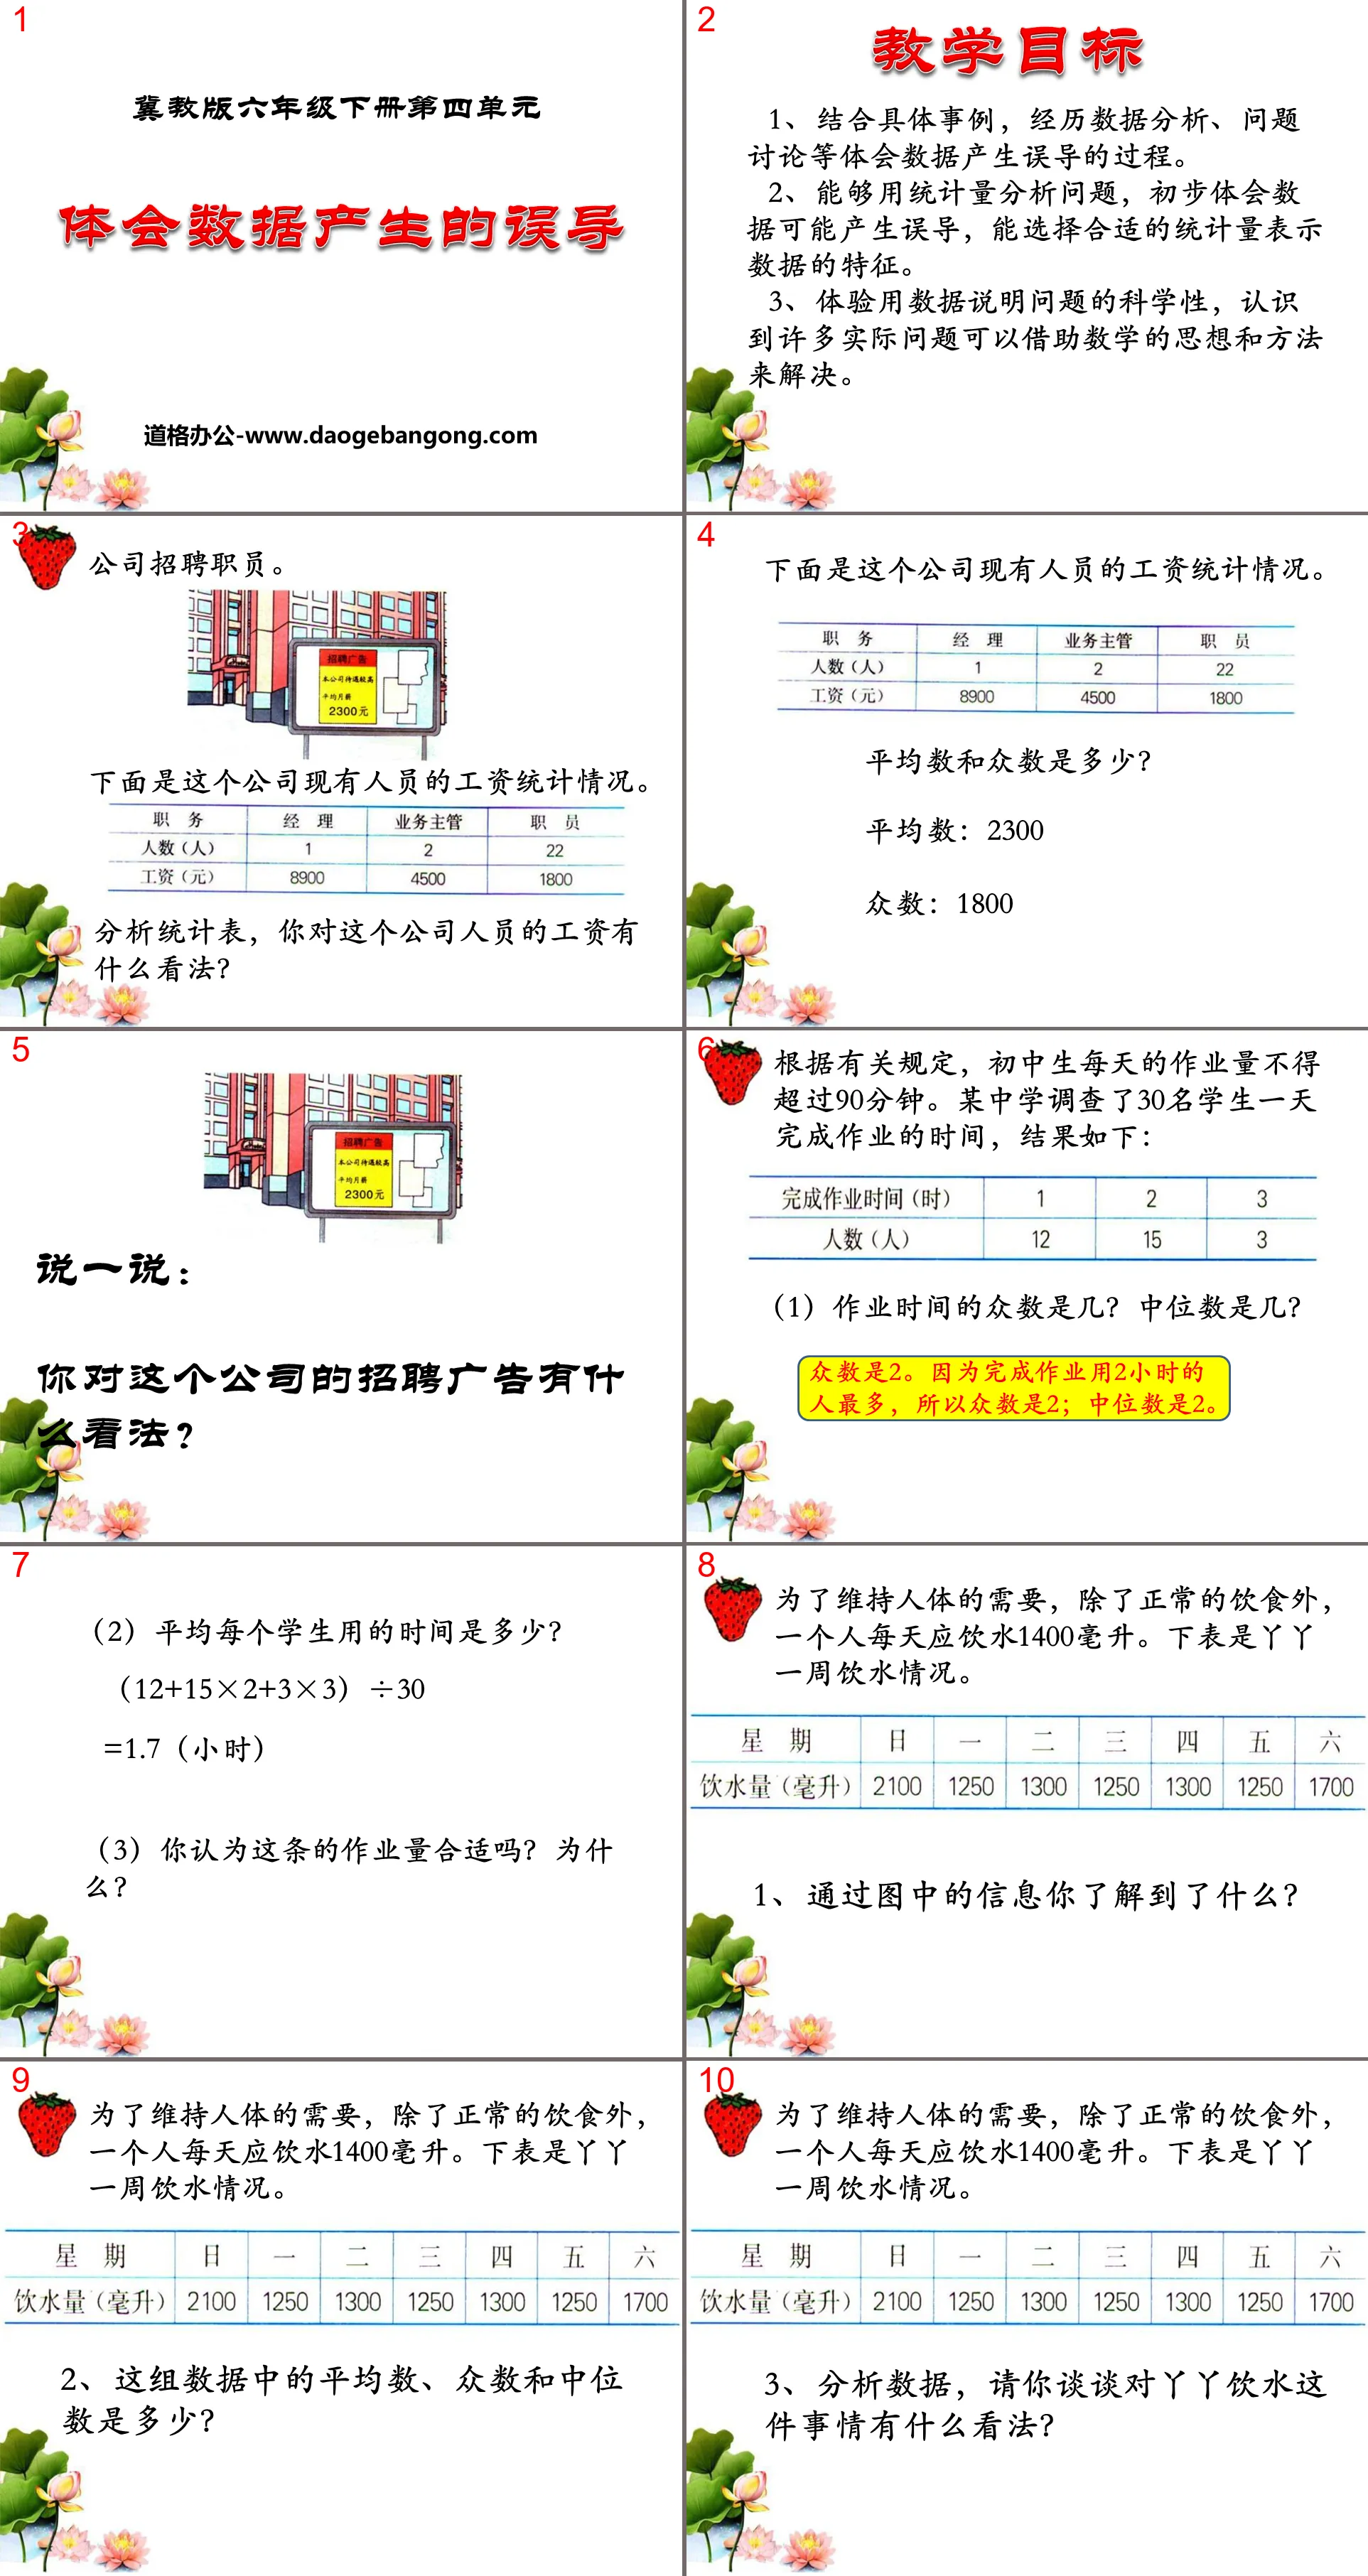
The company is recruiting staff.
The following is the salary statistics of the current personnel of this company.
Analyzing the statistical table, what do you think of the salaries of employees in this company?
What are the mean and mode?
Average: 2300
Mode: 1800
Let’s talk about it:
What do you think of this company's job advertisement?
According to relevant regulations, junior high school students should not have more than 90 minutes of homework per day. A middle school investigated the time it took 30 students to complete homework a day. The results are as follows:
(1) What is the mode of homework time? What is the median?
The mode is 2. Because the most people take 2 hours to complete the homework, the mode is 2; the median is 2.
(2) How much time does each student spend on average?
(12+15×2+3×3)÷30
=1.7(hour)
(3) Do you think the amount of homework in this article is appropriate? Why?
Understanding the misleading caused by data PPT, part three: discussion
Discuss: Little Naughty reports results
In a certain math test, the little naughty boy got 78 points. There were 30 people in the class. The scores of other students were 1 100 points, 4 90 points, 22 80 points, one 2 points and one 10 points. The average score of the whole class was 77, so he told his mother that his score was "above average." Did the little naughty kid cheat on his mother?
Experience the misleading caused by data PPT, Part 4: Practice questions
1. What numbers are generally used in the following situations?
(1). To indicate the students’ favorite cartoon, you should select ( )
A mean B median C mode
(2). There are 50 students in Class 5 (1) and 45 students in Class 5 (2). To compare the average scores of the two classes, ( ) should be selected.
A mean B median C mode
(3). In the speech contest, if a contestant wants to know what level he is at, he should choose ().
A mean B median C mode
Class summary
Talk about what you gained from this class?
Keywords: Free download of Hebei Education Edition mathematics PPT courseware for the second volume of sixth grade, experience the misleading caused by data PPT download, .PPT format;
For more information about the PPT courseware "Experiencing the Misleading Data," please click the "Experiencing the Misleading Data" ppt tag.
File Info
Update Time: 2024-11-22
This template belongs to Mathematics courseware Hebei Education Edition Sixth Grade Mathematics Volume 2 industry PPT template
"Experiencing the Misleading Data" PPT Simple campus recruitment activity planning plan summary enterprise and institution recruitment publicity lecture PPT template is a general PPT template for business post competition provided by the manuscript PPT, simple campus recruitment activity planning plan summary enterprise and institution recruitment promotion Lecture PPT template, you can edit and modify the text and pictures in the source file by downloading the source file. If you want more exquisite business PPT templates, you can come to grid resource. Doug resource PPT, massive PPT template slide material download, we only make high-quality PPT templates!
Tips: If you open the template and feel that it is not suitable for all your needs, you can search for related content "Experiencing the Misleading Data" PPT is enough.
How to use the Windows system template
Directly decompress the file and use it with office or wps
How to use the Mac system template
Directly decompress the file and use it Office or wps can be used
Related reading
For more detailed PPT-related tutorials and font tutorials, you can view: Click to see
How to create a high-quality technological sense PPT? 4 ways to share the bottom of the box
Notice
Do not download in WeChat, Zhihu, QQ, built-in browsers, please use mobile browsers to download! If you are a mobile phone user, please download it on your computer!
1. The manuscript PPT is only for study and reference, please delete it 24 hours after downloading.
2. If the resource involves your legitimate rights and interests, delete it immediately.
3. Contact information: service@daogebangong.com
"Experiencing the Misleading Data" PPT, due to usage restrictions, it is only for personal study and reference use. For commercial use, please go to the relevant official website for authorization.
(Personal non-commercial use refers to the use of this font to complete the display of personal works, including but not limited to the design of personal papers, resumes, etc.)
Preview


