Beijing Normal University Edition Seventh Grade Mathematics Volume 1
Western Normal University Edition First Grade Mathematics Volume 1
People's Education Press First Grade Mathematics Volume 1
People's Education Press Second Grade Mathematics Volume 1
Beijing Normal University Edition Seventh Grade Mathematics Volume 2
People's Education Press Third Grade Mathematics Volume 1
Beijing Normal University Edition Eighth Grade Mathematics Volume 1
Qingdao Edition Seventh Grade Mathematics Volume 1
Beijing Normal University Edition Fifth Grade Mathematics Volume 1
Hebei Education Edition Third Grade Mathematics Volume 1
Hebei Education Edition Seventh Grade Mathematics Volume 2
People's Education Press First Grade Mathematics Volume 2
Qingdao Edition Seventh Grade Mathematics Volume 2
People's Education High School Mathematics Edition B Compulsory Course 2
Beijing Normal University Edition Fifth Grade Mathematics Volume 2
Hebei Education Edition Fourth Grade Mathematics Volume 2

| Category | Format | Size |
|---|---|---|
| People's Education Press Ninth Grade Mathematics Volume 1 | pptx | 6 MB |

"Estimating Probability Using Frequency" Probability Preliminary PPT
2024-11-21
Copyright statement: This material is compiled and released by the user of Daoge Resources. The copyright belongs to the author. For commercial use, please contact the copyright owner. If there is any infringement, please contact the webmaster to remove the resource.
Download Points: 0.00
Free Download
Upgrade VIP
Favorite
Views: 3895 / Downloads: 488
Description
"Estimating Probability Using Frequency" Probability Preliminary PPT
The first part: the famous teacher’s eye-catching
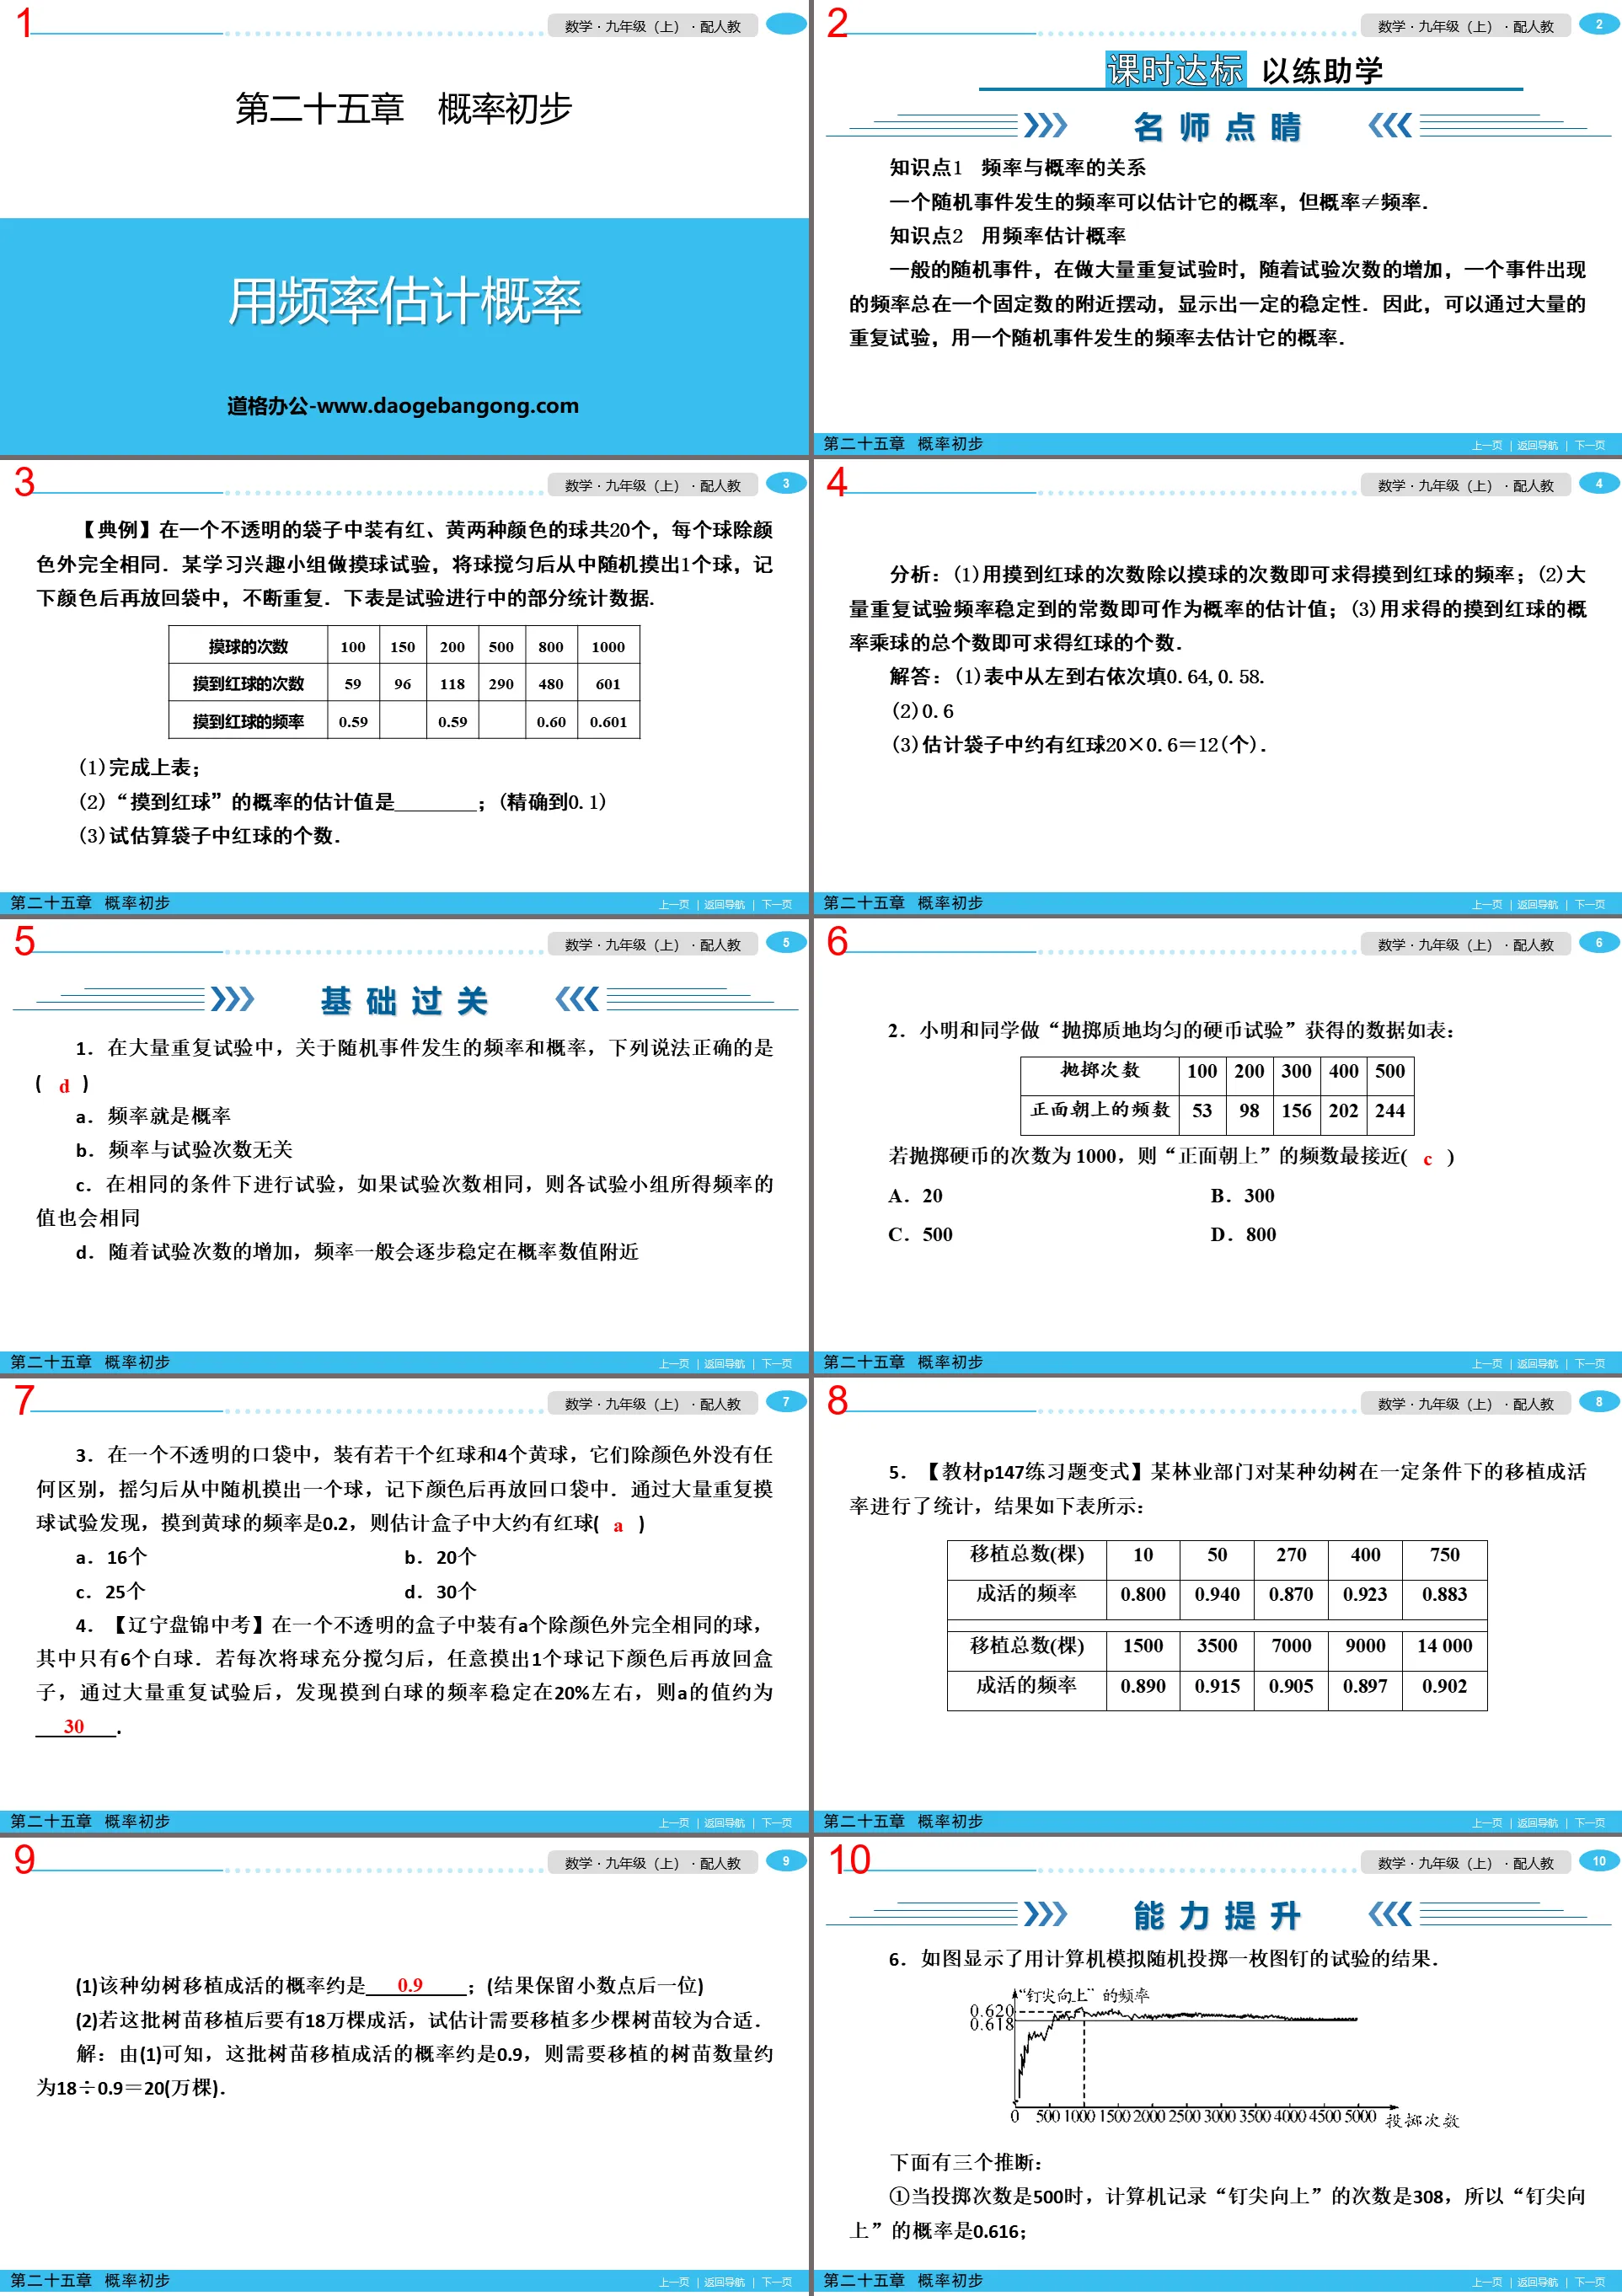
Knowledge point 1: The relationship between frequency and probability
The frequency of a random event can be used to estimate its probability, but probability ≠ frequency.
Knowledge point 2: Use frequency to estimate probability
For general random events, when doing a large number of repeated tests, as the number of tests increases, the frequency of an event always swings around a fixed number, showing a certain degree of stability. Therefore, the frequency of a random event can be used to estimate its probability through a large number of repeated experiments.
[Typical example] There are 20 balls in two colors, red and yellow, in an opaque bag. Each ball is exactly the same except for its color. A certain learning interest group did a ball touch test. After mixing the balls, they randomly picked out a ball. After writing down the color, they put it back into the bag and repeated it. The following table is some statistical data during the experiment
(1) Complete the above table;
(2) The estimated value of the probability of "touching the red ball" is ________; (accurate to 0.1)
(3) Try to estimate the number of red balls in the bag.
Analysis: (1) Divide the number of times the red ball is touched by the number of times the ball is touched to obtain the frequency of touching the red ball; (2) The constant that the frequency of a large number of repeated tests stabilizes can be used as an estimate of the probability; (3) ) The number of red balls can be obtained by multiplying the obtained probability of touching the red ball by the total number of balls.
Answer: (1) Fill in the table from left to right with 0.64 and 0.58.
(2)0.6
(3) It is estimated that there are about 20×0.6=12 red balls in the bag.
Use frequency to estimate probability PPT, part 2: basic pass
1. In a large number of repeated experiments, regarding the frequency and probability of random events, which of the following statements is correct ()
A. Frequency is probability
B. Frequency has nothing to do with the number of trials
C. Tests are conducted under the same conditions. If the number of tests is the same, the frequency values obtained by each test group will also be the same.
D. As the number of trials increases, the frequency will generally gradually stabilize near the probability value.
2. The data obtained by Xiao Ming and his classmates from the "Tossing a Coin with a Uniform Texture Test" is as follows:
Number of throws 100 200 300 400 500
Frequency of heads up 53 98 156 202 244
If the number of coin tosses is 1000, then the frequency of "heads" is closest to ()
A. 20 b. 300
C. 500 D. 800
3. In an opaque bag, there are several red balls and 4 yellow balls. They have no difference except their color. After shaking, randomly take out a ball from it, write down the color and put it back into the bag. Through a large number of repeated ball touching experiments, it is found that the frequency of touching yellow balls is 0.2, then it is estimated that there are approximately red balls in the box ()
A. 16 B. 20
C. 25 D. 30 pieces
4. [Liaoning Panjin High School Entrance Examination] An opaque box contains a ball that is identical except for color. There are only 6 white balls in it. If each time the balls are thoroughly mixed, a ball is picked out at random and the color is recorded before being put back into the box. After a large number of repeated tests, it is found that the frequency of touching white balls is stable at about 20%, then the value of a is about _ _______.
Using frequency to estimate probability PPT, part three: ability improvement
6. The figure shows the results of a computer simulation of randomly throwing a thumbtack.
There are three inferences below:
① When the number of throws is 500, the number of times the computer records "nail tip up" is 308, so the probability of "nail tip up" is 0.616;
② As the number of tests increases, the frequency of "nail tip upward" always swings around 0.618, showing a certain stability. It can be estimated that the probability of "nail tip upward" is 0.618;
③If the computer is used to simulate this test again, then when the number of throws is 1000, the frequency of "nail tip upward" must be 0.620.
The reasonable one is ()
A. ① B. ②
C. ①② D. ①③
Using frequency to estimate probability PPT, part 4: thinking training
10. The quality inspection results of a certain batch of table tennis balls are as follows:
Number of table tennis balls drawn n 200 500 1000 1500 2000
Frequency of excellent products m 188 471 946 1426 1898
Excellent product frequency m/n 0.940 0.942 0.946 0.951 0.949
(1) What is the estimated probability of this batch of "excellent" table tennis balls? (accurate to 0.01)
(2) Select 5 yellow balls, 13 white balls, and 22 red balls from this batch of table tennis balls. They are all the same except for color, and put them into an opaque bag.
Keywords: Free download of PPT courseware for mathematics in the first volume of the ninth grade of People's Education Edition, PPT download of estimating probability using frequency, preliminary PPT download of probability, .PPT format;
For more information about the "Using Frequency to Estimate Probability Preliminary" PPT courseware, please click the Estimating Probability Using Frequency PPT Probability Preliminary PPT tab.
"Using Frequency to Estimate Probability" PPT teaching courseware for further understanding of probability:
"Using Frequency to Estimate Probability" PPT teaching courseware for further understanding of probability, 13 pages in total. Basics of knowledge points Knowledge point 1 The relationship between frequency and probability 1. Regarding the relationship between frequency and probability, the correct statement below is (B) A. Frequency is equal to probability B. When the number of trials is very...
"Using Frequency to Estimate Probability" PPT download for further understanding of probability:
"Using Frequency to Estimate Probability" PPT download for further understanding of probability, 16 pages in total. Learning objectives 1. Know that through a large number of repeated experiments, frequency can be used to estimate probability; (key point) 2. Understand the feasibility of alternative simulation experiments. ... ... ... Teach a new lesson using frequency..
"Using Frequency to Estimate Probability" PPT for further understanding of probability:
"Using Frequency to Estimate Probability" PPT for further understanding of probability, 24 pages in total. Learning objectives: Use frequency to estimate the probability of equally possible events. Use frequency to estimate the probability of non-equally possible events. ... ... Understand new knowledge. Knowledge points: Use frequency to estimate, etc.
File Info
Update Time: 2024-11-21
This template belongs to Mathematics courseware People's Education Press Ninth Grade Mathematics Volume 1 industry PPT template
"Estimating Probability Using Frequency" Probability Preliminary PPT Simple campus recruitment activity planning plan summary enterprise and institution recruitment publicity lecture PPT template is a general PPT template for business post competition provided by the manuscript PPT, simple campus recruitment activity planning plan summary enterprise and institution recruitment promotion Lecture PPT template, you can edit and modify the text and pictures in the source file by downloading the source file. If you want more exquisite business PPT templates, you can come to grid resource. Doug resource PPT, massive PPT template slide material download, we only make high-quality PPT templates!
Tips: If you open the template and feel that it is not suitable for all your needs, you can search for related content "Estimating Probability Using Frequency" Probability Preliminary PPT is enough.
How to use the Windows system template
Directly decompress the file and use it with office or wps
How to use the Mac system template
Directly decompress the file and use it Office or wps can be used
Related reading
For more detailed PPT-related tutorials and font tutorials, you can view: Click to see
How to create a high-quality technological sense PPT? 4 ways to share the bottom of the box
Notice
Do not download in WeChat, Zhihu, QQ, built-in browsers, please use mobile browsers to download! If you are a mobile phone user, please download it on your computer!
1. The manuscript PPT is only for study and reference, please delete it 24 hours after downloading.
2. If the resource involves your legitimate rights and interests, delete it immediately.
3. Contact information: service@daogebangong.com
"Estimating Probability Using Frequency" Probability Preliminary PPT, due to usage restrictions, it is only for personal study and reference use. For commercial use, please go to the relevant official website for authorization.
(Personal non-commercial use refers to the use of this font to complete the display of personal works, including but not limited to the design of personal papers, resumes, etc.)
Preview
Related Search:
"Estimating Probability Using Frequency" Probability Preliminary PPT
2024-11-21
Copyright statement: This material is compiled and released by the user of Daoge Resources. The copyright belongs to the author. For commercial use, please contact the copyright owner. If there is any infringement, please contact the webmaster to remove the resource.
Download Points: 0.00
Free Download
Upgrade VIP
Favorite
Views: 3895 / Downloads: 488


