Western Normal University Edition First Grade Mathematics Volume 1
Beijing Normal University Edition Seventh Grade Mathematics Volume 1
People's Education Press First Grade Mathematics Volume 1
People's Education Press Second Grade Mathematics Volume 1
People's Education Press Third Grade Mathematics Volume 1
Beijing Normal University Edition Seventh Grade Mathematics Volume 2
Qingdao Edition Seventh Grade Mathematics Volume 1
Hebei Education Edition Third Grade Mathematics Volume 1
Beijing Normal University Edition Fifth Grade Mathematics Volume 1
Beijing Normal University Edition Eighth Grade Mathematics Volume 1
People's Education High School Mathematics Edition B Compulsory Course 2
Hebei Education Edition Seventh Grade Mathematics Volume 2
Hebei Education Edition Fourth Grade Mathematics Volume 2
Beijing Normal University Edition Fifth Grade Mathematics Volume 2
People's Education Press First Grade Mathematics Volume 2
Qingdao Edition Seventh Grade Mathematics Volume 2

| Category | Format | Size |
|---|---|---|
| Hebei Education Edition Ninth Grade Mathematics Volume 2 | pptx | 6 MB |

"Estimating Probability Using Frequency" PPT courseware
2024-10-19
Copyright statement: This material is compiled and released by the user of Daoge Resources. The copyright belongs to the author. For commercial use, please contact the copyright owner. If there is any infringement, please contact the webmaster to remove the resource.
Download Points: 0.00
Free Download
Upgrade VIP
Favorite
Views: 5016 / Downloads: 801
Description
"Estimating Probability Using Frequency" PPT courseware
Part One: Do it
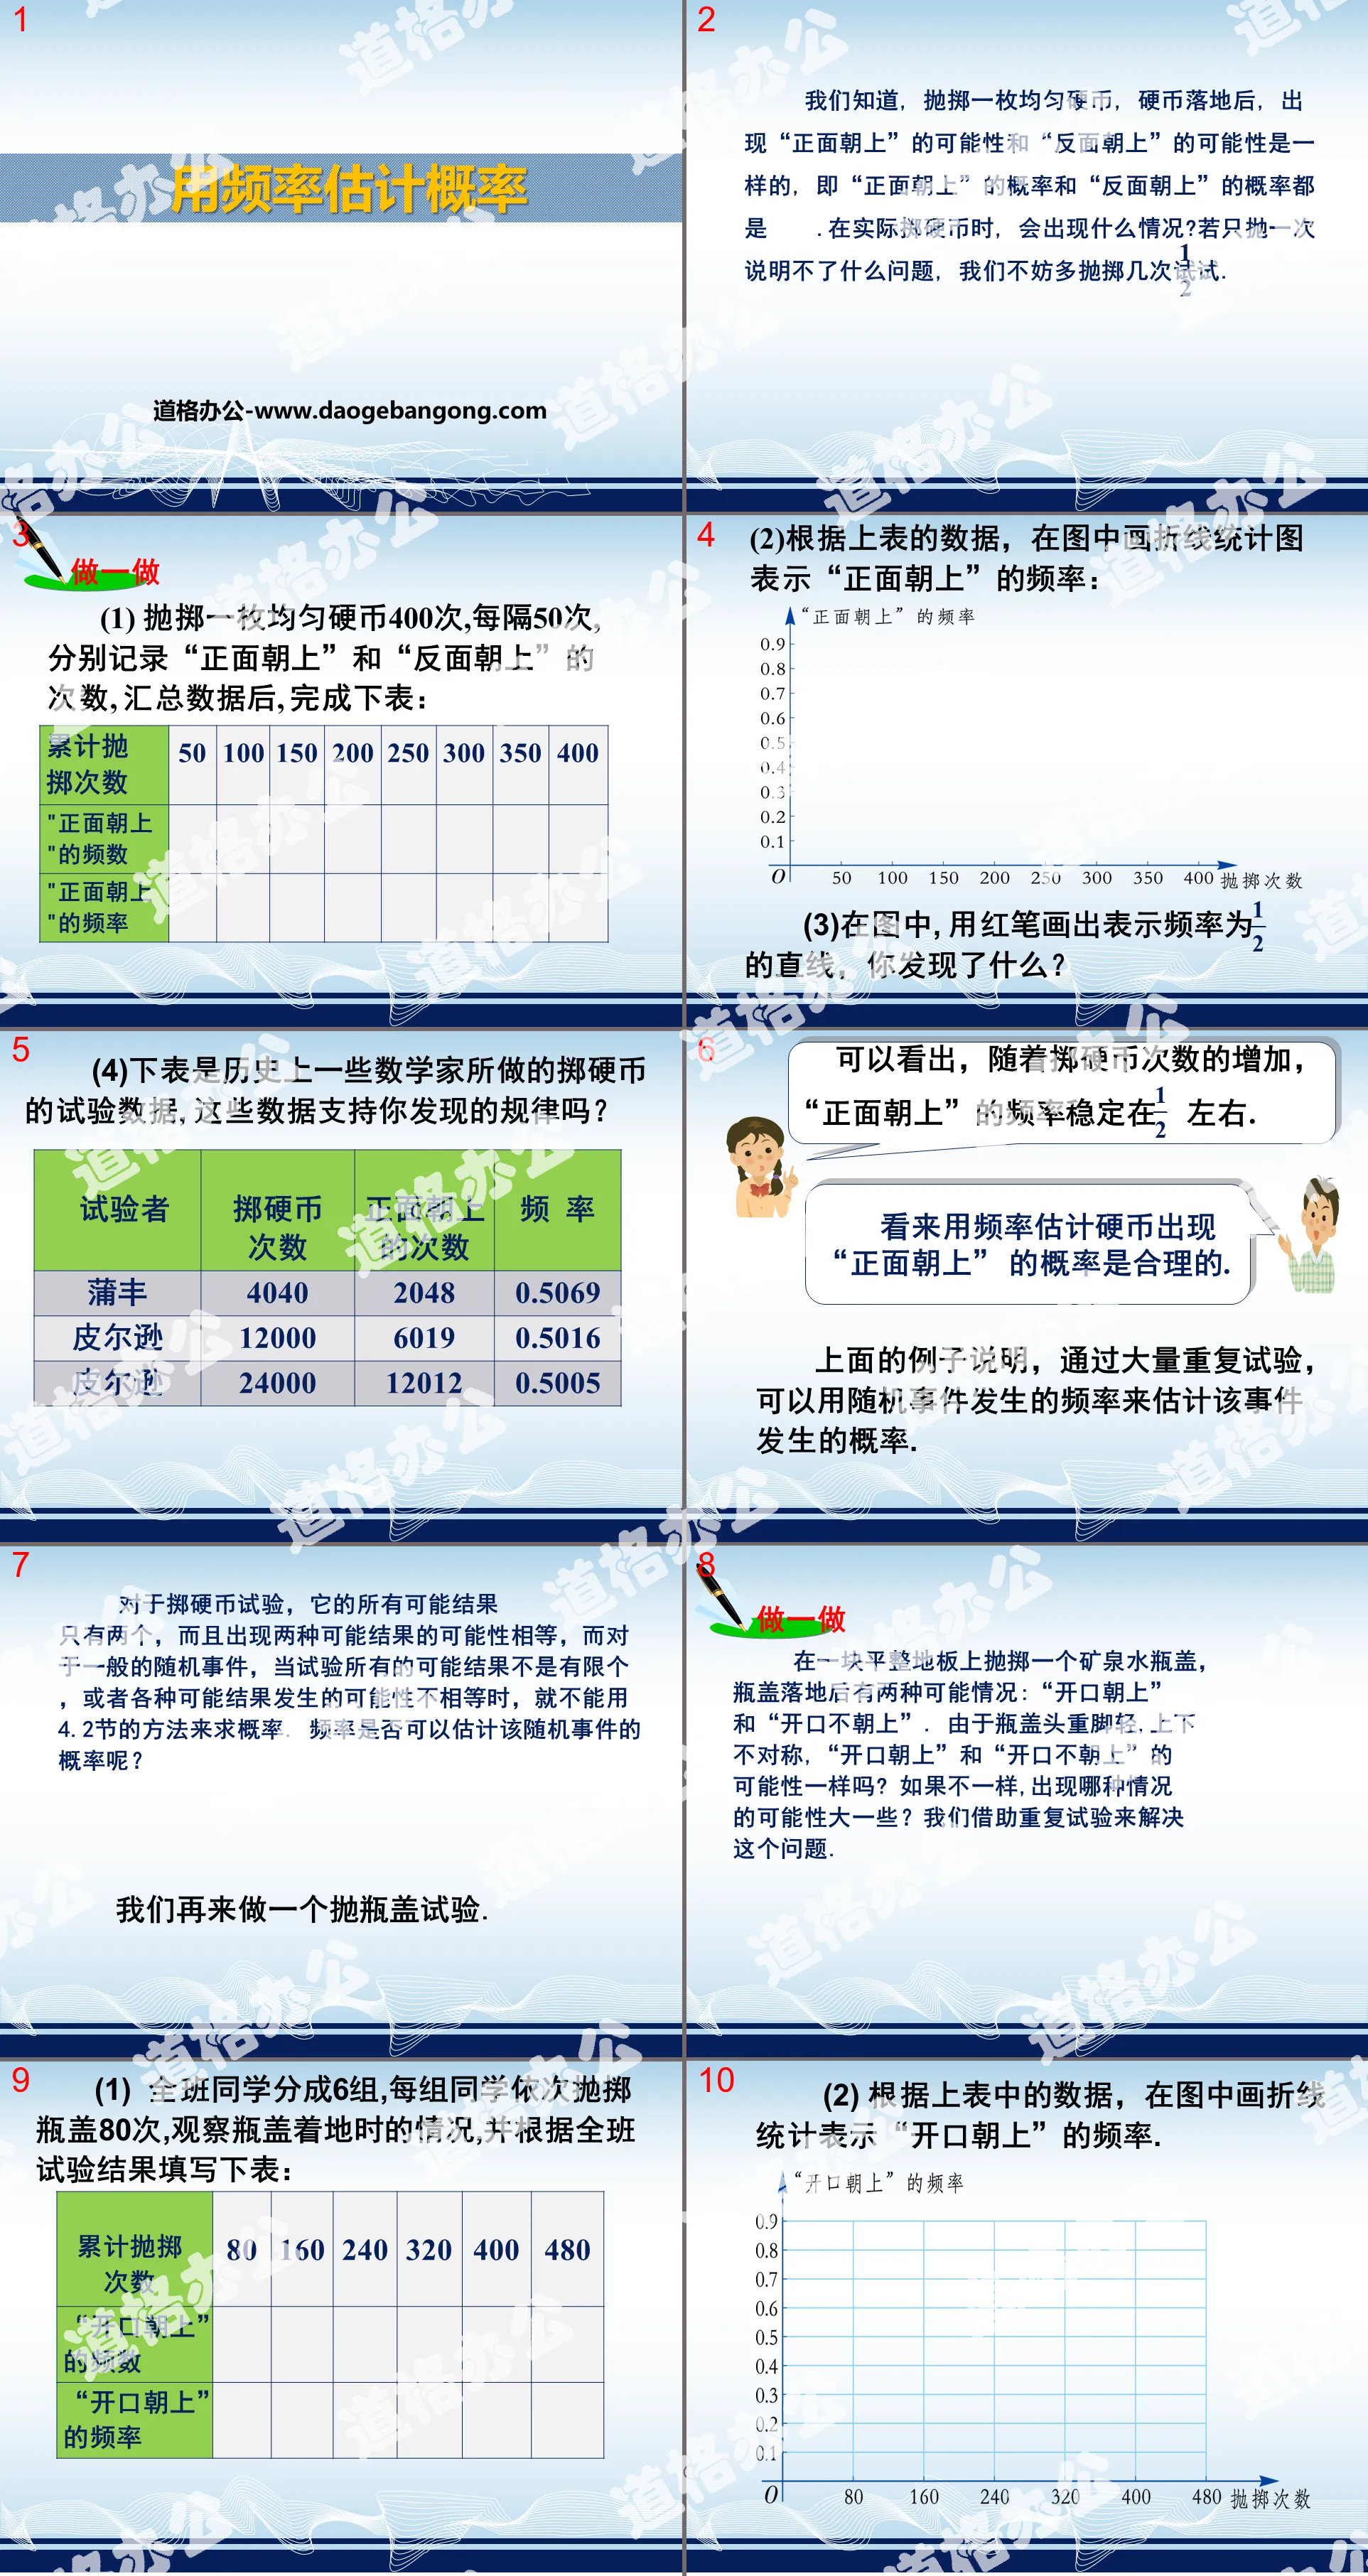
(1) Toss an even coin 400 times. Every 50 times, record the number of "heads" and "tails" respectively. After summarizing the data, complete the following table:
(2) Based on the data in the table above, draw a line statistical chart in the figure to represent the frequency of "heads up":
(3) In the picture, use a red pen to draw a straight line indicating the frequency of 1/2. What did you find?
(4) The following table is the experimental data of coin tossing conducted by some mathematicians in history. Do these data support the pattern you discovered?
It can be seen that as the number of coin tosses increases, the frequency of "heads" stabilizes at about 1/2.
It seems reasonable to use frequency to estimate the probability of a coin landing "heads".
The above example shows that through a large number of repeated experiments, the frequency of a random event can be used to estimate the probability of that event.
Using frequency to estimate probability PPT, part 2: example analysis
For example, the production of ceramic tiles is affected by the firing time, temperature, and material. When a brick is fired in a furnace, it may become a qualified product, a defective product, or a waste product. Which result will occur?
It cannot be predicted before firing, so this is a random phenomenon, and the result of firing is a "qualified product" is a random event. The probability of this event is called the "qualified product rate". Since the firing result is not equally possible, How often do we commonly use “qualified products”?
As an estimate of "good product rate".
A ceramic tile factory conducted quality inspections on a large number of recently released ceramic tiles of a certain model. The results are as follows:
(1) Calculate each frequency of qualified products in the table above (accurate to 0.001);
(2) Estimate the qualified product rate of this ceramic tile (accurate to 0.01);
(3) If the factory produces 500,000 tiles of this model this month, try to estimate the number of qualified products.
Solution: (1) Calculate item by item and fill in the table as follows:
(2) Observing the above table, we can find that when the number of tiles sampled is n ≥ 400, the frequency of qualified products is stable around 0.962, so we can take p = 0.96 as an estimate of the qualified product rate of this type of tiles.
(3) 500000×96%=480000 (blocks),
It can be estimated that the number of qualified products of this model is 480,000 pieces.
Using frequency to estimate probability PPT, part 3: practice
The picture shows a turntable that can rotate freely. The surface of the turntable is divided into 8 identical sectors, and the colors are divided into three types: red, yellow, and blue. The pointer of the turntable is fixed, and the turntable is allowed to rotate freely. When it stops, write down where the pointer points. Color. Repeat this 50 times and record the results in the table below:
(1) Try to estimate the probability that when the disk stops, the pointer points to yellow?
(2) If the disk is freely rotated 240 times, approximately how many times will the pointer point to yellow?
Keywords: Free download of Hebei Education Edition mathematics PPT courseware for the second volume of the ninth grade, using frequency to estimate probability PPT download, .PPT format;
For more information about the PPT courseware "Estimating Probability Using Frequency", please click the Estimating Probability Using Frequency ppt tag.
"Estimating Probability Using Frequency" PPT courseware download:
"Using Frequency to Estimate Probability" PPT courseware download Part 1: Learning objectives: Through experiments, statistics and other activities, be able to use experimental methods to estimate the probability of some complex random events. New Lesson Introduction The following events are certain events: ( ) A. Throw one...
"Estimating Probability Using Frequency" PPT download:
"Using Frequency to Estimate Probability" PPT Download Part One Content: Teaching Objectives 1. Through experiments and operations, understand the uncertainty of whether random events will occur in each experiment, and understand the relationship between the number of repeated experiments and the frequency of events. relation. 2. Ability to follow frequency...
"Estimating Probability Using Frequency" PPT:
"Using Frequency to Estimate Probability" PPT Part One Content: Knowledge Review Questions (choose one of the two questions): 1. Toss a die, the probability that the number on the upward side is 6 is_. Equally possible events. Various outcomes are equally likely to occur. The results of an experiment are finite..
File Info
Update Time: 2024-10-19
This template belongs to Mathematics courseware Hebei Education Edition Ninth Grade Mathematics Volume 2 industry PPT template
"Estimating Probability Using Frequency" PPT courseware Simple campus recruitment activity planning plan summary enterprise and institution recruitment publicity lecture PPT template is a general PPT template for business post competition provided by the manuscript PPT, simple campus recruitment activity planning plan summary enterprise and institution recruitment promotion Lecture PPT template, you can edit and modify the text and pictures in the source file by downloading the source file. If you want more exquisite business PPT templates, you can come to grid resource. Doug resource PPT, massive PPT template slide material download, we only make high-quality PPT templates!
Tips: If you open the template and feel that it is not suitable for all your needs, you can search for related content "Estimating Probability Using Frequency" PPT courseware is enough.
How to use the Windows system template
Directly decompress the file and use it with office or wps
How to use the Mac system template
Directly decompress the file and use it Office or wps can be used
Related reading
For more detailed PPT-related tutorials and font tutorials, you can view: Click to see
How to create a high-quality technological sense PPT? 4 ways to share the bottom of the box
Notice
Do not download in WeChat, Zhihu, QQ, built-in browsers, please use mobile browsers to download! If you are a mobile phone user, please download it on your computer!
1. The manuscript PPT is only for study and reference, please delete it 24 hours after downloading.
2. If the resource involves your legitimate rights and interests, delete it immediately.
3. Contact information: service@daogebangong.com
"Estimating Probability Using Frequency" PPT courseware, due to usage restrictions, it is only for personal study and reference use. For commercial use, please go to the relevant official website for authorization.
(Personal non-commercial use refers to the use of this font to complete the display of personal works, including but not limited to the design of personal papers, resumes, etc.)
Preview
Related Search:
"Estimating Probability Using Frequency" PPT courseware
2024-10-19
Copyright statement: This material is compiled and released by the user of Daoge Resources. The copyright belongs to the author. For commercial use, please contact the copyright owner. If there is any infringement, please contact the webmaster to remove the resource.
Download Points: 0.00
Free Download
Upgrade VIP
Favorite
Views: 5016 / Downloads: 801


