Western Normal University Edition First Grade Mathematics Volume 1
Beijing Normal University Edition Seventh Grade Mathematics Volume 1
People's Education Press First Grade Mathematics Volume 1
People's Education Press Second Grade Mathematics Volume 1
Beijing Normal University Edition Seventh Grade Mathematics Volume 2
People's Education Press Third Grade Mathematics Volume 1
Beijing Normal University Edition Eighth Grade Mathematics Volume 1
Qingdao Edition Seventh Grade Mathematics Volume 1
Beijing Normal University Edition Fifth Grade Mathematics Volume 1
Hebei Education Edition Third Grade Mathematics Volume 1
Hebei Education Edition Seventh Grade Mathematics Volume 2
People's Education Press First Grade Mathematics Volume 2
People's Education High School Mathematics Edition B Compulsory Course 2
Qingdao Edition Seventh Grade Mathematics Volume 2
Beijing Normal University Edition Fifth Grade Mathematics Volume 2
Hebei Education Edition Fourth Grade Mathematics Volume 2

| Category | Format | Size |
|---|---|---|
| People's Education Press Eighth Grade Mathematics Volume 2 | pptx | 6 MB |
Description
"Data Analysis in Physical Fitness Test" Data Analysis PPT Courseware 3
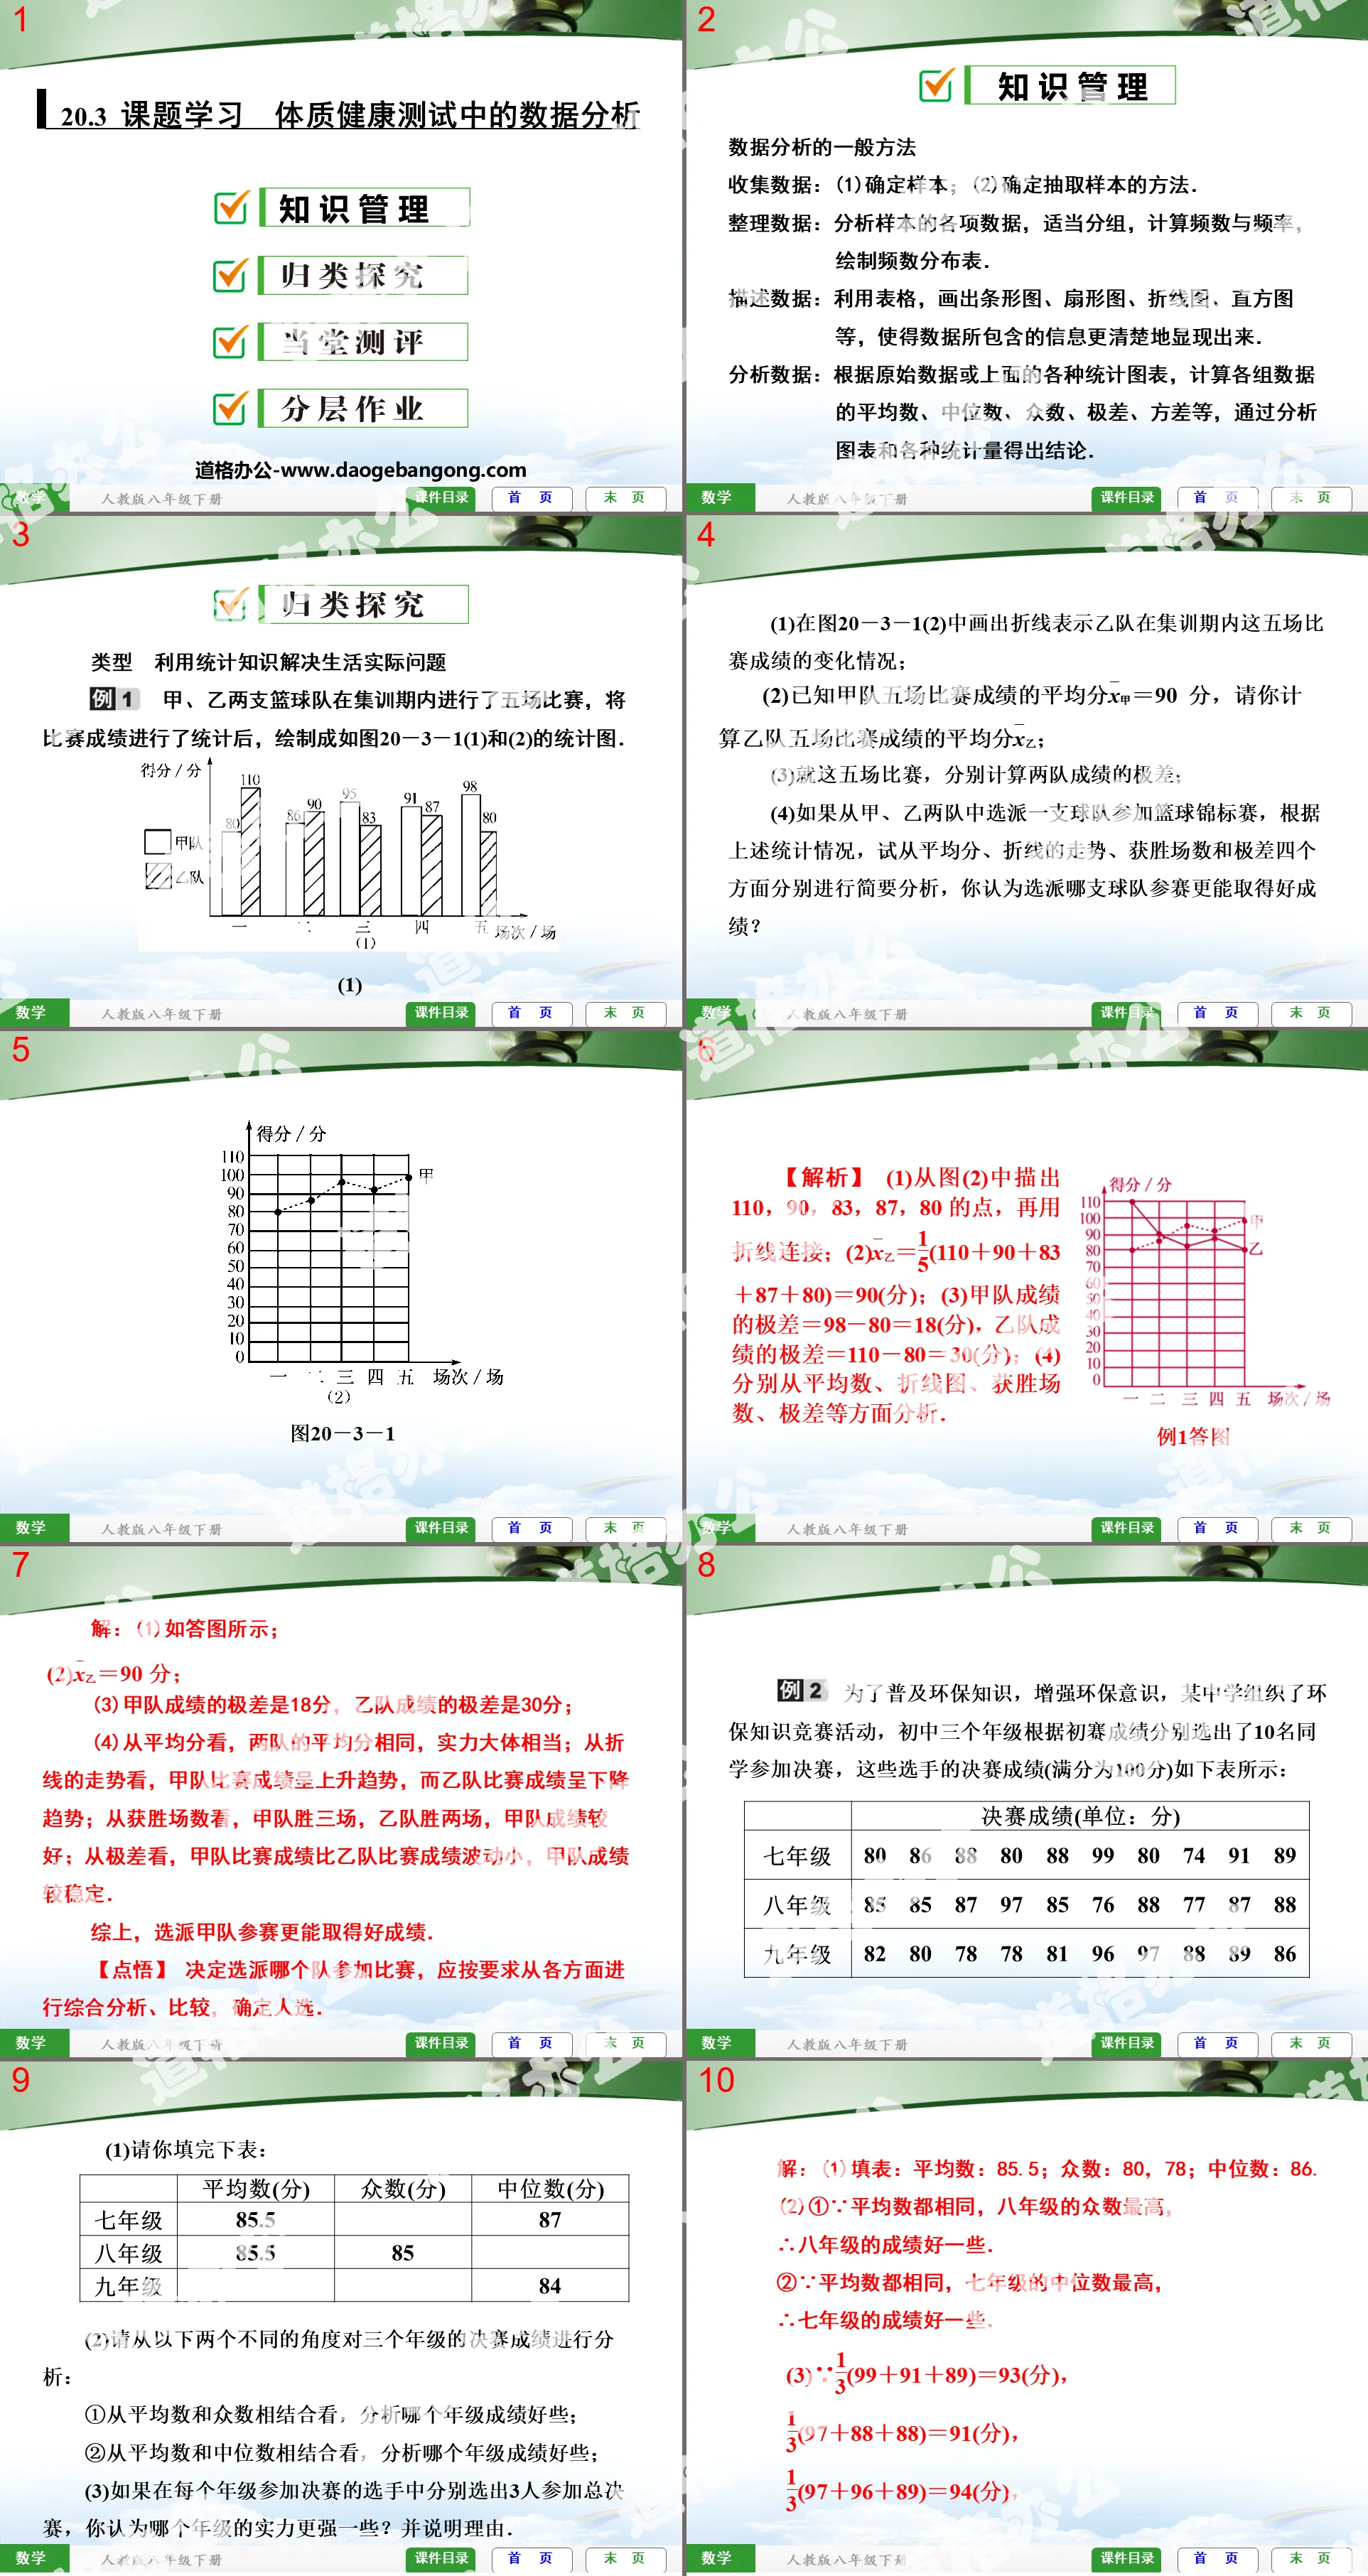
knowledge management
General methods of data analysis
Collect data: (1) Determine the sample; (2) Determine the method of extracting the sample.
Organize the data: analyze the various data of the sample, group them appropriately, calculate frequency and frequency, and draw a frequency distribution table.
Describe data: Use tables to draw bar charts, fan charts, line charts, histograms, etc., so that the information contained in the data can be displayed more clearly.
Analyze data: Calculate the average, median, mode, range, variance, etc. of each group of data based on the original data or various statistical charts above, and draw conclusions by analyzing charts and various statistics.
Type: Use statistical knowledge to solve practical problems in life
Two basketball teams, A and B, played five games during the training period. After statistics of the game results, the statistical charts shown in Figure 20-3-1 (1) and (2) were drawn.
(1) Draw a broken line in Figure 20-3-1(2) to show the changes in the results of Team B in these five games during the training period;
(2) It is known that the average score of team A’s five games is x-A=90 points. Please calculate the average score of team B’s five games x-B;
(3) For these five games, calculate the extreme difference in the results of the two teams;
(4) If a team is selected from Team A and Team B to participate in a basketball championship, based on the above statistics, try to conduct a brief analysis from the four aspects of average score, trend of the break line, number of wins and range, what do you think Which team should be selected to participate in the competition to achieve better results?
【Analysis】
(1) Draw the points 110, 90, 83, 87, and 80 from Figure (2), and then connect them with polylines;
(2)x-B=15(110+90+83+87+80)=90(points);
(3) The extreme difference of team A’s performance = 98-80 = 18 (points), the extreme difference of team B’s performance = 110-80 = 30 (points);
(4) Analyze from the aspects of average, line chart, number of wins, range, etc.
Solution: (1) As shown in the answer diagram; (2) x-B = 90 points;
(3) The extreme difference in team A’s performance is 18 points, and the extreme difference in team B’s performance is 30 points;
(4) From the perspective of average scores, the average scores of the two teams are the same and their strengths are roughly the same; from the trend of the broken line, the performance of Team A is on an upward trend, while the performance of Team B is on a downward trend; in terms of the number of wins, Team A If team B wins three games and team B wins two, team A's performance is better; from the extreme point of view, team A's game results fluctuate less than team B's game results, and team A's results are more stable.
To sum up, selecting Team A to participate in the competition can achieve better results.
[Impression] When deciding which team to send to participate in the competition, comprehensive analysis and comparison should be conducted from all aspects as required to determine the candidate.
In-person evaluation
1. [2013·Jining]Which of the following statements is correct ( )
A. The median is the middle number in a set of data
B. The mode of the set of data 8, 9, 9, 10, 10, 11 is 9
C. If the average of x1, x2, x3,…,xn is x-, then (x1-x)+(x2-x)+…+(xn-x)=0
D. The variance of a set of data is the square of the range of the set of data
2. [2013·Jinzhou]In response to the call to "save water", Xiaogang randomly investigated the average monthly water consumption (unit: tons) of the families of 5 of the 35 students in the class for one year. The records are as follows: 8, 9, 8, 7, 10. The mean and median of this set of data are ( )
A. 8,8 B. 8.4,8
C. 8.4, 8.4 D. 8,8.4
3. [2013·Taian]Ten students from Class 1 of Grade 9 of the Experimental School conducted a fixed-point shooting test. Each student shot six times. The statistics of the number of hits are as follows: 5, 4, 3, 5, 5, 2 , 5, 3, 4, 1, then the median and mode of this set of data are ( )
A. 4,5 B. 5,4
C. 4,4,D. 5,5
Keywords: Data analysis teaching courseware, data analysis teaching courseware in physical health test, New People's Education Edition eighth grade mathematics volume 2 PPT courseware, eighth grade mathematics slide courseware download, data analysis PPT courseware download, physical health test Data analysis PPT courseware download, .ppt format
For more information about the PPT courseware "Data Analysis in Physical Fitness Test" PPT courseware, please click the "Data Analysis ppt Data Analysis in Physical Health Test ppt" tag.
"Data Analysis in Physical Fitness Test" Data Analysis PPT Courseware 2:
"Data Analysis in Physical Fitness Test" Data Analysis PPT Courseware 2 Learning Objectives: 1. Able to determine and draw samples according to actual needs; 2. Based on the extracted samples, organize, describe and analyze the collected data, and make correct comments on the statistical results..
"Data Analysis in Physical Fitness Test" Data Analysis PPT Courseware:
"Data Analysis in Physical Fitness Test" Data Analysis PPT Courseware Teaching Objectives Knowledge and Abilities 1. Use relevant knowledge of statistical mathematics to improve mathematical application skills; 2. Able to determine and draw samples according to actual needs; 3. Based on the samples taken, the collection...
File Info
Update Time: 2024-11-22
This template belongs to Mathematics courseware People's Education Press Eighth Grade Mathematics Volume 2 industry PPT template
"Data Analysis in Physical Fitness Test" Data Analysis PPT Courseware 3 Simple campus recruitment activity planning plan summary enterprise and institution recruitment publicity lecture PPT template is a general PPT template for business post competition provided by the manuscript PPT, simple campus recruitment activity planning plan summary enterprise and institution recruitment promotion Lecture PPT template, you can edit and modify the text and pictures in the source file by downloading the source file. If you want more exquisite business PPT templates, you can come to grid resource. Doug resource PPT, massive PPT template slide material download, we only make high-quality PPT templates!
Tips: If you open the template and feel that it is not suitable for all your needs, you can search for related content "Data Analysis in Physical Fitness Test" Data Analysis PPT Courseware 3 is enough.
How to use the Windows system template
Directly decompress the file and use it with office or wps
How to use the Mac system template
Directly decompress the file and use it Office or wps can be used
Related reading
For more detailed PPT-related tutorials and font tutorials, you can view: Click to see
How to create a high-quality technological sense PPT? 4 ways to share the bottom of the box
Notice
Do not download in WeChat, Zhihu, QQ, built-in browsers, please use mobile browsers to download! If you are a mobile phone user, please download it on your computer!
1. The manuscript PPT is only for study and reference, please delete it 24 hours after downloading.
2. If the resource involves your legitimate rights and interests, delete it immediately.
3. Contact information: service@daogebangong.com
"Data Analysis in Physical Fitness Test" Data Analysis PPT Courseware 3, due to usage restrictions, it is only for personal study and reference use. For commercial use, please go to the relevant official website for authorization.
(Personal non-commercial use refers to the use of this font to complete the display of personal works, including but not limited to the design of personal papers, resumes, etc.)
Preview


