Western Normal University Edition First Grade Mathematics Volume 1
Beijing Normal University Edition Seventh Grade Mathematics Volume 1
People's Education Press First Grade Mathematics Volume 1
People's Education Press Second Grade Mathematics Volume 1
People's Education Press Third Grade Mathematics Volume 1
Beijing Normal University Edition Seventh Grade Mathematics Volume 2
Qingdao Edition Seventh Grade Mathematics Volume 1
Hebei Education Edition Third Grade Mathematics Volume 1
Beijing Normal University Edition Fifth Grade Mathematics Volume 1
Beijing Normal University Edition Eighth Grade Mathematics Volume 1
People's Education High School Mathematics Edition B Compulsory Course 2
Hebei Education Edition Seventh Grade Mathematics Volume 2
Hebei Education Edition Fourth Grade Mathematics Volume 2
Beijing Normal University Edition Fifth Grade Mathematics Volume 2
Qingdao Edition Seventh Grade Mathematics Volume 2
People's Education Press First Grade Mathematics Volume 2
| Category | Format | Size |
|---|---|---|
| Beijing Normal University eighth grade mathematics volume 2 | pptx | 6 MB |

"Data Fluctuations" Data Collection and Processing PPT Courseware 2
2024-10-11
Copyright statement: This material is compiled and released by the user of Daoge Resources. The copyright belongs to the author. For commercial use, please contact the copyright owner. If there is any infringement, please contact the webmaster to remove the resource.
Download Points: 0.00
Free Download
Upgrade VIP
Favorite
Views: 4631 / Downloads: 83
Description
"Data Fluctuations" Data Collection and Processing PPT Courseware 2
Courseware description
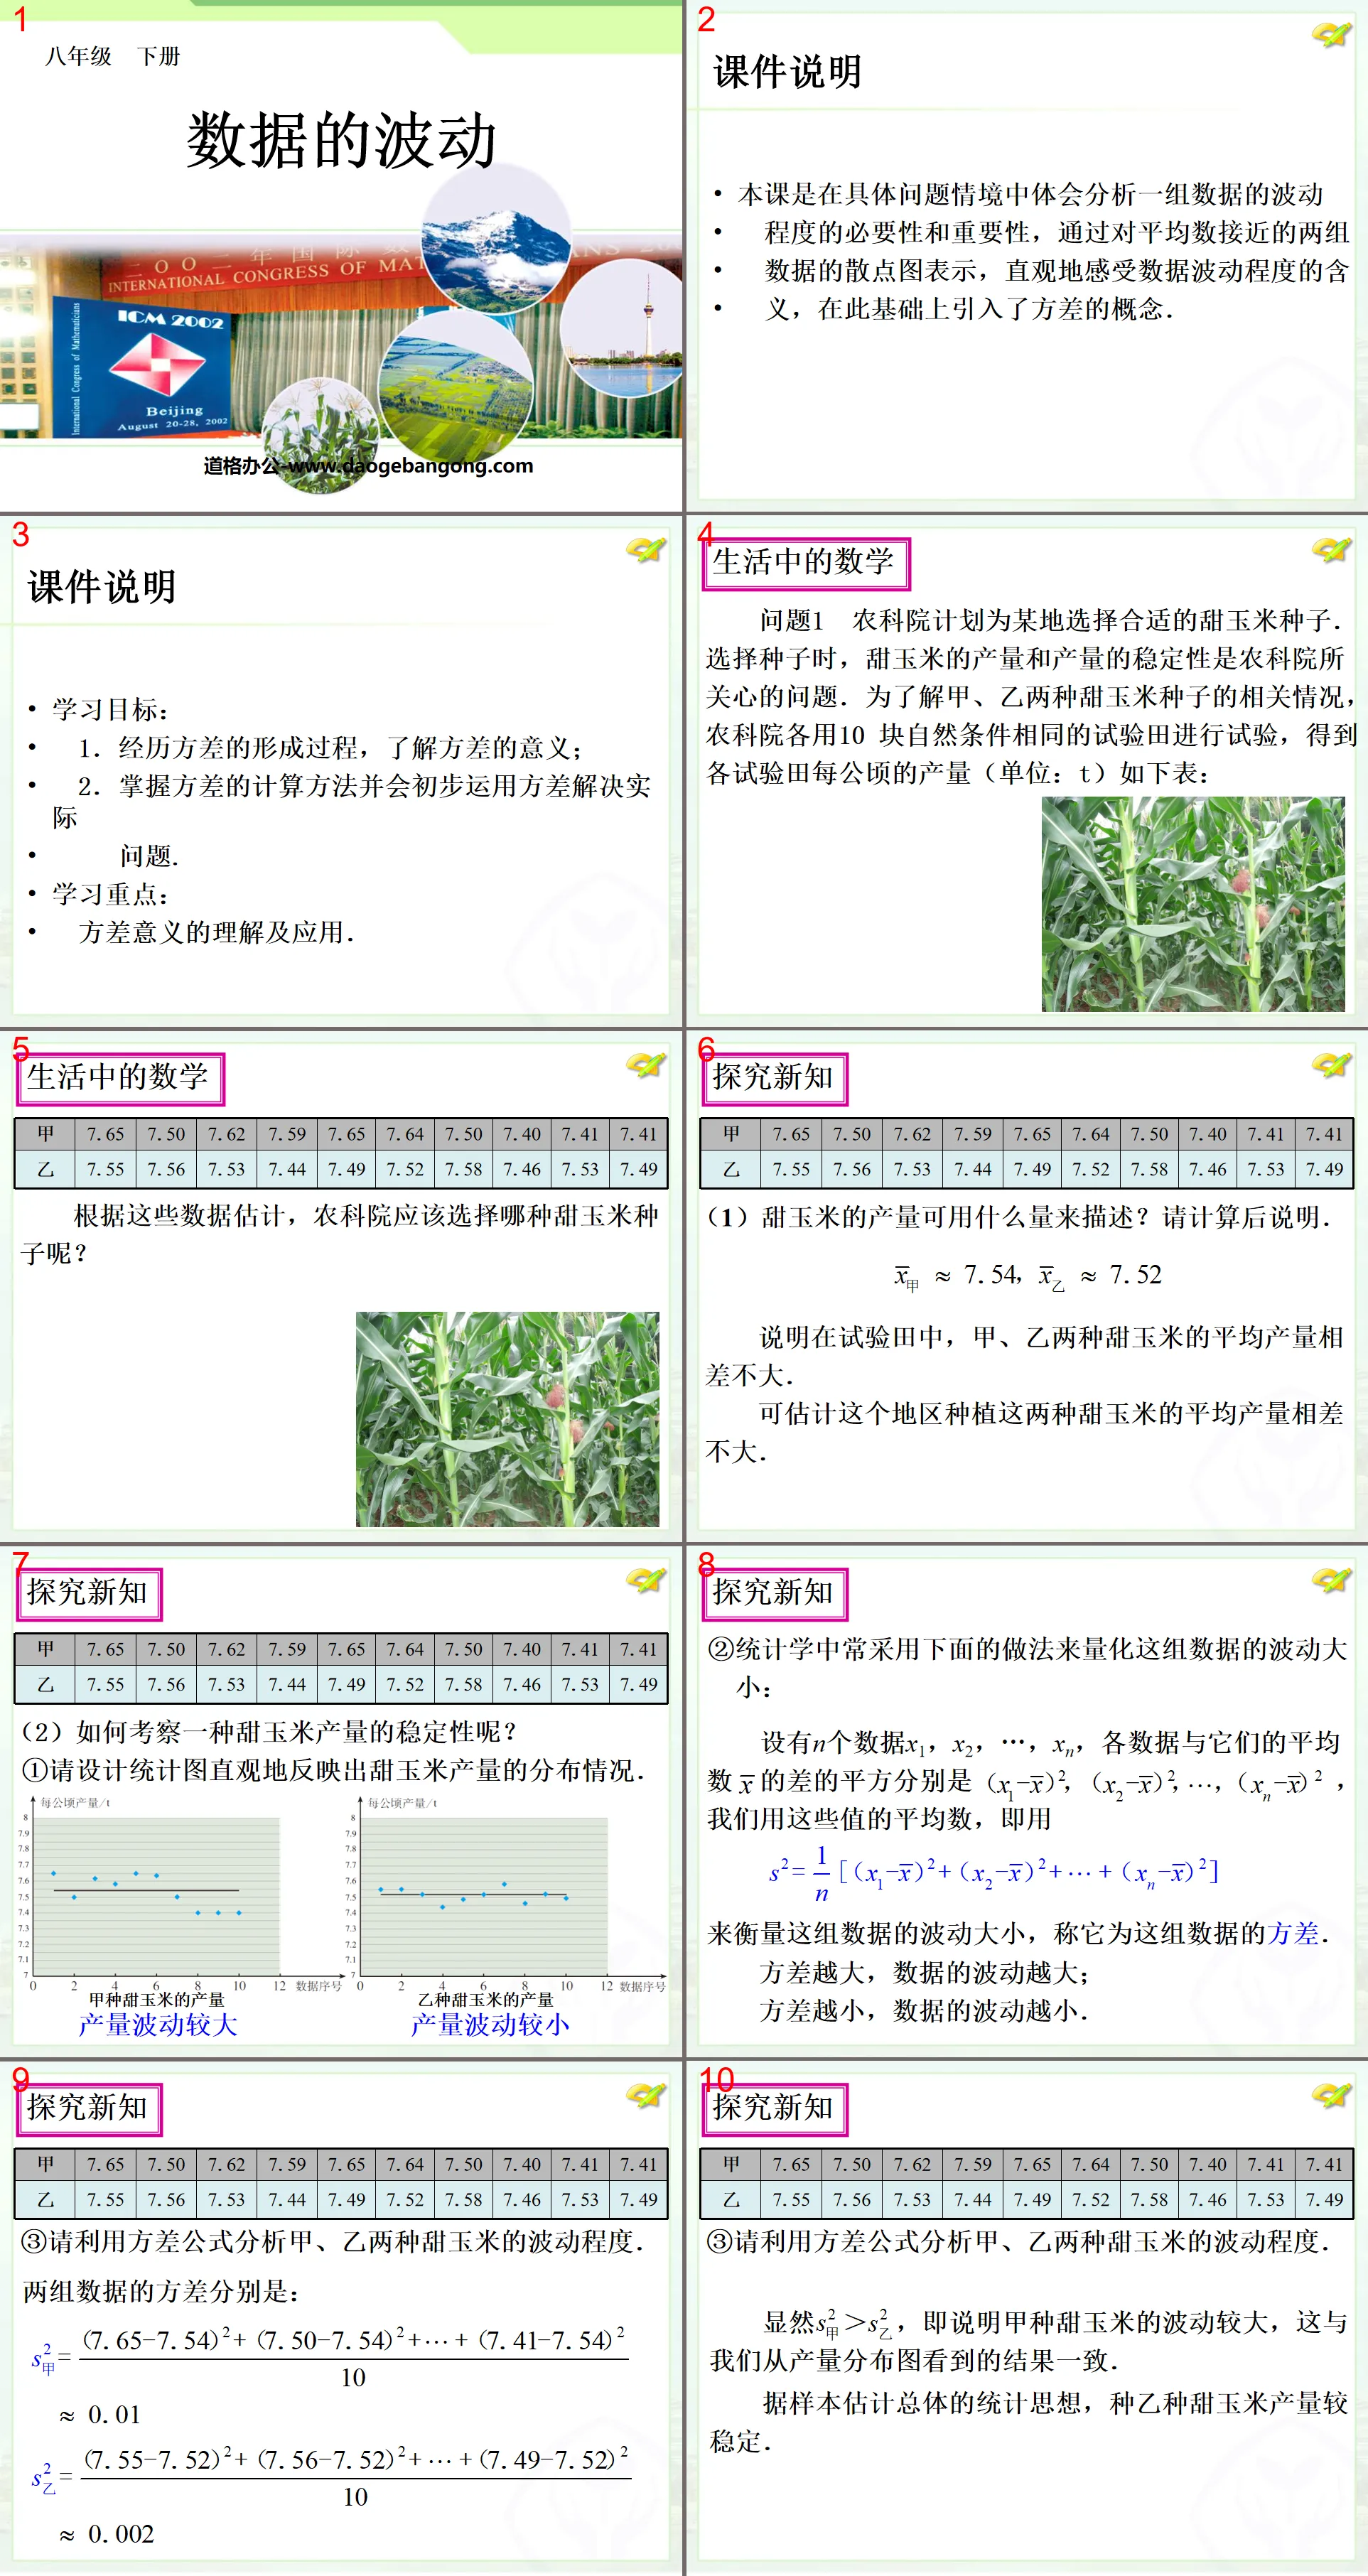
This course is to understand the necessity and importance of analyzing the degree of fluctuation of a set of data in a specific problem situation. Through the scatter plot representation of two sets of data with close averages, one can intuitively feel the meaning of the degree of data fluctuation. On this basis The concept of variance is introduced above.
learning target:
1. Experience the formation process of variance and understand the meaning of variance;
2. Master the calculation method of variance and be able to initially use variance to solve practical problems.
Learning points:
Understanding and application of the meaning of variance.
Explore new knowledge
(1) What quantity can be used to describe the yield of sweet corn? Please explain after calculation.
This shows that in the experimental field, the average yields of sweet corn A and B are not much different.
It can be estimated that the average yields of these two types of sweet corn planted in this area are not much different.
(2) How to check the stability of the yield of a sweet corn?
① Please design a statistical chart to visually reflect the distribution of sweet corn yield.
②In statistics, the following method is often used to quantify the fluctuation of this set of data:
Assume n data x1, x2,...,xn, the squares of the differences between each data and their average x are respectively,
We use the average of these values to measure the fluctuation of this set of data, and call it the variance of this set of data. The greater the variance, the greater the fluctuation of the data;
The smaller the variance, the smaller the fluctuation of the data.
Class summary
(1) How to calculate variance?
S²=1/n[(x1-x)²+(x2-x)²+......(xn-x)²]
(2) How do you understand the meaning of variance?
The greater the variance, the greater the fluctuation of the data;
The smaller the variance, the smaller the fluctuation of the data.
Applicable conditions for variance: When the averages of two sets of data are equal or similar, variance can be used to judge their fluctuations.
Keywords: data collection and processing teaching courseware, data fluctuation teaching courseware, Beijing Normal University edition eighth grade mathematics volume 2 PPT courseware, eighth grade mathematics slide courseware download, data collection and processing PPT courseware download, data fluctuation PPT Courseware download, .ppt format
For more information about the PPT courseware "Data Collection and Processing Data Fluctuation", please click the Data Collection and Processing ppt Data Fluctuation ppt tag.
"Data Fluctuation" Data Collection and Processing PPT Courseware 3:
"Data Fluctuation" Data Collection and Processing PPT Courseware 3 Problem Situation In order to improve the international competitiveness of agricultural and sideline products, some industry associations have divided the planning of agricultural and sideline products. A foreign trade company wants to export a batch of 75g chicken legs. There are currently 2 manufacturers providing...
"Data Fluctuations" Data Collection and Processing PPT Courseware:
"Data Fluctuation" Data Collection and Processing PPT Courseware Scenario 1. There are two boxes of apples A and B of the same variety. Their total mass is the same, both 5kg, and the number of apples in each box is also the same; but among them, the apples in box A The big one is very big, the small one is very small, and the apples in box B...
File Info
Update Time: 2024-10-11
This template belongs to Mathematics courseware Beijing Normal University eighth grade mathematics volume 2 industry PPT template
"Data Fluctuations" Data Collection and Processing PPT Courseware 2 Simple campus recruitment activity planning plan summary enterprise and institution recruitment publicity lecture PPT template is a general PPT template for business post competition provided by the manuscript PPT, simple campus recruitment activity planning plan summary enterprise and institution recruitment promotion Lecture PPT template, you can edit and modify the text and pictures in the source file by downloading the source file. If you want more exquisite business PPT templates, you can come to grid resource. Doug resource PPT, massive PPT template slide material download, we only make high-quality PPT templates!
Tips: If you open the template and feel that it is not suitable for all your needs, you can search for related content "Data Fluctuations" Data Collection and Processing PPT Courseware 2 is enough.
How to use the Windows system template
Directly decompress the file and use it with office or wps
How to use the Mac system template
Directly decompress the file and use it Office or wps can be used
Related reading
For more detailed PPT-related tutorials and font tutorials, you can view: Click to see
How to create a high-quality technological sense PPT? 4 ways to share the bottom of the box
Notice
Do not download in WeChat, Zhihu, QQ, built-in browsers, please use mobile browsers to download! If you are a mobile phone user, please download it on your computer!
1. The manuscript PPT is only for study and reference, please delete it 24 hours after downloading.
2. If the resource involves your legitimate rights and interests, delete it immediately.
3. Contact information: service@daogebangong.com
"Data Fluctuations" Data Collection and Processing PPT Courseware 2, due to usage restrictions, it is only for personal study and reference use. For commercial use, please go to the relevant official website for authorization.
(Personal non-commercial use refers to the use of this font to complete the display of personal works, including but not limited to the design of personal papers, resumes, etc.)
Preview
Related Search:
"Data Fluctuations" Data Collection and Processing PPT Courseware 2
2024-10-11
Copyright statement: This material is compiled and released by the user of Daoge Resources. The copyright belongs to the author. For commercial use, please contact the copyright owner. If there is any infringement, please contact the webmaster to remove the resource.
Download Points: 0.00
Free Download
Upgrade VIP
Favorite
Views: 4631 / Downloads: 83


