"Data Collation" PPT Courseware 2 Simple campus recruitment activity planning plan summary enterprise and institution recruitment publicity lecture PPT template is a general PPT template for business post competition provided by the manuscript PPT, simple campus recruitment activity planning plan summary enterprise and institution recruitment promotion Lecture PPT template, you can edit and modify the text and pictures in the source file by downloading the source file. If you want more exquisite business PPT templates, you can come to grid resource. Doug resource PPT, massive PPT template slide material download, we only make high-quality PPT templates!
| 文件名 如何下载使用 | 下载次数 | Download Points | 下载地址 |
|---|---|---|---|
| "Data Collation" PPT Cou... | 22025次 | 0.00 | Free Download |
Tips: If you open the template and feel that it is not suitable for all your needs, you can search for related content "Data Collation" PPT Courseware 2 is enough.
How to use the Windows system template
Directly decompress the file and use it with office or wps
How to use the Mac system template
Directly decompress the file and use it Office or wps can be used
Related reading
For more detailed PPT-related tutorials and font tutorials, you can view: Click to see
How to create a high-quality technological sense PPT? 4 ways to share the bottom of the box
Notice
Do not download in WeChat, Zhihu, QQ, built-in browsers, please use mobile browsers to download! If you are a mobile phone user, please download it on your computer!
1. The manuscript PPT is only for study and reference, please delete it 24 hours after downloading.
2. If the resource involves your legitimate rights and interests, delete it immediately.
3. Contact information: service@daogebangong.com
"Data Collation" PPT Courseware 2, due to usage restrictions, it is only for personal study and reference use. For commercial use, please go to the relevant official website for authorization.
(Personal non-commercial use refers to the use of this font to complete the display of personal works, including but not limited to the design of personal papers, resumes, etc.)

Related reading
For more detailed PPT-related tutorials and font tutorials, you can view:Please click to see


Authoritative PPT Summary
"Data Collation" PPT Courseware 2
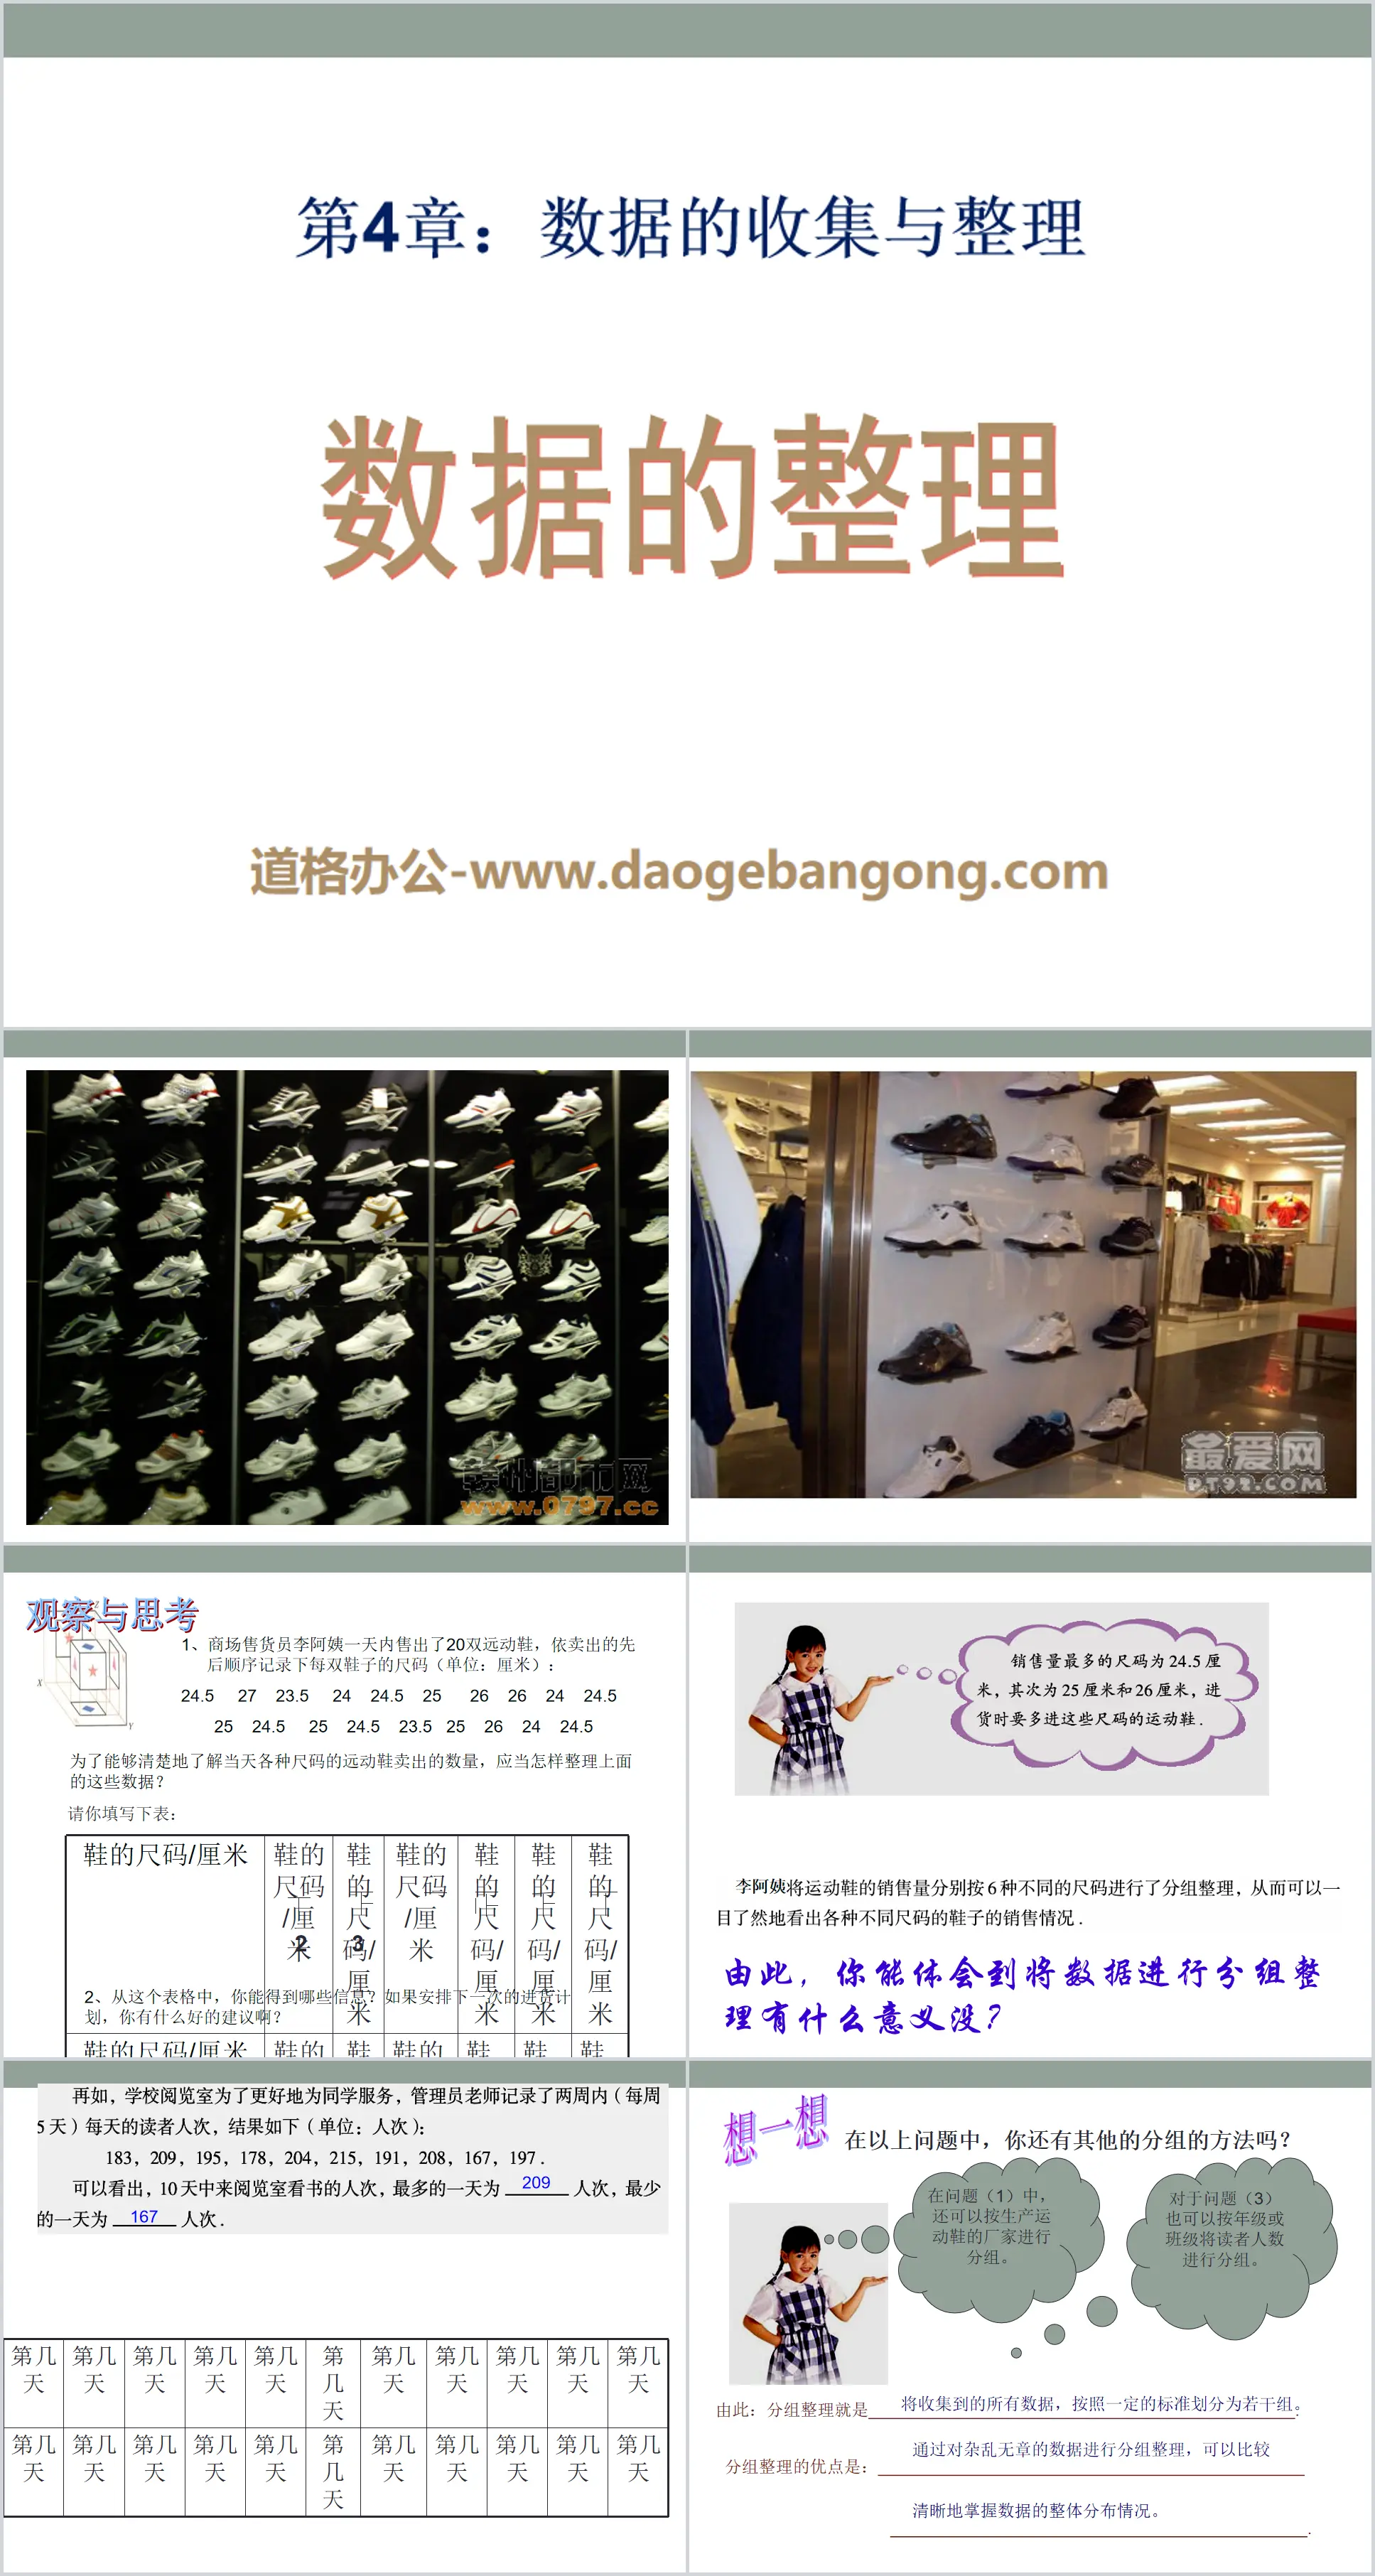
Observe and think
1. Aunt Li, a salesperson in the shopping mall, sold 20 pairs of telescoping shoes in one day. Record the size of each pair of shoes in the order of sales (unit: centimeters):
24.5 27 23.5 24 24.5 25 26 26 24 24.5
25 24.5 25 24.5 23.5 25 26 24 24.5
In order to clearly understand the number of telekinetic shoes of various sizes sold that day, how should the above data be organized?
2. What information can you get from this form? Do you have any good suggestions for arranging the next purchase plan?
From this, can you understand the significance of grouping data?
think about it
Do you have any other grouping methods for the above questions?
Therefore: Grouping is to divide all the collected data into several groups according to certain standards.
The advantage of grouping is that by grouping and organizing messy data, the overall distribution of the data can be clearly understood.
1. The following data is a survey record of the birth months of 50 students in a seventh-grade class:
2, 12, 9, 8, 11, 5, 7, 11, 6, 4,
11, 8, 5, 7, 2, 7, 2, 12, 1, 9,
9, 11, 3, 8, 6, 3, 10, 8, 11, 5,
12, 2, 4, 7, 8, 1, 9, 10, 5, 3,
8, 6, 12, 3, 8, 10, 4, 7, 9, 12.
(1) Please regroup the above data so that the whole class can see at a glance the number of births per month.
(2) Based on the results of grouping, please tell me immediately how many students in this class have birthdays this month (October)?
Class summary
1. After studying this lesson, what do you know about the methods of collecting data?
The basic methods for collecting data include observation, statistics, survey, experiment, literature review or Internet query, etc.
2. How to group data appropriately?
According to the specific situation of statistics (needs) and (data range), divide the range of (data) into (several groups) and arrange them into tables according to (a certain order);
Count the number of (original data) in each group and fill in the statistical table.
Keywords: data arrangement teaching courseware, Qingdao edition seventh grade mathematics volume PPT courseware download, seventh grade mathematics slide courseware download, data arrangement PPT courseware download, .PPT format;
For more information about the "Data Collation" PPT courseware, please click on the Data Collation ppt tab.
"Data Collation and Representation" PPT courseware:
Contents of the first part of the PPT courseware "Data Collation and Presentation": Classroom Questions Question 1 Since liberation, my country's gross domestic product (GDP) has been on an increasing trend, from only 67.9 billion yuan in 1952 to 114.93 billion yuan in 1962 and 114.93 billion yuan in 1970. It rose to 2252.7 in the year..
"Data Arrangement and Presentation" PPT:
"Data Arrangement and Presentation" PPT Part One Content: New Lesson Introduction 1. Basic Definition: 1. Census: A comprehensive survey of the objects under investigation for a certain purpose, called census 2. Overall: the name of all objects under investigation for the overall. 3. Individual: Group..
"Data Collation" PPT courseware:
"Data Sorting" PPT Courseware Do It Among the four colors given below, which one do you like best? How do you plan to conduct a survey to find out which color our class’s favorite color is? For this reason, Xiao Ming, from Class 1, Grade 2, Guangming Middle School, asked the whole class...