Western Normal University Edition First Grade Mathematics Volume 1
Beijing Normal University Edition Seventh Grade Mathematics Volume 1
People's Education Press First Grade Mathematics Volume 1
People's Education Press Second Grade Mathematics Volume 1
Beijing Normal University Edition Seventh Grade Mathematics Volume 2
People's Education Press Third Grade Mathematics Volume 1
Beijing Normal University Edition Eighth Grade Mathematics Volume 1
Qingdao Edition Seventh Grade Mathematics Volume 1
Hebei Education Edition Third Grade Mathematics Volume 1
Beijing Normal University Edition Fifth Grade Mathematics Volume 1
Hebei Education Edition Seventh Grade Mathematics Volume 2
People's Education Press First Grade Mathematics Volume 2
People's Education High School Mathematics Edition B Compulsory Course 2
Qingdao Edition Seventh Grade Mathematics Volume 2
Hebei Education Edition Fourth Grade Mathematics Volume 2
Beijing Normal University Edition Fifth Grade Mathematics Volume 2

| Category | Format | Size |
|---|---|---|
| People's Education Press Mathematics Volume 2 for Sixth Grade | pptx | 6 MB |

"Complex Statistical Chart" Statistics PPT Courseware
2024-11-18
Copyright statement: This material is compiled and released by the user of Daoge Resources. The copyright belongs to the author. For commercial use, please contact the copyright owner. If there is any infringement, please contact the webmaster to remove the resource.
Download Points: 0.00
Free Download
Upgrade VIP
Favorite
Views: 3562 / Downloads: 295
Description
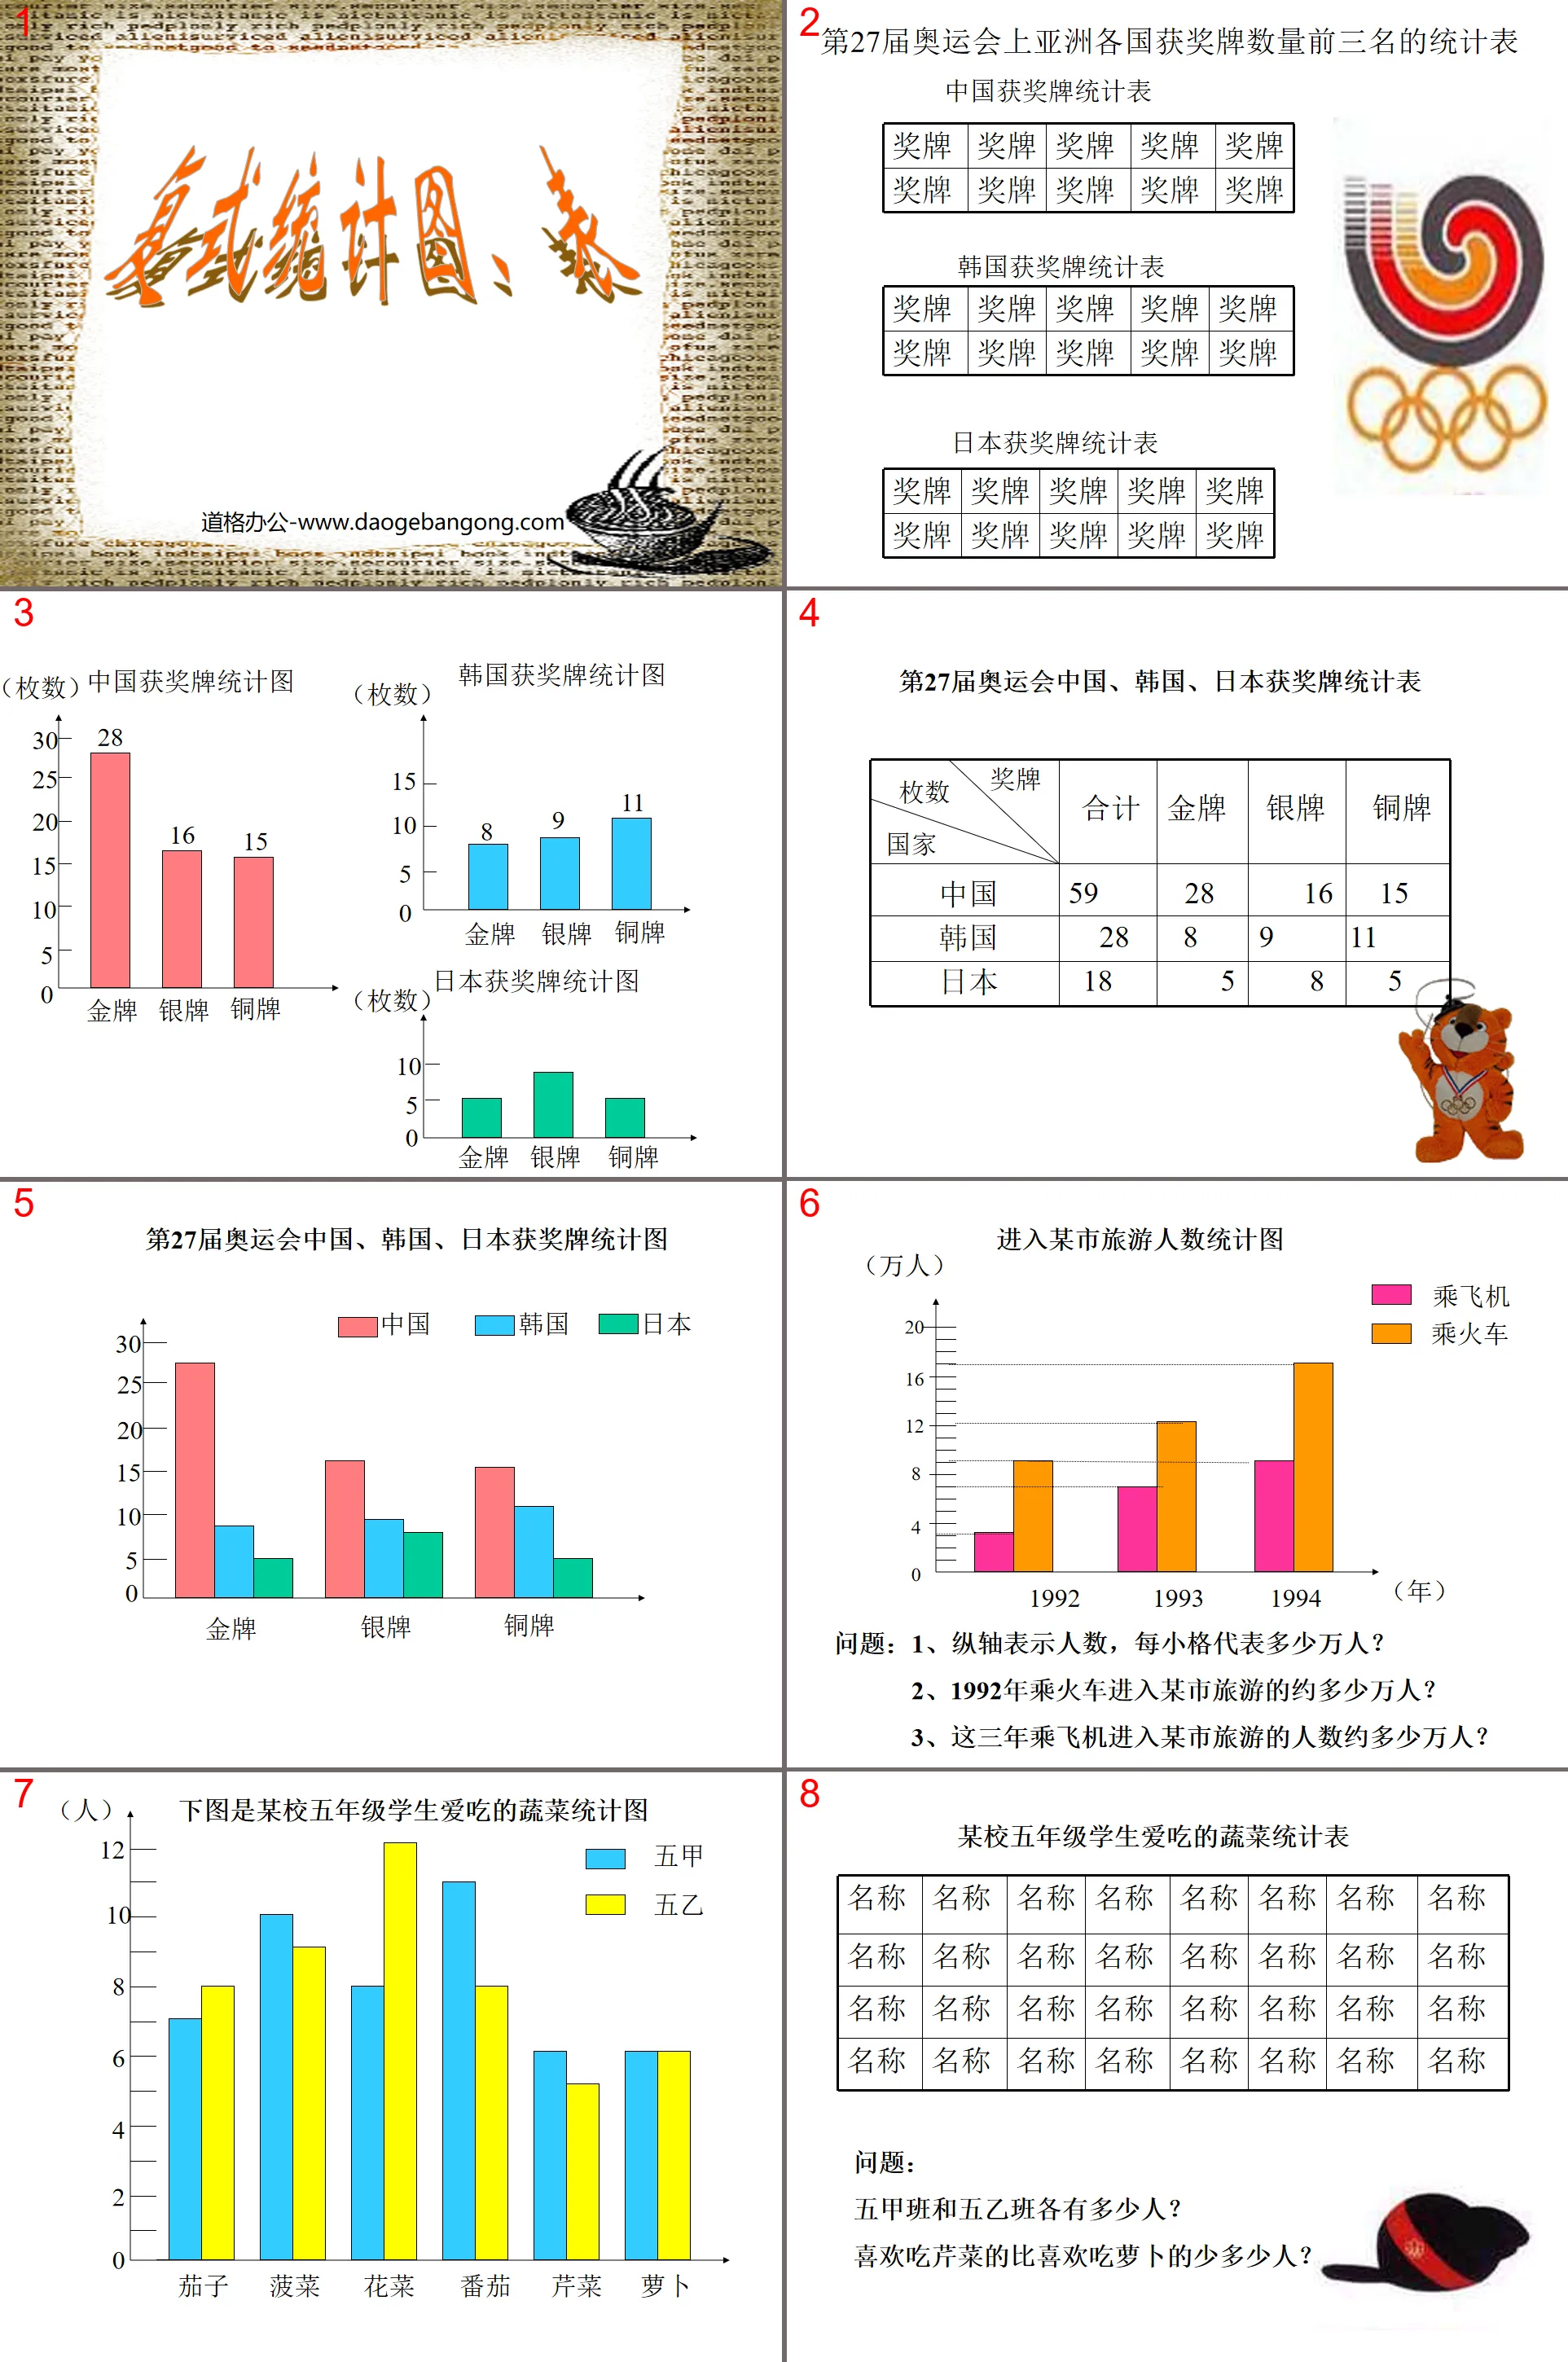
"Complex Statistical Chart" Statistics PPT Courseware
Statistical table of the top three Asian countries in medals won at the 27th Olympic Games
Question: 1. The vertical axis represents the number of people. How many thousand people does each small grid represent?
2. How many thousand people entered a certain city by train in 1992?
3. Approximately how many thousand people have traveled to a certain city by air in the past three years?
question:
How many people are there in Class 5A and Class 5B?
How many fewer people like to eat celery than like to eat radishes?
Keywords: statistics courseware, compound statistical chart courseware, New People's Education Edition sixth grade mathematics PPT courseware, second volume, sixth grade mathematics slide courseware download, statistics PPT courseware download, compound statistical chart PPT courseware download, .ppt format
For more information about the "Statistical Double Entry Statistical Chart" PPT courseware, please click the Statistics ppt Double Entry Statistical Chart ppt tab.
File Info
Update Time: 2024-11-18
This template belongs to Mathematics courseware People's Education Press Mathematics Volume 2 for Sixth Grade industry PPT template
"Complex Statistical Chart" Statistics PPT Courseware Simple campus recruitment activity planning plan summary enterprise and institution recruitment publicity lecture PPT template is a general PPT template for business post competition provided by the manuscript PPT, simple campus recruitment activity planning plan summary enterprise and institution recruitment promotion Lecture PPT template, you can edit and modify the text and pictures in the source file by downloading the source file. If you want more exquisite business PPT templates, you can come to grid resource. Doug resource PPT, massive PPT template slide material download, we only make high-quality PPT templates!
Tips: If you open the template and feel that it is not suitable for all your needs, you can search for related content "Complex Statistical Chart" Statistics PPT Courseware is enough.
How to use the Windows system template
Directly decompress the file and use it with office or wps
How to use the Mac system template
Directly decompress the file and use it Office or wps can be used
Related reading
For more detailed PPT-related tutorials and font tutorials, you can view: Click to see
How to create a high-quality technological sense PPT? 4 ways to share the bottom of the box
Notice
Do not download in WeChat, Zhihu, QQ, built-in browsers, please use mobile browsers to download! If you are a mobile phone user, please download it on your computer!
1. The manuscript PPT is only for study and reference, please delete it 24 hours after downloading.
2. If the resource involves your legitimate rights and interests, delete it immediately.
3. Contact information: service@daogebangong.com
"Complex Statistical Chart" Statistics PPT Courseware, due to usage restrictions, it is only for personal study and reference use. For commercial use, please go to the relevant official website for authorization.
(Personal non-commercial use refers to the use of this font to complete the display of personal works, including but not limited to the design of personal papers, resumes, etc.)
Preview
Related Search:
"Complex Statistical Chart" Statistics PPT Courseware
2024-11-18
Copyright statement: This material is compiled and released by the user of Daoge Resources. The copyright belongs to the author. For commercial use, please contact the copyright owner. If there is any infringement, please contact the webmaster to remove the resource.
Download Points: 0.00
Free Download
Upgrade VIP
Favorite
Views: 3562 / Downloads: 295


