
"Complex Bar Chart" Average and Bar Chart PPT Simple campus recruitment activity planning plan summary enterprise and institution recruitment publicity lecture PPT template is a general PPT template for business post competition provided by the manuscript PPT, simple campus recruitment activity planning plan summary enterprise and institution recruitment promotion Lecture PPT template, you can edit and modify the text and pictures in the source file by downloading the source file. If you want more exquisite business PPT templates, you can come to grid resource. Doug resource PPT, massive PPT template slide material download, we only make high-quality PPT templates!
| 文件名 如何下载使用 | 下载次数 | Download Points | 下载地址 |
|---|---|---|---|
| "Complex Bar Chart" Aver... | 8950次 | 0.00 | Free Download |
Tips: If you open the template and feel that it is not suitable for all your needs, you can search for related content "Complex Bar Chart" Average and Bar Chart PPT is enough.
How to use the Windows system template
Directly decompress the file and use it with office or wps
How to use the Mac system template
Directly decompress the file and use it Office or wps can be used
Related reading
For more detailed PPT-related tutorials and font tutorials, you can view: Click to see
How to create a high-quality technological sense PPT? 4 ways to share the bottom of the box
Notice
Do not download in WeChat, Zhihu, QQ, built-in browsers, please use mobile browsers to download! If you are a mobile phone user, please download it on your computer!
1. The manuscript PPT is only for study and reference, please delete it 24 hours after downloading.
2. If the resource involves your legitimate rights and interests, delete it immediately.
3. Contact information: service@daogebangong.com
"Complex Bar Chart" Average and Bar Chart PPT, due to usage restrictions, it is only for personal study and reference use. For commercial use, please go to the relevant official website for authorization.
(Personal non-commercial use refers to the use of this font to complete the display of personal works, including but not limited to the design of personal papers, resumes, etc.)
Related reading
For more detailed PPT-related tutorials and font tutorials, you can view:Please click to see


Authoritative PPT Summary
"Complex Bar Chart" Average and Bar Chart PPT
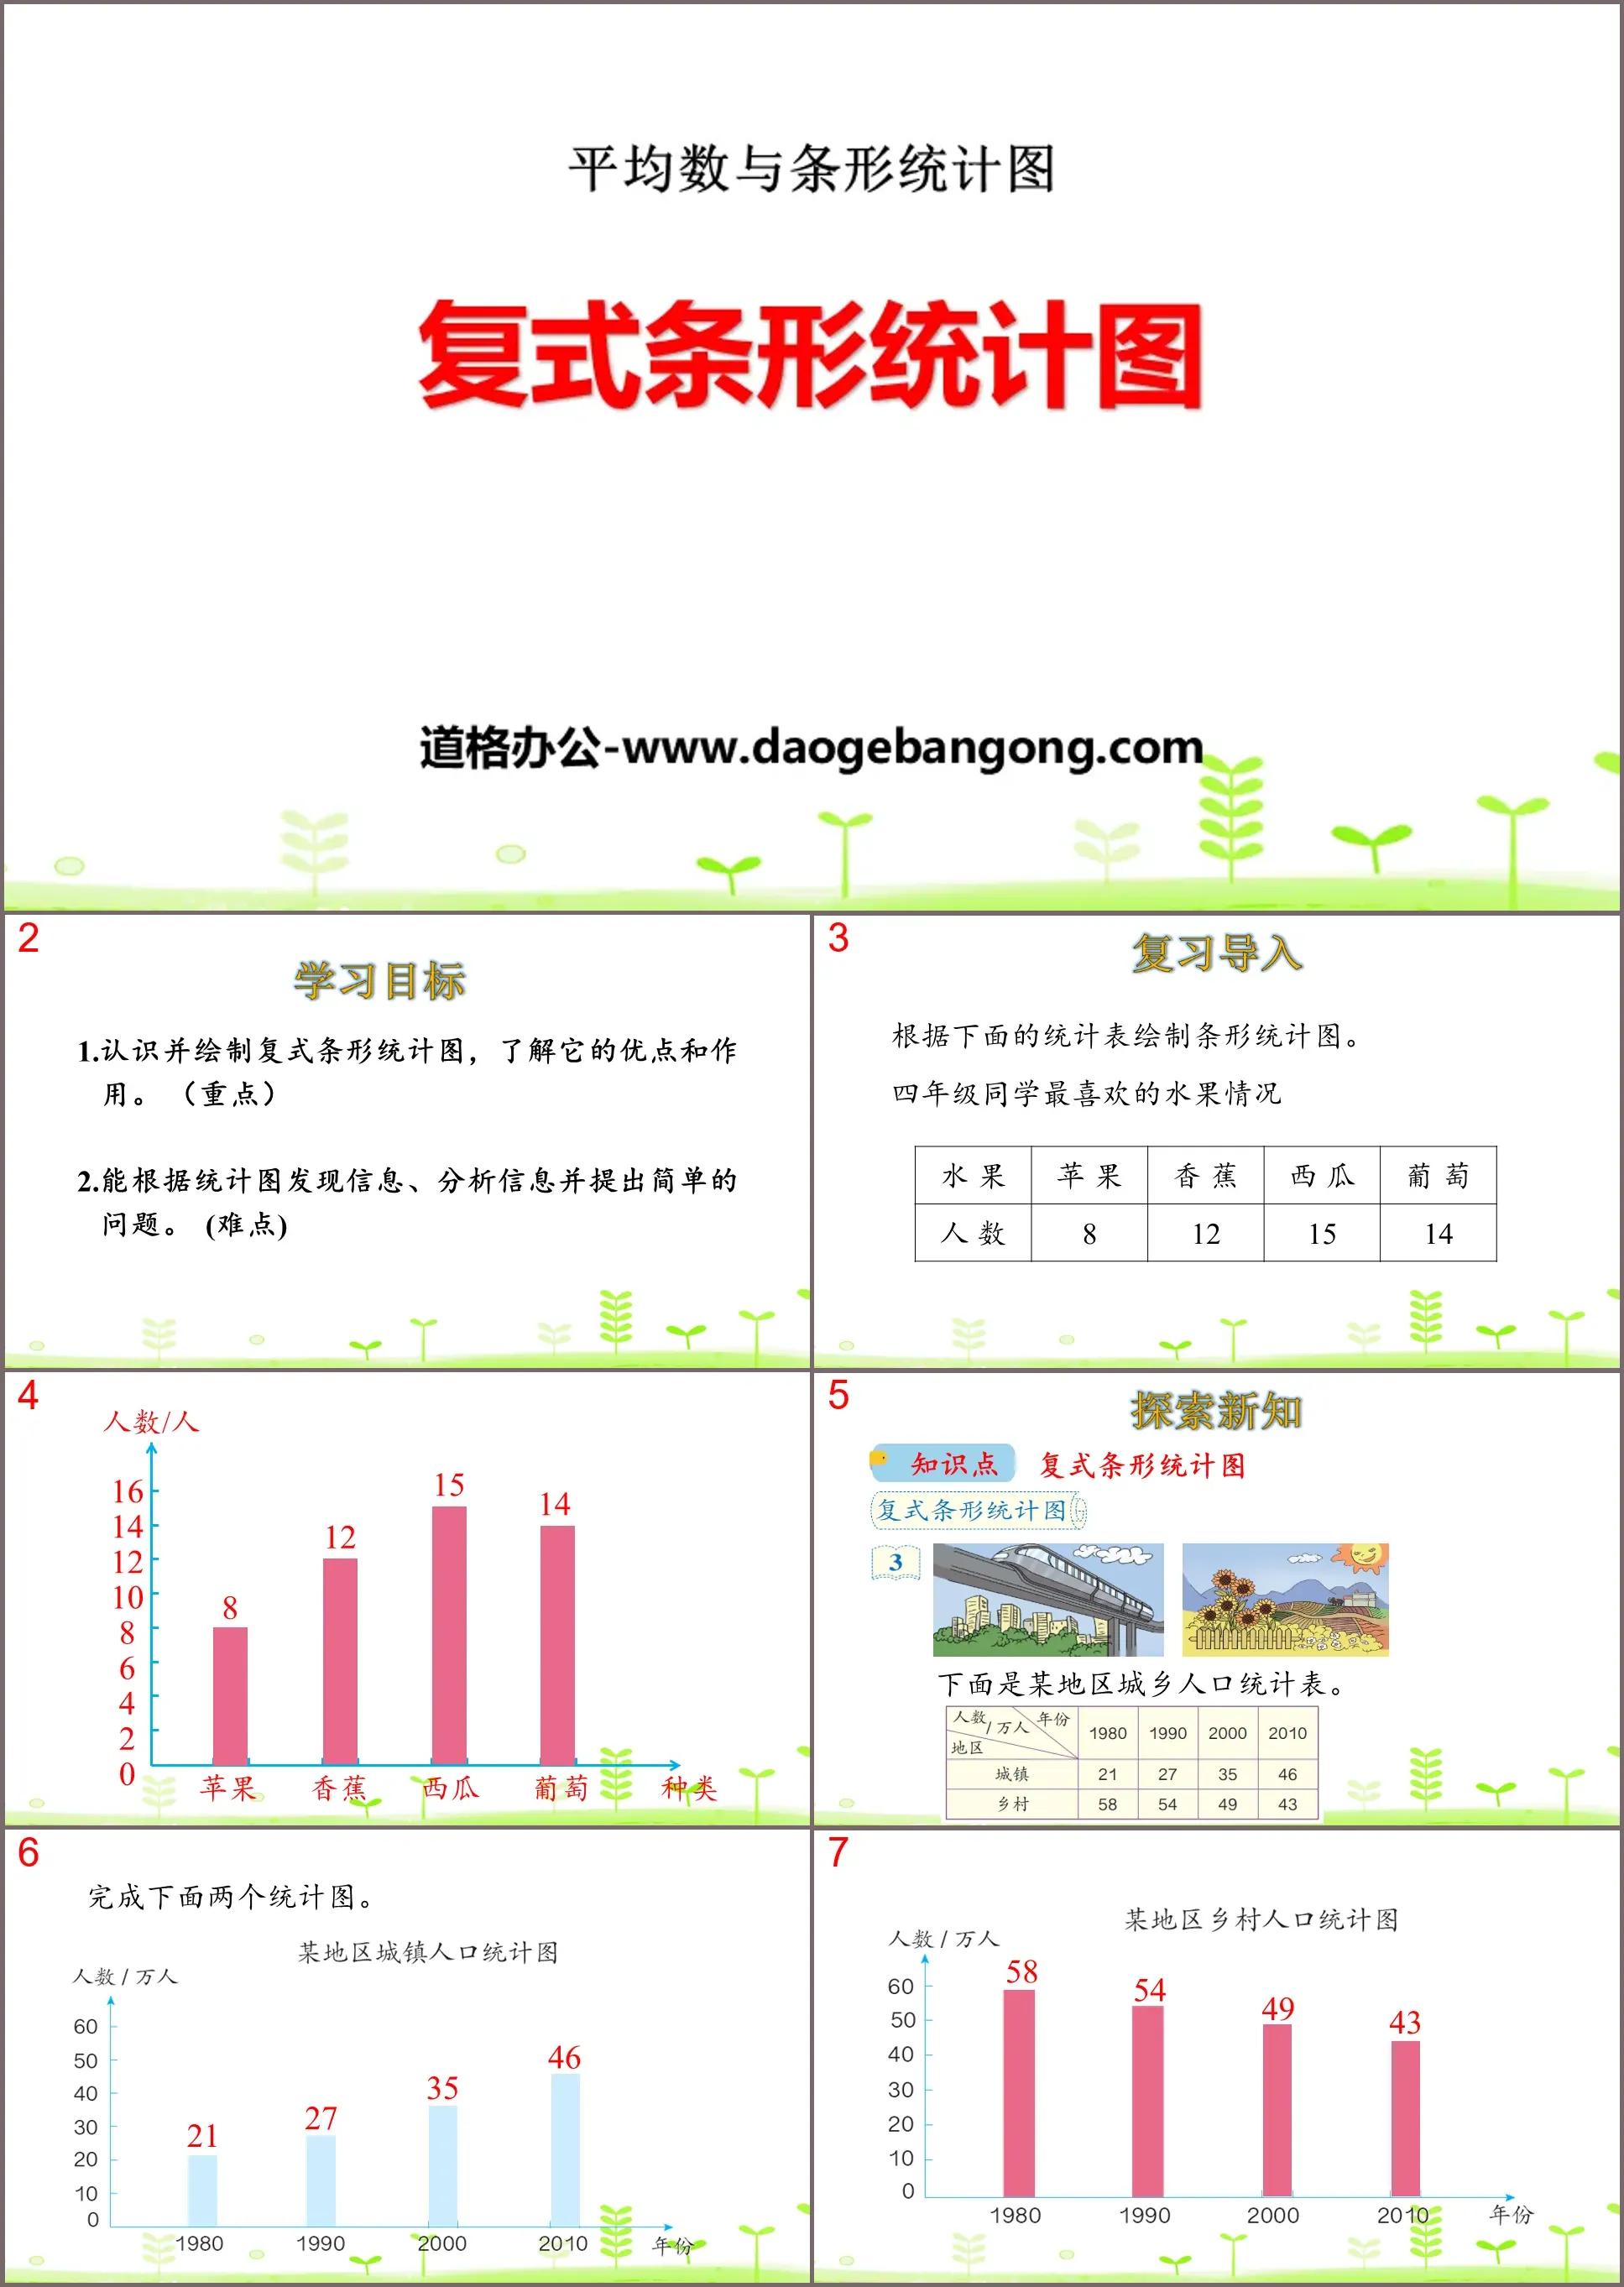
Part One: Learning Objectives
1. Understand and draw compound bar charts, and understand its advantages and functions. (emphasis)
2. Able to discover information, analyze information and ask simple questions based on statistical charts. (difficulty)
Compound bar chart PPT, part 2: exploring new knowledge
Knowledge Points Complex Bar Chart
Complete the following two statistical graphs.
It is inconvenient to observe.
How to simply and clearly compare the changes in the number of people in urban and rural areas in the same year?
It would be fine if the two pictures could be combined.
What is the difference between it and a single bar chart?
A single bar chart is used to compare one object, and a compound bar chart is used to compare the quantities of a larger number of objects.
Please answer the following questions based on the statistical chart:
1. Which year has the largest urban population?
year 2010
Which year has the least?
in 1980
2. In which year did the rural population have the largest number?
in 1980
Which year has the least?
year 2010
3. In which year was the largest difference in population between urban and rural areas?
in 1980
Which year is the youngest?
year 2010
4. What other information can you get?
Example: In recent years, the urban population in this region has been increasing, the rural population has been declining, the total population has gradually increased, and the difference in the number of urban and rural populations has been decreasing year by year.
Knowledge refining
1. The compound bar chart is basically the same as the single bar chart, except that there are two (or more) data in each group, and two (or more) different colors (or shading) need to be used. Represented by straight bars, and a legend must be noted.
2. The compound bar chart can not only clearly see the quantities of various quantities, but also clearly compare the quantities of two (or several) people or things.
Compound bar chart PPT, Part 3: Consolidation exercises
1. The standing long jump results of the fourth grade students of Yumin Primary School are as follows.
Please make a compound bar chart based on the above data.
(1) Girls whose scores are below 1.41m are considered failing, boys whose scores are below 1.48m are failed. There are 5 boys whose scores are between 1.42m and 1.48m. How many boys and girls failed the test?
There are 5 girls who failed, and 5 + 2 = 7 (people) boys who failed.
(2) What other information can you get?
Example: Most boys and girls have standing long jump scores between 1.52 and 1.61m. There are 5 fewer boys than girls with standing long jump scores between 1.42 and 1.51m. Boys have standing long jump scores above 1.72m (including 1.72m). There are 6 more people than girls...
2. The per capita housing area of urban and rural residents in a certain area is as shown below.
(1) What information can you get?
Example: For both urban and rural residents, the per capita housing area has been increasing between 2008 and 2012; the per capita housing area in rural areas is larger than the per capita housing area in urban areas every year.
(2) Investigate the per capita housing area of the families of the students in this class and create a bar chart based on the data of the students in the group.
Ask the students to do it themselves.
Compound bar chart PPT, Part 4 content: Class summary
What knowledge have you learned in this class?
1. The compound bar chart is basically the same as the single bar chart, except that there are two (or more) data in each group, and two (or more) different colors (or shading) need to be used. Represented by straight bars, and a legend must be noted.
2. The compound bar chart can not only clearly see the quantities of various quantities, but also clearly compare the quantities of two (or several) people or things.
Compound bar chart PPT, Part 5: Homework
Assignment 1: Complete the exercises related to the textbook.
Assignment 2: Complete the corresponding exercises.
Keywords: Free download of PPT courseware for mathematics in the second volume of the fourth grade of the People's Education Press, download of compound bar chart PPT, download of average and bar chart PPT, .PPT format;
For more information about the PPT courseware "Complex Bar Chart Average and Bar Chart", please click the Compound Bar Chart PPT Average and Bar Chart PPT tab.
"Complex Bar Chart" Data Representation and Analysis PPT Teaching Courseware:
"Complex Bar Chart" Data Representation and Analysis PPT Teaching Courseware Part One: Learning Objectives 1. Through the pitching game, understand the compound bar chart and understand the characteristics of the compound bar chart. 2. Able to obtain as much information as possible from statistical charts and experience...
"Complex Bar Chart" Data Representation and Analysis PPT Download:
"Complex Bar Statistical Chart" Data Representation and Analysis PPT Download Part One Content: Scenario Introduction In physical education class, the teacher organized students to conduct shooting training, but the students encountered difficulties at the beginning of the practice. Some students shot with one hand. , some students use their hands...
"Complex Bar Chart" Data Representation and Analysis PPT:
"Complex Bar Chart" Data Representation and Analysis PPT Part One: Learning Objectives 1. Understand the compound bar chart and understand the characteristics of the compound bar chart. (Key points) 2. Be able to use the information in the compound bar chart to solve problems, and be able to draw complex...