Beijing Normal University Edition Seventh Grade Mathematics Volume 1
Western Normal University Edition First Grade Mathematics Volume 1
People's Education Press First Grade Mathematics Volume 1
People's Education Press Second Grade Mathematics Volume 1
Beijing Normal University Edition Seventh Grade Mathematics Volume 2
People's Education Press Third Grade Mathematics Volume 1
Beijing Normal University Edition Eighth Grade Mathematics Volume 1
Qingdao Edition Seventh Grade Mathematics Volume 1
Beijing Normal University Edition Fifth Grade Mathematics Volume 1
Hebei Education Edition Third Grade Mathematics Volume 1
Hebei Education Edition Seventh Grade Mathematics Volume 2
People's Education Press First Grade Mathematics Volume 2
Qingdao Edition Seventh Grade Mathematics Volume 2
People's Education High School Mathematics Edition B Compulsory Course 2
Beijing Normal University Edition Fifth Grade Mathematics Volume 2
Hebei Education Edition Fourth Grade Mathematics Volume 2

| Category | Format | Size |
|---|---|---|
| People's Education Press Fourth Grade Mathematics Volume 2 | pptx | 6 MB |

"Complex Bar Chart" Average and Bar Chart PPT Courseware
2024-11-25
Copyright statement: This material is compiled and released by the user of Daoge Resources. The copyright belongs to the author. For commercial use, please contact the copyright owner. If there is any infringement, please contact the webmaster to remove the resource.
Download Points: 0.00
Free Download
Upgrade VIP
Favorite
Views: 4908 / Downloads: 559
Description
"Complex Bar Chart" Average and Bar Chart PPT Courseware
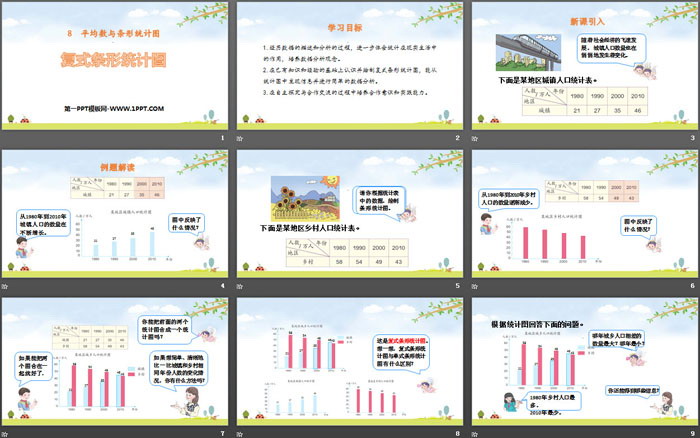
Part One: Learning Objectives
1. Experience the process of data description and analysis, further understand the role of statistics in real life, and cultivate data analysis concepts.
2. Understand and draw compound bar charts based on existing knowledge and experience, and be able to discover information from statistical charts and conduct simple data analysis.
3. Cultivate a sense of cooperation and practical abilities in the process of independent inquiry and cooperative communication.
Compound bar chart PPT, part 2 content: introduction of new lesson
With the rapid development of social economy, the urban population is also quietly changing.
Interpretation of examples
From 1980 to 2010, the urban population continued to grow.
What situation is reflected in the picture?
Please draw a bar graph based on the data in the statistical table.
From 1980 to 2010, the number of rural people gradually decreased.
What situation is reflected in the picture?
It would be nice if the two pictures could be combined.
Can you combine the previous two statistical charts into one statistical chart?
If you want to simply and clearly compare the changes in the number of people in urban and rural areas in the same year, do you have any method?
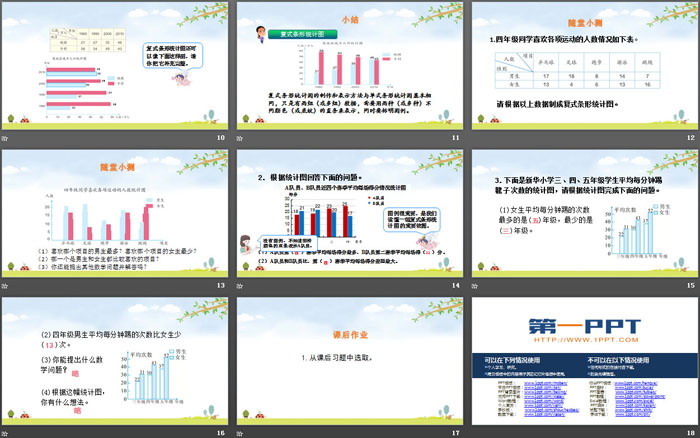
Compound bar chart PPT, the third part: summary
compound bar chart
The preparation and presentation method of a compound bar chart is basically the same as that of a single bar chart, except that there are two (or more) sets of data, and two (or more) straight bars of different colors (or shading) need to be used. to represent it, and a legend must be indicated at the same time.
Compound bar chart PPT, part 4: quiz in class
1. The number of fourth-grade students who like various sports is as follows.
Please make a compound bar chart based on the above data.
(1) Which project do boys like the most? Which project do girls like the least?
(2) Which project is more popular among boys and girls?
(3) Can you ask and answer other mathematical questions?
2. Answer the following questions based on the statistical graph.
(1) Player A averages the most points per game in season ( ), and player B averages ( ) points per game in the second season.
(2) Compared with team member A and team B, the difference in average points per game in season ( ) is the largest.
3. The following is a statistical chart of the average number of shuttlecock kicks per minute for students in the third, fourth and fifth grades of Xinhua Primary School. Please complete the following questions based on the statistical chart.
(1) The most average number of kicks per minute for girls is in ( ) grade, and the least is in ( ) grade.
(2) The average number of kicks per minute for boys in fourth grade is ( ) less than that of girls.
(3) What mathematical questions can you ask?
(4) Based on this statistical chart, what do you think?
Compound bar chart PPT, Part 5: Homework
1. Choose from the after-school exercises.
Keywords: Free download of PPT courseware for mathematics in the second volume of the fourth grade of the People's Education Press, download of compound bar chart PPT, download of average and bar chart PPT, .PPT format;
For more information about the PPT courseware "Complex Bar Chart Average and Bar Chart", please click the Compound Bar Chart PPT Average and Bar Chart PPT tab.
"Complex Bar Chart" Data Representation and Analysis PPT Teaching Courseware:
"Complex Bar Chart" Data Representation and Analysis PPT Teaching Courseware Part One: Learning Objectives 1. Through the pitching game, understand the compound bar chart and understand the characteristics of the compound bar chart. 2. Able to obtain as much information as possible from statistical charts and experience...
"Complex Bar Chart" Data Representation and Analysis PPT Download:
"Complex Bar Statistical Chart" Data Representation and Analysis PPT Download Part One Content: Scenario Introduction In physical education class, the teacher organized students to conduct shooting training, but the students encountered difficulties at the beginning of the practice. Some students shot with one hand. , some students use their hands...
"Complex Bar Chart" Data Representation and Analysis PPT:
"Complex Bar Chart" Data Representation and Analysis PPT Part One: Learning Objectives 1. Understand the compound bar chart and understand the characteristics of the compound bar chart. (Key points) 2. Be able to use the information in the compound bar chart to solve problems, and be able to draw complex...
File Info
Update Time: 2024-11-25
This template belongs to Mathematics courseware People's Education Press Fourth Grade Mathematics Volume 2 industry PPT template
"Complex Bar Chart" Average and Bar Chart PPT Courseware Simple campus recruitment activity planning plan summary enterprise and institution recruitment publicity lecture PPT template is a general PPT template for business post competition provided by the manuscript PPT, simple campus recruitment activity planning plan summary enterprise and institution recruitment promotion Lecture PPT template, you can edit and modify the text and pictures in the source file by downloading the source file. If you want more exquisite business PPT templates, you can come to grid resource. Doug resource PPT, massive PPT template slide material download, we only make high-quality PPT templates!
Tips: If you open the template and feel that it is not suitable for all your needs, you can search for related content "Complex Bar Chart" Average and Bar Chart PPT Courseware is enough.
How to use the Windows system template
Directly decompress the file and use it with office or wps
How to use the Mac system template
Directly decompress the file and use it Office or wps can be used
Related reading
For more detailed PPT-related tutorials and font tutorials, you can view: Click to see
How to create a high-quality technological sense PPT? 4 ways to share the bottom of the box
Notice
Do not download in WeChat, Zhihu, QQ, built-in browsers, please use mobile browsers to download! If you are a mobile phone user, please download it on your computer!
1. The manuscript PPT is only for study and reference, please delete it 24 hours after downloading.
2. If the resource involves your legitimate rights and interests, delete it immediately.
3. Contact information: service@daogebangong.com
"Complex Bar Chart" Average and Bar Chart PPT Courseware, due to usage restrictions, it is only for personal study and reference use. For commercial use, please go to the relevant official website for authorization.
(Personal non-commercial use refers to the use of this font to complete the display of personal works, including but not limited to the design of personal papers, resumes, etc.)
Preview
Related Search:
"Complex Bar Chart" Average and Bar Chart PPT Courseware
2024-11-25
Copyright statement: This material is compiled and released by the user of Daoge Resources. The copyright belongs to the author. For commercial use, please contact the copyright owner. If there is any infringement, please contact the webmaster to remove the resource.
Download Points: 0.00
Free Download
Upgrade VIP
Favorite
Views: 4908 / Downloads: 559


