Western Normal University Edition First Grade Mathematics Volume 1
Beijing Normal University Edition Seventh Grade Mathematics Volume 1
People's Education Press First Grade Mathematics Volume 1
People's Education Press Second Grade Mathematics Volume 1
People's Education Press Third Grade Mathematics Volume 1
Beijing Normal University Edition Seventh Grade Mathematics Volume 2
Beijing Normal University Edition Eighth Grade Mathematics Volume 1
Qingdao Edition Seventh Grade Mathematics Volume 1
Beijing Normal University Edition Fifth Grade Mathematics Volume 1
Hebei Education Edition Third Grade Mathematics Volume 1
Hebei Education Edition Seventh Grade Mathematics Volume 2
People's Education High School Mathematics Edition B Compulsory Course 2
Hebei Education Edition Fourth Grade Mathematics Volume 2
Beijing Normal University Edition Fifth Grade Mathematics Volume 2
People's Education Press First Grade Mathematics Volume 2
Qingdao Edition Seventh Grade Mathematics Volume 2

| Category | Format | Size |
|---|---|---|
| Hebei Education Edition Sixth Grade Mathematics Volume 1 | pptx | 6 MB |

"Choose the appropriate statistical chart to represent data" sector statistical chart PPT courseware
2024-10-18
Copyright statement: This material is compiled and released by the user of Daoge Resources. The copyright belongs to the author. For commercial use, please contact the copyright owner. If there is any infringement, please contact the webmaster to remove the resource.
Download Points: 0.00
Free Download
Upgrade VIP
Favorite
Views: 1128 / Downloads: 945
Description
"Choose the appropriate statistical chart to represent data" sector statistical chart PPT courseware
teaching objectives
1. Combined with specific examples, experience the process of selecting statistical charts, discussing the characteristics of statistical charts, and using statistical charts to represent data intuitively and effectively.
2. Able to select appropriate statistical charts to represent data intuitively and effectively as needed.
3. Further understand the role of different statistical charts in representing data, and realize the value of learning various statistical charts.
Talk about it
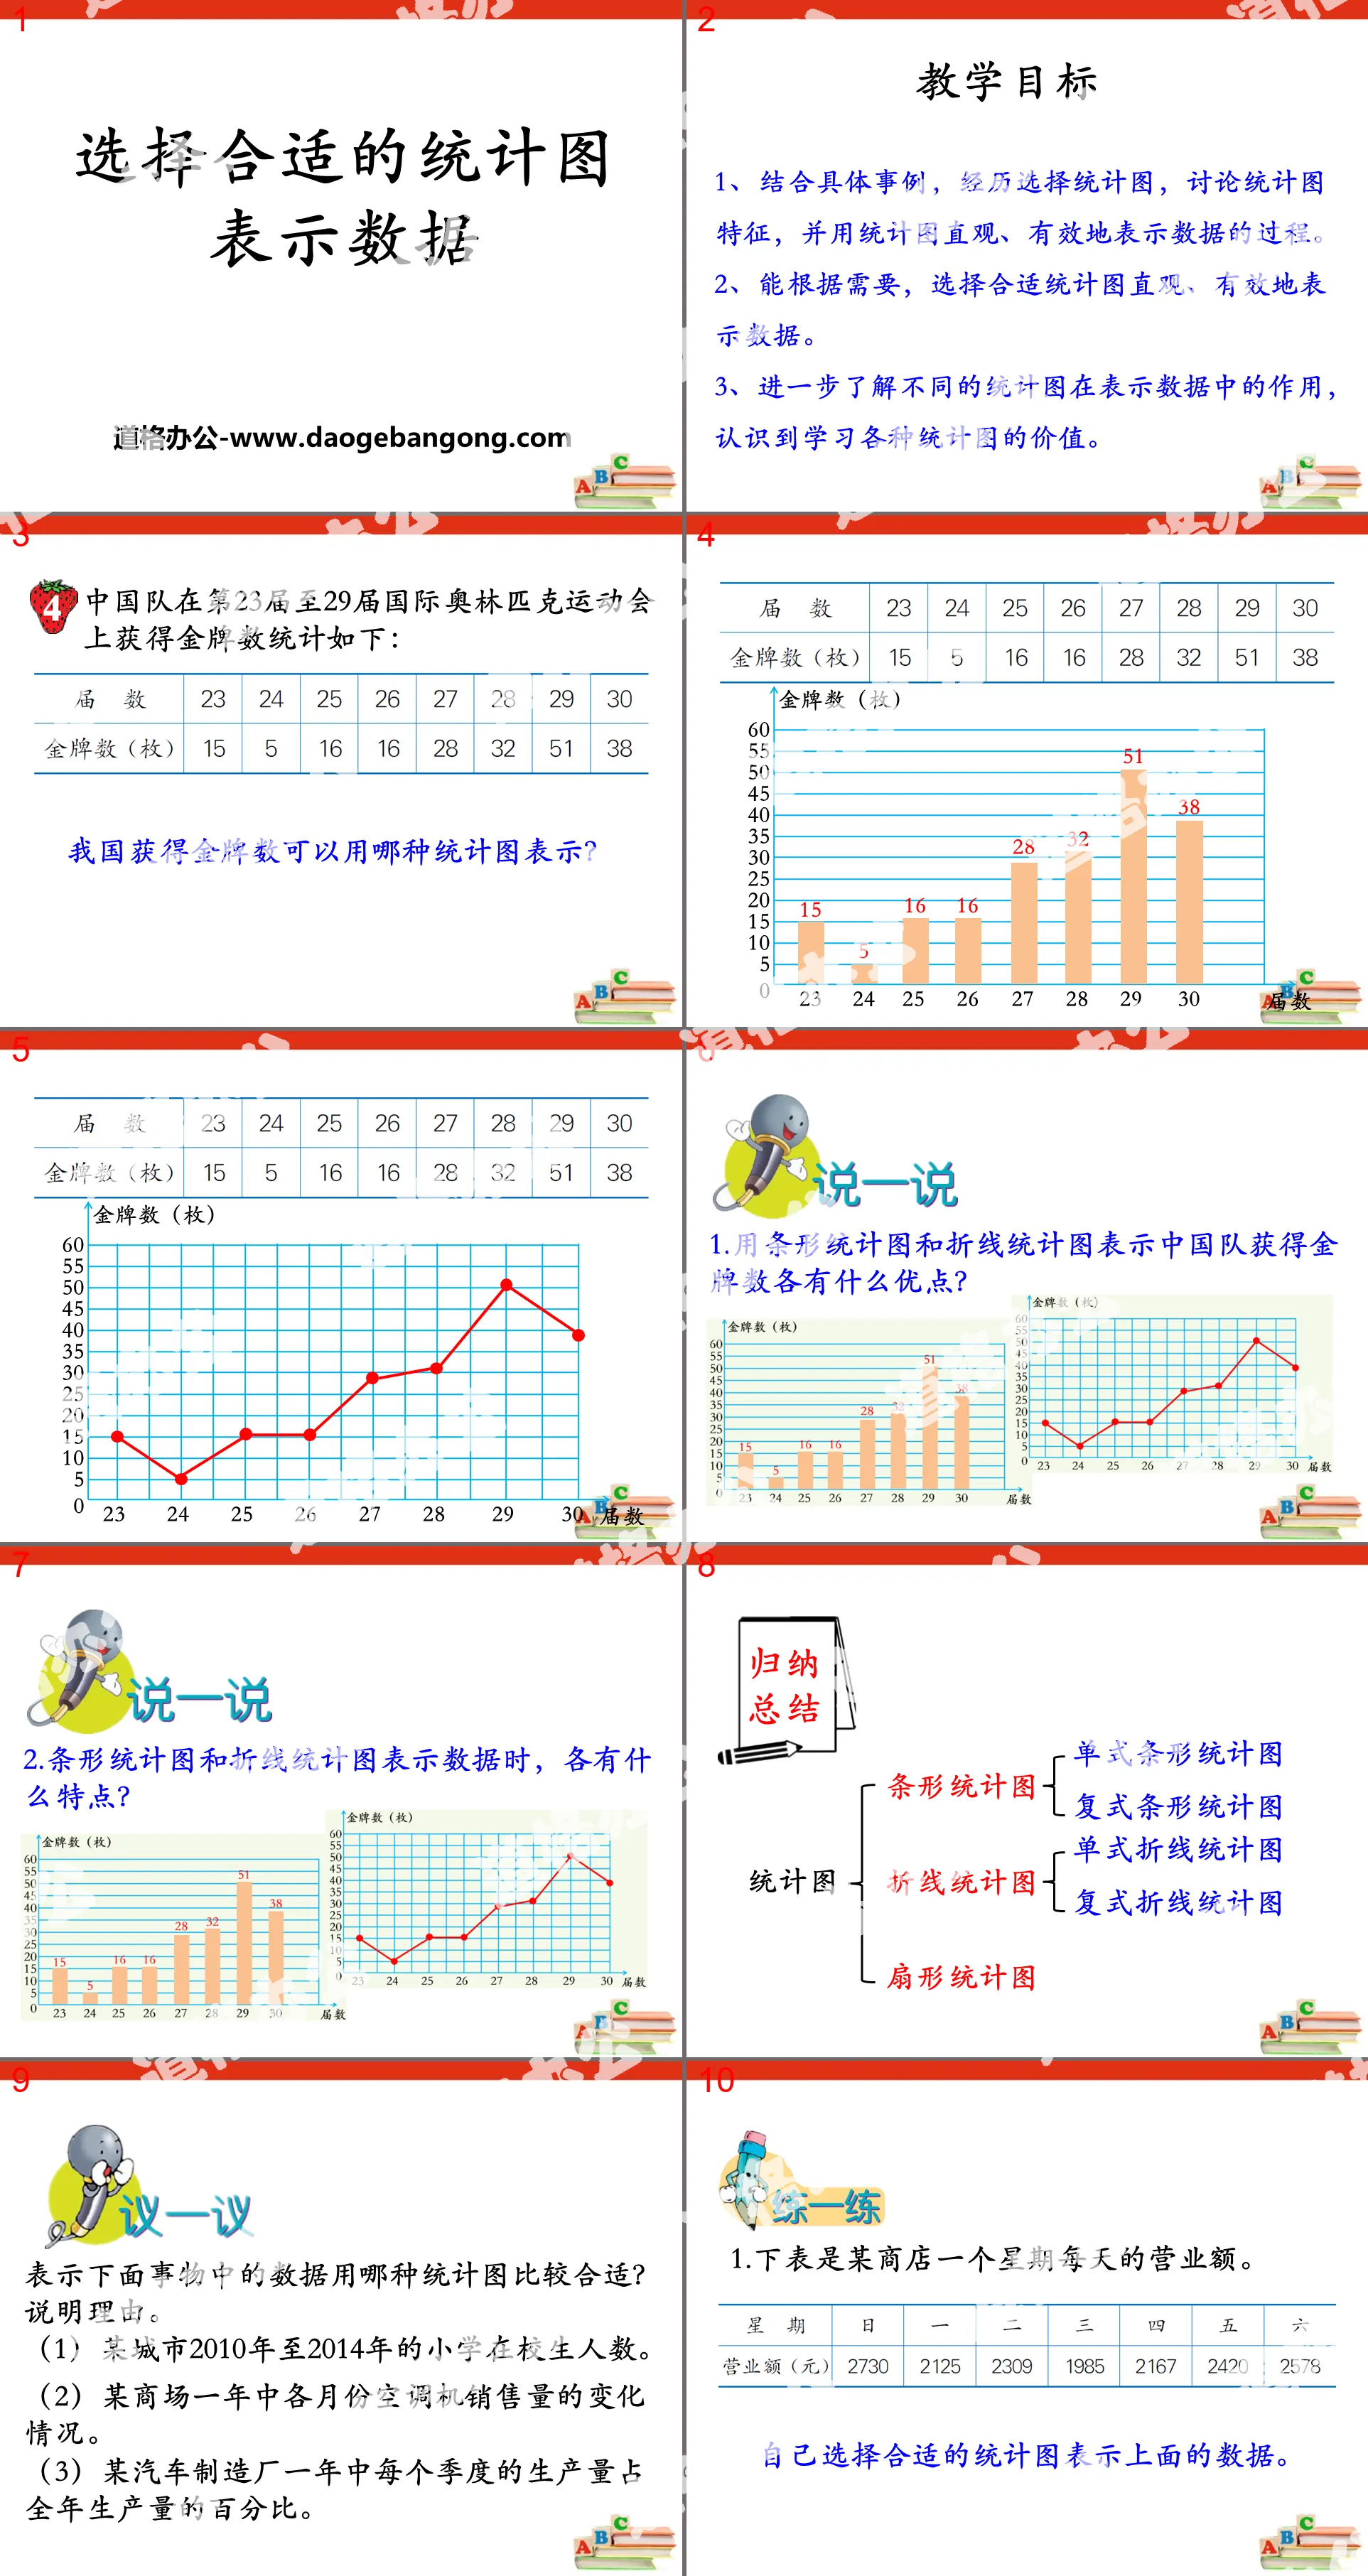
1. What are the advantages of using bar charts and line charts to express the number of gold medals won by the Chinese team?
2. What are the characteristics of bar charts and line charts when representing data?
In conclusion
summary graph
bar chart
single bar chart
compound bar chart
Line chart
Single line chart
Compound line chart
fan chart
Discuss
Which statistical chart is more appropriate to use to represent the data in the following things? Give reasons.
(1) The number of primary school students in a certain city from 2010 to 2014.
(2) Changes in air conditioner sales volume in a certain shopping mall in each month of the year.
(3) The production volume of each quarter of a year accounts for the percentage of the annual production volume of a certain automobile manufacturing plant.
practice
1. The following table shows the daily turnover of a certain store for a week.
Choose the appropriate statistical chart to represent the above data.
2. The table below is the record of a food factory producing 50g packaged ham in the first half of 2012.
Keywords: sector chart teaching courseware, choose the appropriate statistical chart to represent data teaching courseware, Hebei Education Edition sixth grade mathematics PPT courseware download, sixth grade mathematics slide courseware download, fan chart PPT courseware download, choose the appropriate statistical chart Indicates data PPT courseware download, .PPT format;
For more information about the PPT courseware "Choose the appropriate statistical chart to represent the data in the sector chart ppt", please click the "Choose the appropriate statistical chart to represent the data in the sector chart ppt" tag.
File Info
Update Time: 2024-10-18
This template belongs to Mathematics courseware Hebei Education Edition Sixth Grade Mathematics Volume 1 industry PPT template
"Choose the appropriate statistical chart to represent data" sector statistical chart PPT courseware Simple campus recruitment activity planning plan summary enterprise and institution recruitment publicity lecture PPT template is a general PPT template for business post competition provided by the manuscript PPT, simple campus recruitment activity planning plan summary enterprise and institution recruitment promotion Lecture PPT template, you can edit and modify the text and pictures in the source file by downloading the source file. If you want more exquisite business PPT templates, you can come to grid resource. Doug resource PPT, massive PPT template slide material download, we only make high-quality PPT templates!
Tips: If you open the template and feel that it is not suitable for all your needs, you can search for related content "Choose the appropriate statistical chart to represent data" sector statistical chart PPT courseware is enough.
How to use the Windows system template
Directly decompress the file and use it with office or wps
How to use the Mac system template
Directly decompress the file and use it Office or wps can be used
Related reading
For more detailed PPT-related tutorials and font tutorials, you can view: Click to see
How to create a high-quality technological sense PPT? 4 ways to share the bottom of the box
Notice
Do not download in WeChat, Zhihu, QQ, built-in browsers, please use mobile browsers to download! If you are a mobile phone user, please download it on your computer!
1. The manuscript PPT is only for study and reference, please delete it 24 hours after downloading.
2. If the resource involves your legitimate rights and interests, delete it immediately.
3. Contact information: service@daogebangong.com
"Choose the appropriate statistical chart to represent data" sector statistical chart PPT courseware, due to usage restrictions, it is only for personal study and reference use. For commercial use, please go to the relevant official website for authorization.
(Personal non-commercial use refers to the use of this font to complete the display of personal works, including but not limited to the design of personal papers, resumes, etc.)
Preview
Related Search:
"Choose the appropriate statistical chart to represent data" sector statistical chart PPT courseware
2024-10-18
Copyright statement: This material is compiled and released by the user of Daoge Resources. The copyright belongs to the author. For commercial use, please contact the copyright owner. If there is any infringement, please contact the webmaster to remove the resource.
Download Points: 0.00
Free Download
Upgrade VIP
Favorite
Views: 1128 / Downloads: 945


