Business Planet Edition 7th Grade Geography Volume 1
People's Education Edition Geography for Seventh Grade Volume 2
Business Planet Edition 7th Grade Geography Volume 2
Business Planet Edition Geography for Grade 8 Volume 1
People's Education Edition Geography for Eighth Grade Volume 2
Hunan Education Edition High School Geography Compulsory Course I
Shanghai Education Edition Seventh Grade Geography Volume 1
People's Education Edition Geography for Grade 8 Volume 1
Compulsory Course 1 of High School Geography in China Graphics Edition
People's Education Edition Geography for Grade 7 Volume 1
Lu Ke version of high school geography compulsory course I
Shanghai Education Edition Geography for Sixth Graders Volume 1
People's Education Press High School Geography Compulsory Course 1
Hunan Education Edition High School Geography Compulsory Course II
Business Planet Edition Geography for Eighth Grade Volume 2
Shanghai Education Edition Seventh Grade Geography Volume 2

| Category | Format | Size |
|---|---|---|
| People's Education Edition Geography for Grade 7 Volume 1 | pptx | 6 MB |

"Changes and Distribution of Temperature" Weather and Climate PPT Courseware 6
2024-11-24
Copyright statement: This material is compiled and released by the user of Daoge Resources. The copyright belongs to the author. For commercial use, please contact the copyright owner. If there is any infringement, please contact the webmaster to remove the resource.
Download Points: 0.00
Free Download
Upgrade VIP
Favorite
Views: 3954 / Downloads: 81
Description
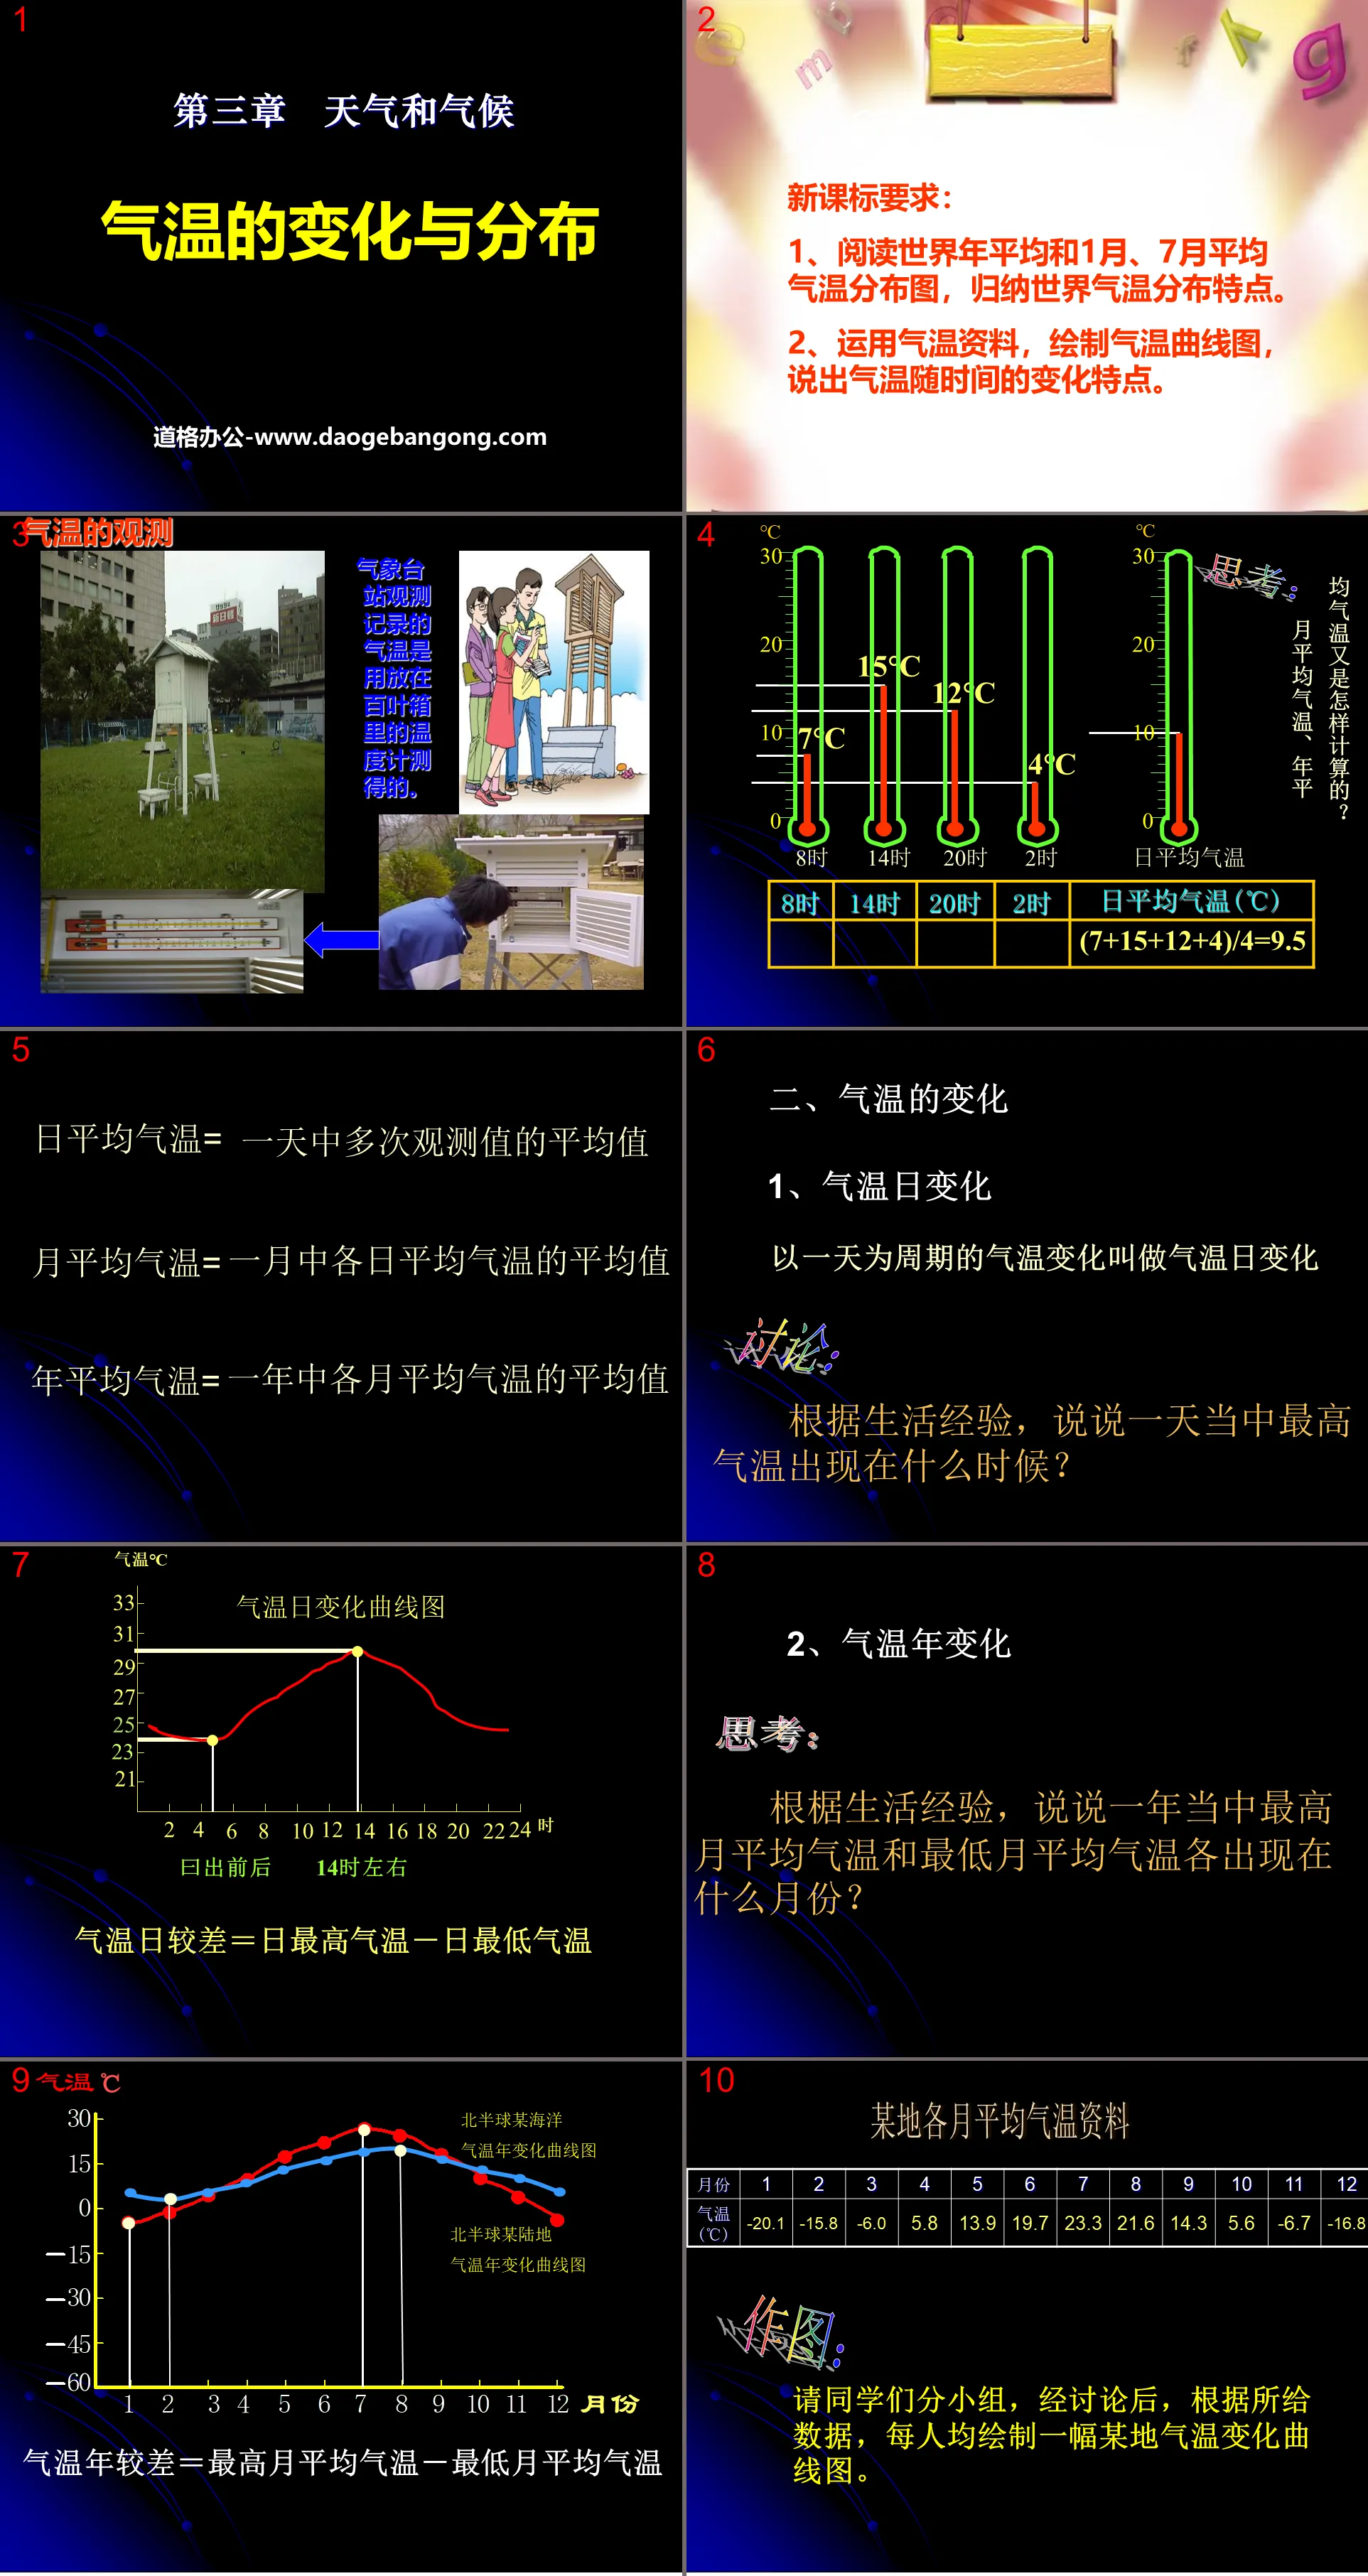
"Changes and Distribution of Temperature" Weather and Climate PPT Courseware 6
New course standard requirements:
1. Read the world annual average and January and July average temperature distribution maps, and summarize the world temperature distribution characteristics.
2. Use temperature data to draw a temperature curve and describe the changing characteristics of temperature over time.
Daily average temperature = average of multiple observations in a day
Monthly average temperature = average daily temperature in January
Annual mean temperature = average mean temperature for each month of the year
2. Changes in temperature
1. Diurnal changes in temperature
The daily temperature change is called the daily temperature change.
Discussion: Based on life experience, when does the highest temperature occur in a day?
2. Annual changes in temperature
Thinking: Based on life experience, in which months of the year do the highest and lowest average monthly temperatures occur?
Annual temperature range = highest monthly average temperature – lowest monthly average temperature
Isotherm plot
Isotherm: A line connecting points with the same temperature based on measurements
Low temperature center: The middle temperature is lower than the surrounding area. It is a low temperature center. It is usually formed because it is a mountainous area.
Temperature distribution:
1. Generally speaking
Low latitudes - high temperatures
High latitudes - low temperatures
latitude factor
2. Same latitude
Summer land and winter sea - high temperature
Summer sea, winter land - low temperature
sea and land factors
3.Mountains
Low altitude - high temperature
High altitude - low temperature
terrain factors
Class fill-in-the-blank exercises
1: Changes in temperature, the highest temperature in a day occurs in ( ); the lowest temperature occurs in ( ); in a year, the highest temperature on land in the Northern Hemisphere is ( ) month, the lowest temperature is ( ) month, and the highest temperature on the ocean is ( ) month , the lowest temperature is ( ) month.
2: The daily temperature range is the difference between ( ) and ( ) in a day; the annual temperature range is the difference between ( ) monthly average temperature and ( ) monthly average temperature in a year.
3: Differences in temperature and latitude, generally ( ) latitude temperature ( ); ( ) latitude temperature ( ). Differences between sea and land, summer ( ) temperature ( ), ( ) temperature ( ) at the same latitude; terrain difference, in mountainous areas, the temperature varies ( ) with altitude, and the temperature decreases ( ) with every 100m increase in altitude.
4: Looking at the world average temperature distribution map, we can know that the isotherm of the annual average temperature of 20°C is basically consistent with ( ) in the southern and northern hemispheres, so the area with the average temperature ( ) that year is the ( ) zone, and the annual average temperature is ( ) and The Arctic and Southern Circles are basically consistent.
5: We use ( ) to represent the temperature distribution. The isotherm is ( ). The one with low central temperature is called ( ) center, and vice versa is called ( ) center.
6: Where the isotherms ( ) are, the difference in temperature is ( ); where the isotherms are sparse, the difference in temperature is ( ).
Keywords: Weather and climate teaching courseware, temperature change and distribution teaching courseware, People's Education Edition seventh grade geography PPT courseware download, seventh grade geography slide courseware download, weather and climate PPT courseware download, temperature change and distribution PPT courseware Download, .PPT format;
For more information about the PPT courseware "Weather and Climate Temperature Changes and Distribution", please click the Weather and Climate ppt Temperature Changes and Distribution ppt tag.
"Changes and Distribution of Temperature" Weather and Climate PPT Courseware 5:
"Changes and Distribution of Temperature" Weather and Climate PPT Courseware 5 Riddle Quiz This is how my weight changes. The answer must be the scale. There is a river on the wall. No waves but wind. It grows when it is hot and falls when it is cold. ... ... ... Determination of air temperature and air temperature Determination..
"Changes and Distribution of Temperature" Weather and Climate PPT Courseware 4:
"Changes and Distribution of Temperature" Weather and Climate PPT Courseware 4 Teaching Objectives 1. Know some basic concepts about temperature, such as daily average temperature, monthly average temperature, annual average temperature, daily temperature variation, annual temperature variation, daily temperature range, annual temperature range, isothermal...
"Changes and Distribution of Temperature" Weather and Climate PPT Courseware 3:
"Changes and Distribution of Temperature" Weather and Climate PPT Courseware 3 1. Changes in Temperature 1. Diurnal Changes in Temperature The highest temperature in a day occurs around 2 o'clock in the afternoon and the lowest temperature occurs around sunrise. The daily difference in temperature is the highest temperature and the lowest temperature. The difference in temperature. The daily change in temperature..
File Info
Update Time: 2024-11-24
This template belongs to Geography courseware People's Education Edition Geography for Grade 7 Volume 1 industry PPT template
"Changes and Distribution of Temperature" Weather and Climate PPT Courseware 6 Simple campus recruitment activity planning plan summary enterprise and institution recruitment publicity lecture PPT template is a general PPT template for business post competition provided by the manuscript PPT, simple campus recruitment activity planning plan summary enterprise and institution recruitment promotion Lecture PPT template, you can edit and modify the text and pictures in the source file by downloading the source file. If you want more exquisite business PPT templates, you can come to grid resource. Doug resource PPT, massive PPT template slide material download, we only make high-quality PPT templates!
Tips: If you open the template and feel that it is not suitable for all your needs, you can search for related content "Changes and Distribution of Temperature" Weather and Climate PPT Courseware 6 is enough.
How to use the Windows system template
Directly decompress the file and use it with office or wps
How to use the Mac system template
Directly decompress the file and use it Office or wps can be used
Related reading
For more detailed PPT-related tutorials and font tutorials, you can view: Click to see
How to create a high-quality technological sense PPT? 4 ways to share the bottom of the box
Notice
Do not download in WeChat, Zhihu, QQ, built-in browsers, please use mobile browsers to download! If you are a mobile phone user, please download it on your computer!
1. The manuscript PPT is only for study and reference, please delete it 24 hours after downloading.
2. If the resource involves your legitimate rights and interests, delete it immediately.
3. Contact information: service@daogebangong.com
"Changes and Distribution of Temperature" Weather and Climate PPT Courseware 6, due to usage restrictions, it is only for personal study and reference use. For commercial use, please go to the relevant official website for authorization.
(Personal non-commercial use refers to the use of this font to complete the display of personal works, including but not limited to the design of personal papers, resumes, etc.)
Preview
Related Search:
"Changes and Distribution of Temperature" Weather and Climate PPT Courseware 6
2024-11-24
Copyright statement: This material is compiled and released by the user of Daoge Resources. The copyright belongs to the author. For commercial use, please contact the copyright owner. If there is any infringement, please contact the webmaster to remove the resource.
Download Points: 0.00
Free Download
Upgrade VIP
Favorite
Views: 3954 / Downloads: 81


