"Changes and Differences in Temperature" PPT Simple campus recruitment activity planning plan summary enterprise and institution recruitment publicity lecture PPT template is a general PPT template for business post competition provided by the manuscript PPT, simple campus recruitment activity planning plan summary enterprise and institution recruitment promotion Lecture PPT template, you can edit and modify the text and pictures in the source file by downloading the source file. If you want more exquisite business PPT templates, you can come to grid resource. Doug resource PPT, massive PPT template slide material download, we only make high-quality PPT templates!
| 文件名 如何下载使用 | 下载次数 | Download Points | 下载地址 |
|---|---|---|---|
| "Changes and Differences... | 20950次 | 0.00 | Free Download |
Tips: If you open the template and feel that it is not suitable for all your needs, you can search for related content "Changes and Differences in Temperature" PPT is enough.
How to use the Windows system template
Directly decompress the file and use it with office or wps
How to use the Mac system template
Directly decompress the file and use it Office or wps can be used
Related reading
For more detailed PPT-related tutorials and font tutorials, you can view: Click to see
How to create a high-quality technological sense PPT? 4 ways to share the bottom of the box
Notice
Do not download in WeChat, Zhihu, QQ, built-in browsers, please use mobile browsers to download! If you are a mobile phone user, please download it on your computer!
1. The manuscript PPT is only for study and reference, please delete it 24 hours after downloading.
2. If the resource involves your legitimate rights and interests, delete it immediately.
3. Contact information: service@daogebangong.com
"Changes and Differences in Temperature" PPT, due to usage restrictions, it is only for personal study and reference use. For commercial use, please go to the relevant official website for authorization.
(Personal non-commercial use refers to the use of this font to complete the display of personal works, including but not limited to the design of personal papers, resumes, etc.)
Related reading
For more detailed PPT-related tutorials and font tutorials, you can view:Please click to see



Authoritative PPT Summary
"Changes and Differences in Temperature" PPT
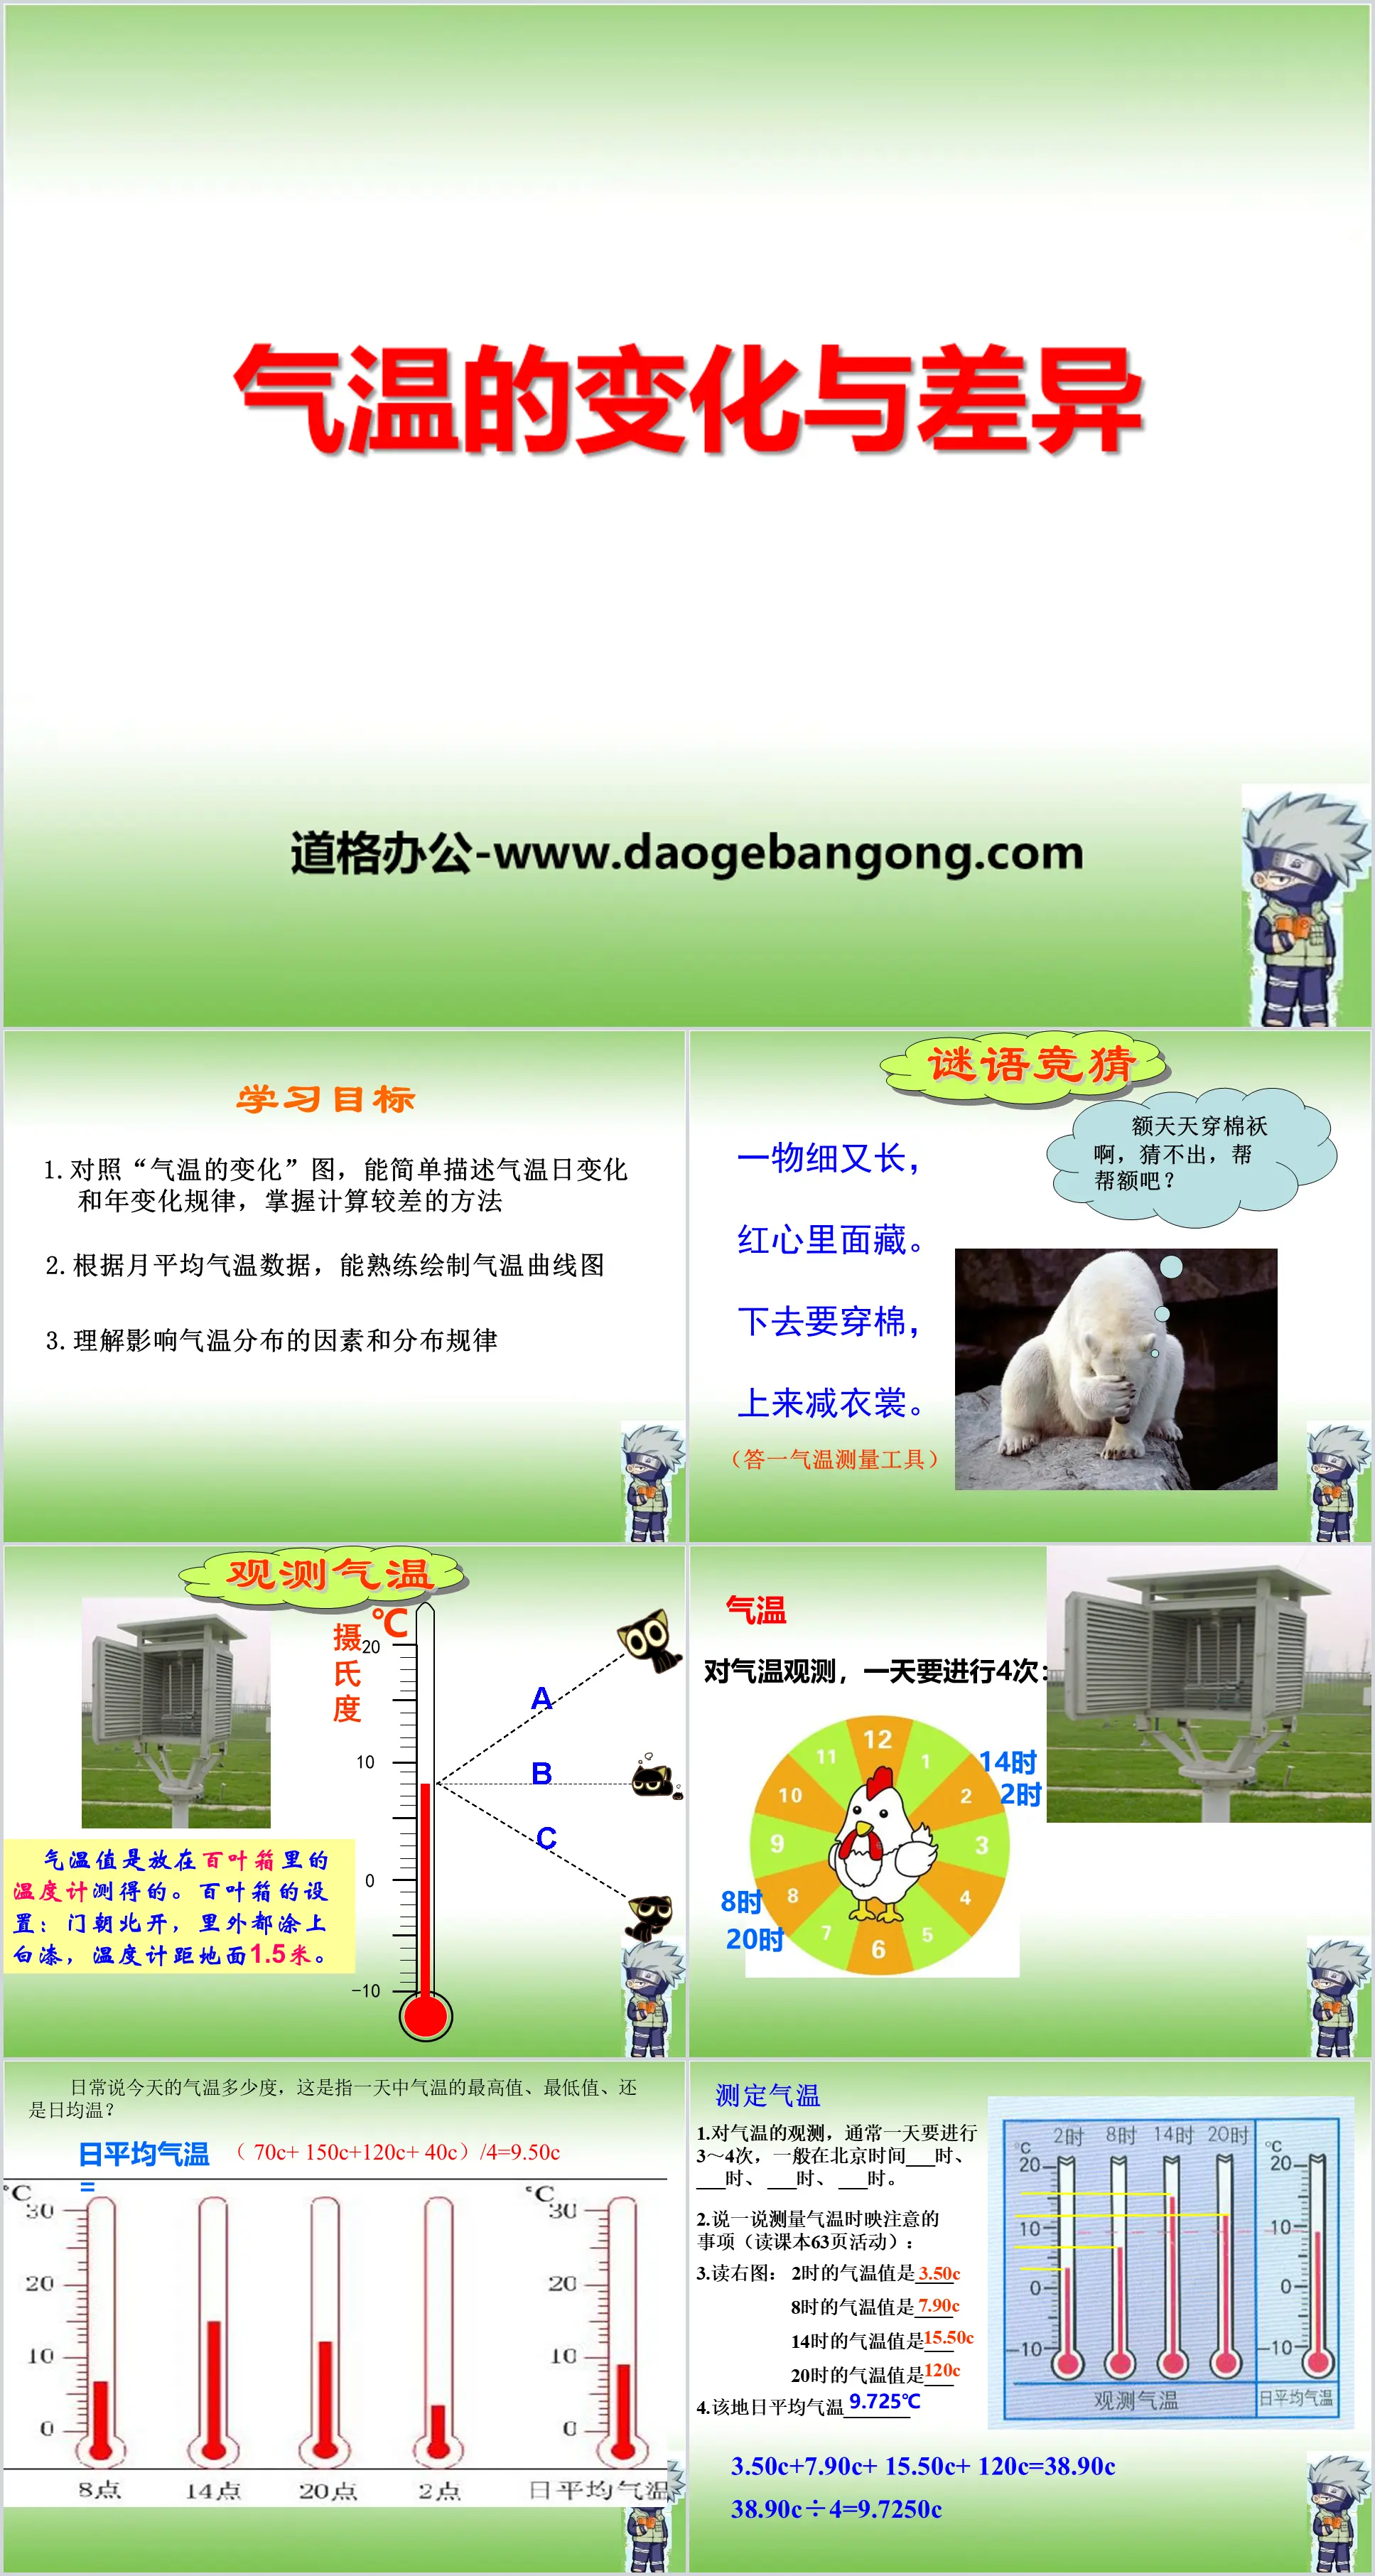
Part One: Learning Objectives
1. Compare the "Temperature Change" chart, be able to simply describe the diurnal and annual changes in temperature, and master the method of calculating errors.
2. Be able to skillfully draw temperature curves based on monthly average temperature data
3. Understand the factors and distribution patterns that affect temperature distribution
Observed air temperature
The air temperature value is measured by a thermometer placed in a blind box.
The setting of the shutter: the door opens to the north, the inside and outside are painted with white paint, and the thermometer is 1.5 meters from the ground.
Determine air temperature
1. Observation of temperature is usually carried out 3 to 4 times a day, usually at ___ hour, ___ hour, ___ hour and ___ hour Beijing time.
2. Talk about the things to pay attention to when measuring temperature (read the activity on page 63 of the textbook):
3. Read the picture on the right: The temperature value at 2 o'clock is ____
The temperature value at 8 o'clock is____
The temperature value at 14:00 is___
The temperature value at 20 o'clock is___
4.The average daily temperature of the place_______
Changes and Differences in Temperature PPT, Part 2: Changes in Temperature
Thinking: How to calculate the average temperature?
Monthly average temperature = sum of daily average temperatures for 30 days in January divided by the number of days in the month
Annual average temperature = the average temperature for the twelve months of the year divided by 12.
Annual temperature range = highest monthly average temperature – lowest monthly average temperature
1. Diurnal changes in temperature: changes in temperature over a one-day period
2. Annual changes in temperature: temperature changes in a one-year cycle
3. Diurnal temperature range: the difference between the highest and lowest temperature in a day
4. Annual temperature range: the difference between the maximum monthly average temperature and the average monthly minimum temperature in a year
Temperature changes and differences PPT, part 3: How to make a temperature curve chart
(1) Draw the abscissa axis, divide it evenly into 12 segments, and label each month with the month.
(2) Draw the ordinate axis and mark the temperature scale according to equal temperature differences.
(3) Mark the temperature data for each month in the table with points, and then connect the points with smooth lines to draw a curve.
(4) Write the name of the picture in the appropriate position of the picture to complete the temperature curve diagram.
Step 1: Draw the horizontal axis, divide it into 12 equal segments, and label each month.
Step 2: Draw the ordinate axis and mark the temperature scale according to equal temperature differences.
Step 3: Mark the temperature data for each month in the table with points, then connect the points with smooth lines to draw a curve.
Step 4: Write the name of the picture in the appropriate position of the picture to complete the temperature curve chart
Temperature changes and differences PPT, Part 4: Classroom exercises
1. The highest daily temperature on land generally occurs at ___ hour, and the lowest temperature occurs at ________ hour.
2. The highest temperature on a certain day in Beijing is 32℃, the lowest temperature is 18℃, and the daily temperature range is _________.
3. The average temperature in Beijing in July of a certain year is 28℃, and in January it is 4.7℃. The annual temperature range is ________.
Speeding practice
1. During the day, the highest temperature occurs at ______ and the lowest temperature occurs at __________. The difference between the maximum temperature and the minimum temperature is called ___________.
2. During the year, the temperature in the Northern Hemisphere is _____ the highest on the continent and the lowest _____; the temperature on the ocean is _____ the highest and _____ the lowest. The difference between the average temperature of the hottest month and the average temperature of the coldest month in a year is called _________.
Changes and Differences in Temperature PPT, Part 5: Differences in Temperature
Think: What is an isotherm?
Find points on the map with the same temperature at the same time and connect them to form a line. The connected line is an isotherm.
A smooth curve connecting points on a map with equal temperatures.
Self-study completed:
1. On the same isotherm line, the temperature at each point ________
2. On the same isotherm diagram, the difference between two adjacent isotherms is ___________
3. Where there are dense isotherms, the temperature difference is _____;
Where isotherms are sparse, the temperature difference is _____.
4. The isotherm is in a closed state, and the central air temperature is _____, which means it is _____;
The isotherms are closed, and the central air temperature is _____, which means this is _____.
Keywords: Business Planet version seventh grade geography PPT courseware free download, temperature changes and differences PPT download, .PPT format;
For more information about the "Changes and Differences in Temperature" PPT courseware, please click on the "Changes and Differences in Temperature" ppt tab.
"Changes and Differences in Temperature" PPT courseware:
"Changes and Differences in Temperature" PPT courseware Part One: Overview of Temperature Temperature: refers to the degree of coldness and heat of the atmosphere, generally expressed in ℃. 1. Observation of temperature Tool: Thermometer The temperature that accurately reflects the weather conditions of a place is placed at the meteorological observatory..