Business Planet Edition 7th Grade Geography Volume 1
Business Planet Edition 7th Grade Geography Volume 2
People's Education Edition Geography for Seventh Grade Volume 2
Business Planet Edition Geography for Grade 8 Volume 1
Shanghai Education Edition Seventh Grade Geography Volume 1
People's Education Edition Geography for Eighth Grade Volume 2
Hunan Education Edition High School Geography Compulsory Course I
People's Education Edition Geography for Grade 7 Volume 1
Business Planet Edition Geography for Eighth Grade Volume 2
Shanghai Education Edition Geography for Sixth Graders Volume 1
Compulsory Course 1 of High School Geography in China Graphics Edition
People's Education Edition Geography for Grade 8 Volume 1
Hunan Education Edition High School Geography Compulsory Course II
Lu Ke version of high school geography compulsory course I
Shanghai Education Edition Seventh Grade Geography Volume 2
People's Education Press High School Geography Compulsory Course 1

| Category | Format | Size |
|---|---|---|
| Business Planet Edition 7th Grade Geography Volume 1 | pptx | 6 MB |

"Changes and Differences in Temperature" PPT Courseware
2024-10-19
Copyright statement: This material is compiled and released by the user of Daoge Resources. The copyright belongs to the author. For commercial use, please contact the copyright owner. If there is any infringement, please contact the webmaster to remove the resource.
Download Points: 0.00
Free Download
Upgrade VIP
Favorite
Views: 2909 / Downloads: 917
Description
"Changes and Differences in Temperature" PPT Courseware
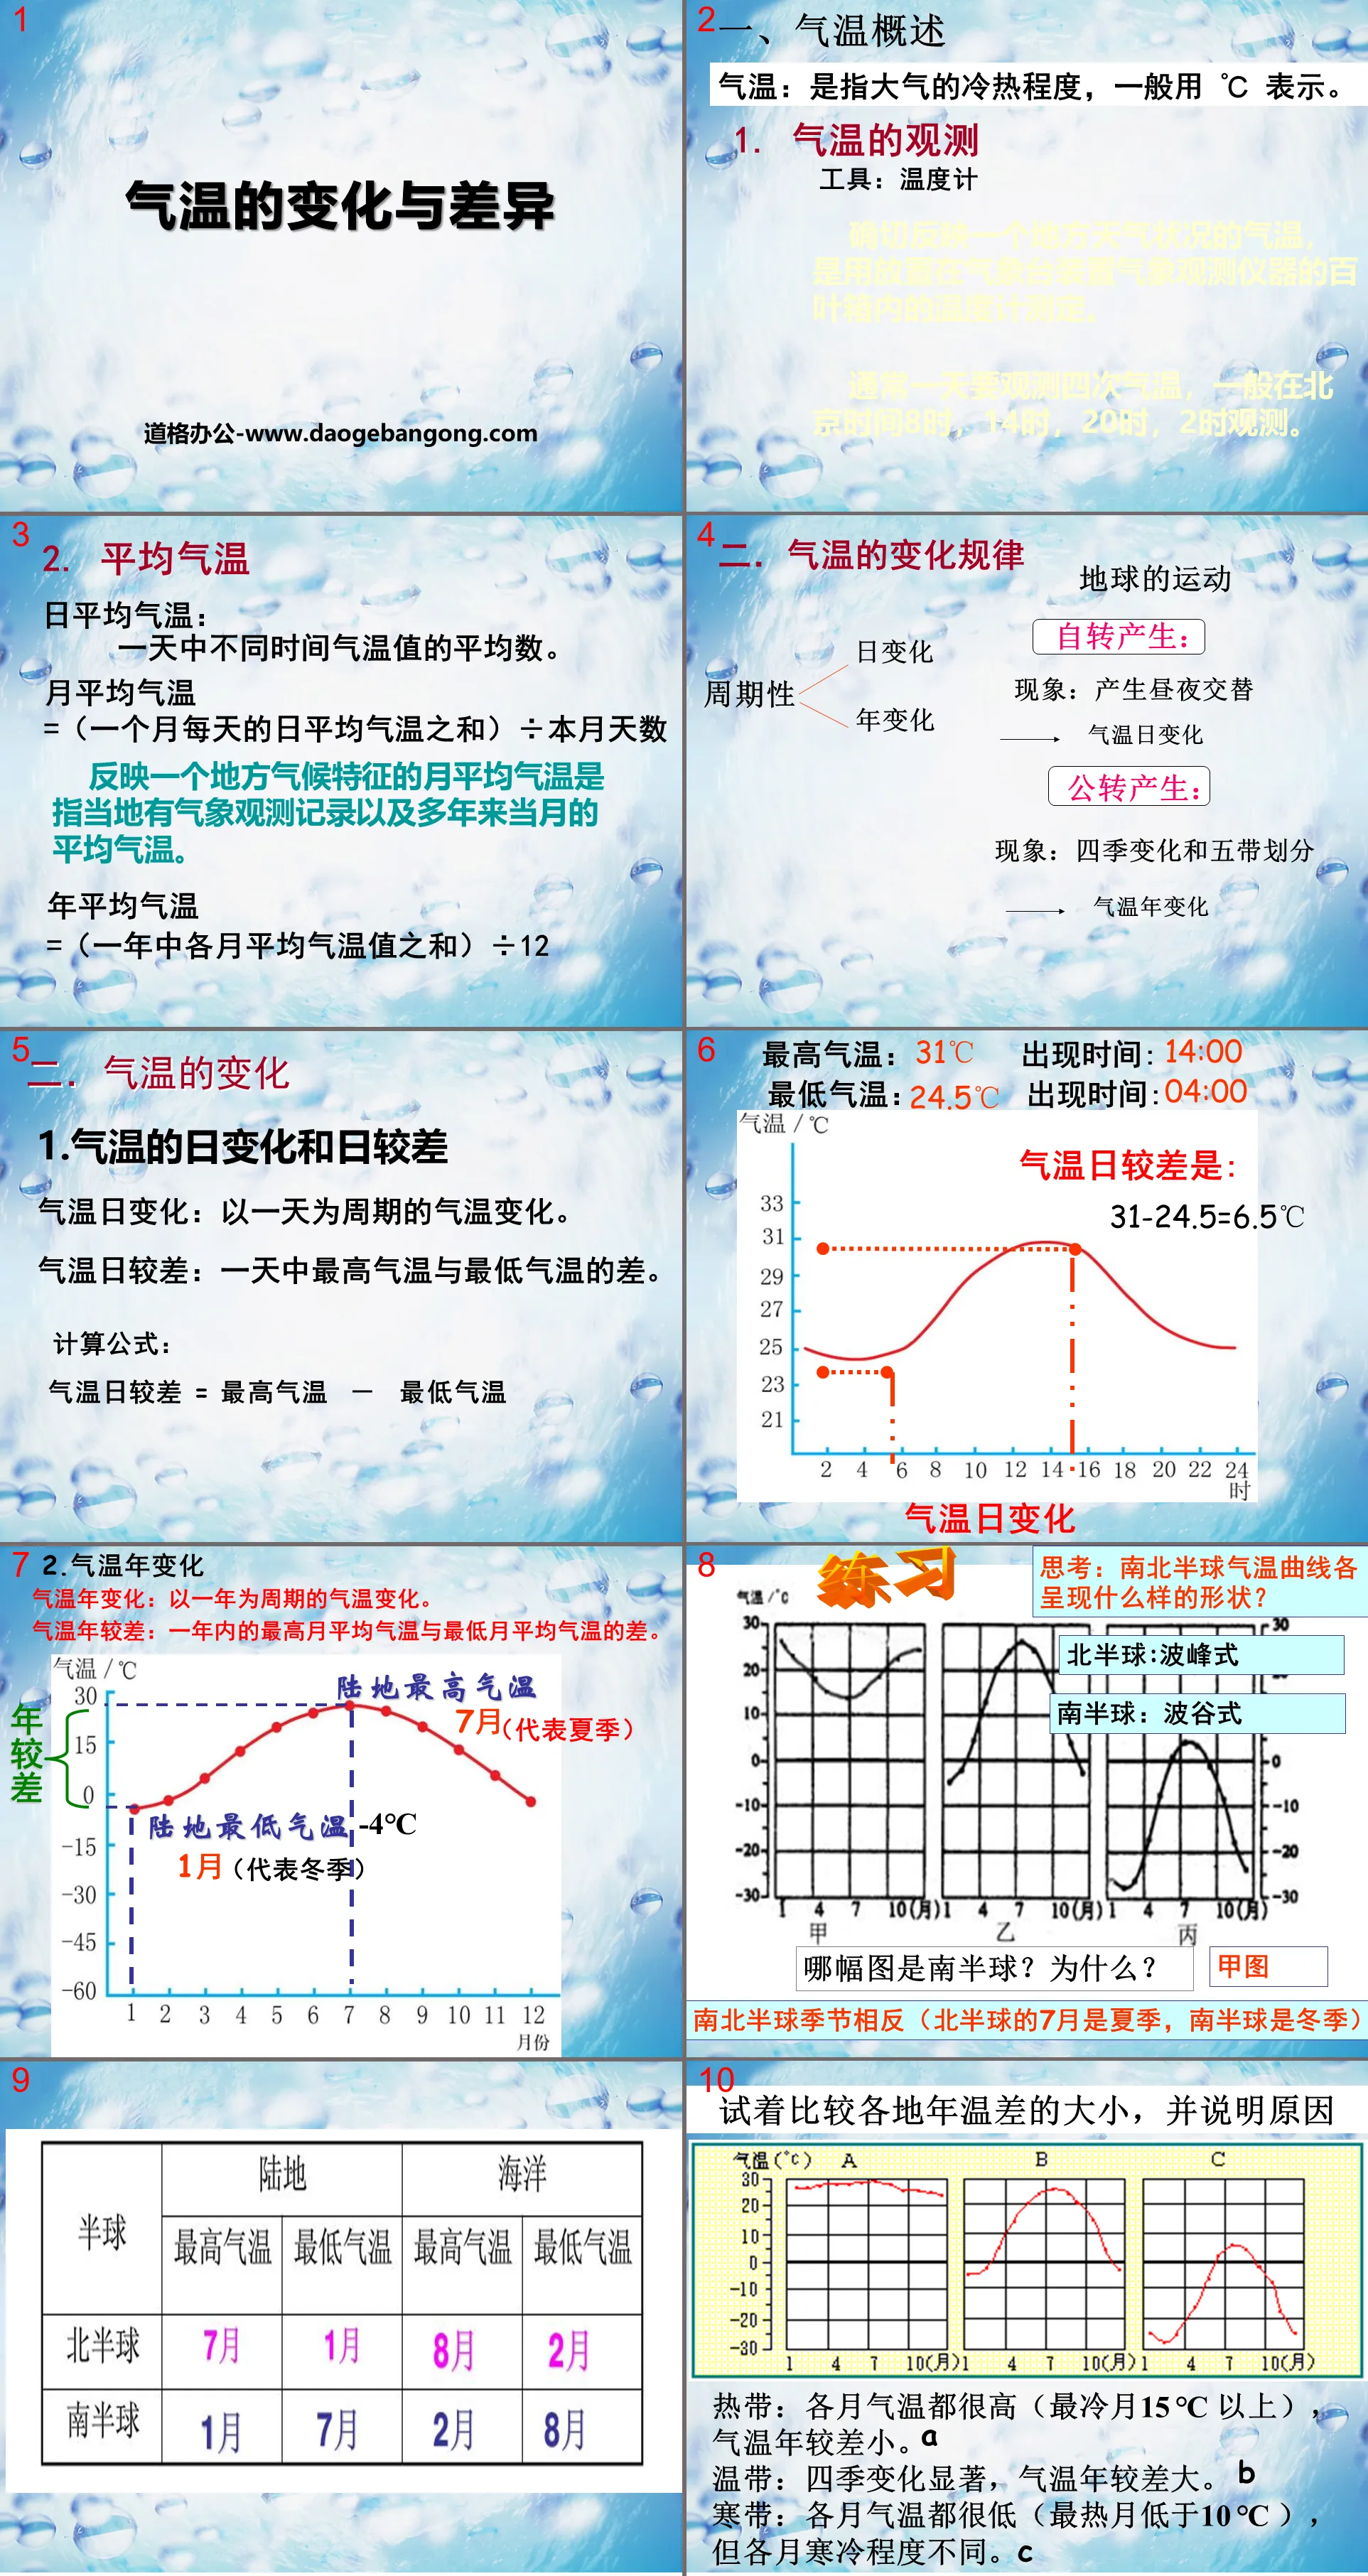
Part I: Temperature Overview
Temperature: refers to the degree of hotness or coldness of the atmosphere, usually expressed in ℃.
1. Temperature observation
Tools: Thermometer
The temperature, which accurately reflects the weather conditions of a place, is measured using a thermometer placed in a louvered box where meteorological observation instruments are installed at a meteorological station.
The temperature is usually observed four times a day, usually at 8:00, 14:00, 20:00 and 2:00 Beijing time.
2. Average Temperature
Daily average temperature: the average of the temperature values at different times of the day.
Monthly average temperature = (sum of daily average temperatures for each day of the month) ÷ number of days in the month
The monthly average temperature that reflects the climate characteristics of a place refers to the average temperature of the month for which there are local meteorological observation records and over many years.
Annual average temperature = (sum of average temperatures of each month in a year) ÷ 12
Changes and differences in temperature PPT, Part 2: Changes in temperature
1. Daily changes and daily ranges of temperature
Diurnal temperature variation: temperature variation with a cycle of one day.
Diurnal temperature range: the difference between the highest and lowest temperatures in a day.
Calculation formula:
Daily temperature range = maximum temperature - minimum temperature
2. Annual temperature changes
Annual temperature variation: temperature variation with a cycle of one year.
Annual temperature range: the difference between the highest monthly average temperature and the lowest monthly average temperature in a year.
3. Annual temperature change curve
In most places on land, the highest monthly average temperature in the Northern Hemisphere occurs in July, and in the Southern Hemisphere in January. The lowest monthly average temperature occurs in January, and in July, in the Northern Hemisphere in the Southern Hemisphere.
In order to intuitively reflect the changes in temperature in a certain place in each month, a temperature curve chart is usually drawn throughout the year. The months are marked on the horizontal line at the bottom of the chart, and there will be a scale representing the temperature on the vertical line on the left. The average temperature of each month is marked with dots, and the line connecting the points is the temperature change curve for the whole year.
Temperature changes and differences PPT, Part 3: Temperature differences
1. Isotherm diagrams are usually used to represent the horizontal distribution of temperature.
Isotherm: A line connecting points of equal temperature.
Isotherm map: A map with plotted isotherm lines.
Isotherms are closed like this. If the temperature in the center is low, it means it is a low temperature center; otherwise, it is a high temperature center.
2. Temperature distribution and influencing factors
(1) How does the temperature change from the equator to the poles? What is the reason for the change?
(2) Indicate the latitudes where the annual average temperature is above 20℃ and below -10℃ respectively.
Areas with an average annual temperature above 20°C: between the Tropic of Cancer and the Tropic of Capricorn
Areas below -10℃: within the Arctic and Antarctic Circles
Factors affecting temperature distribution:
Latitude Factor
Sea and land factors
Topographic factors
Keywords: Business Planet Edition Grade 7 Geography PPT courseware free download, temperature changes and differences PPT download, .PPT format;
For more information about the "Changes and Differences in Temperature" PPT courseware, please click the "Changes and Differences in Temperature" PPT tag.
PPT: Changes and Differences in Temperature
"Changes and Differences in Temperature" PPT Part 1 Content: Learning Objectives 1. Compare the temperature change chart, be able to simply describe the daily and annual changes in temperature, and master the method of calculating the difference 2. Based on the monthly average temperature data, be able to skillfully draw a temperature curve chart 3. Understand..
File Info
Update Time: 2024-10-19
This template belongs to Geography courseware Business Planet Edition 7th Grade Geography Volume 1 industry PPT template
"Changes and Differences in Temperature" PPT Courseware Simple campus recruitment activity planning plan summary enterprise and institution recruitment publicity lecture PPT template is a general PPT template for business post competition provided by the manuscript PPT, simple campus recruitment activity planning plan summary enterprise and institution recruitment promotion Lecture PPT template, you can edit and modify the text and pictures in the source file by downloading the source file. If you want more exquisite business PPT templates, you can come to grid resource. Doug resource PPT, massive PPT template slide material download, we only make high-quality PPT templates!
Tips: If you open the template and feel that it is not suitable for all your needs, you can search for related content "Changes and Differences in Temperature" PPT Courseware is enough.
How to use the Windows system template
Directly decompress the file and use it with office or wps
How to use the Mac system template
Directly decompress the file and use it Office or wps can be used
Related reading
For more detailed PPT-related tutorials and font tutorials, you can view: Click to see
How to create a high-quality technological sense PPT? 4 ways to share the bottom of the box
Notice
Do not download in WeChat, Zhihu, QQ, built-in browsers, please use mobile browsers to download! If you are a mobile phone user, please download it on your computer!
1. The manuscript PPT is only for study and reference, please delete it 24 hours after downloading.
2. If the resource involves your legitimate rights and interests, delete it immediately.
3. Contact information: service@daogebangong.com
"Changes and Differences in Temperature" PPT Courseware, due to usage restrictions, it is only for personal study and reference use. For commercial use, please go to the relevant official website for authorization.
(Personal non-commercial use refers to the use of this font to complete the display of personal works, including but not limited to the design of personal papers, resumes, etc.)
Preview
Related Search:
"Changes and Differences in Temperature" PPT Courseware
2024-10-19
Copyright statement: This material is compiled and released by the user of Daoge Resources. The copyright belongs to the author. For commercial use, please contact the copyright owner. If there is any infringement, please contact the webmaster to remove the resource.
Download Points: 0.00
Free Download
Upgrade VIP
Favorite
Views: 2909 / Downloads: 917


