Western Normal University Edition First Grade Mathematics Volume 1
People's Education Press First Grade Mathematics Volume 1
Beijing Normal University Edition Seventh Grade Mathematics Volume 1
People's Education Press Third Grade Mathematics Volume 1
People's Education Press Second Grade Mathematics Volume 1
Beijing Normal University Edition Fifth Grade Mathematics Volume 1
Hebei Education Edition Third Grade Mathematics Volume 1
Hebei Education Edition Seventh Grade Mathematics Volume 2
Beijing Normal University Edition Seventh Grade Mathematics Volume 2
Qingdao Edition Seventh Grade Mathematics Volume 1
People's Education High School Mathematics Edition B Compulsory Course 2
Beijing Normal University Edition Eighth Grade Mathematics Volume 1
Qingdao Edition Seventh Grade Mathematics Volume 2
Qingdao Edition Second Grade Mathematics Volume 2
Jiangsu Education Edition Fourth Grade Mathematics Volume 1
People's Education Press First Grade Mathematics Volume 2

| Category | Format | Size |
|---|---|---|
| Qingdao Edition Ninth Grade Mathematics Volume 2 | pptx | 6 MB |

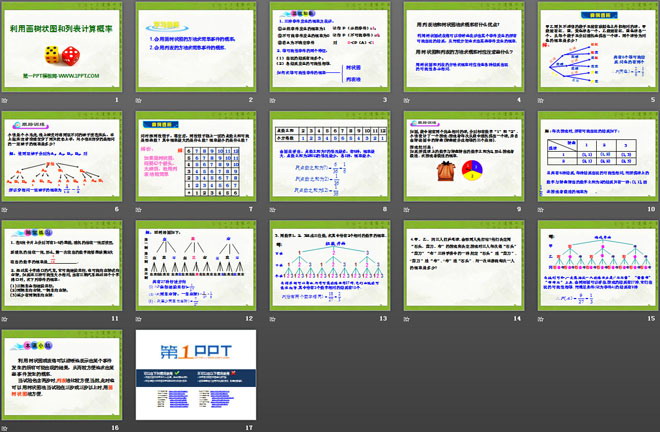
"Calculating Probability Using Drawing Tree Diagrams and Lists" PPT courseware
2024-09-08
Copyright statement: This material is compiled and released by the user of Daoge Resources. The copyright belongs to the author. For commercial use, please contact the copyright owner. If there is any infringement, please contact the webmaster to remove the resource.
Download Points: 0.00
Free Download
Upgrade VIP
Favorite
Views: 2368 / Downloads: 711
Description
"Calculating Probability Using Drawing Tree Diagrams and Lists" PPT courseware
learning target
1. Be able to use the method of drawing tree diagrams to find the probability of simple events;
2. Be able to use the list method to find the probability of simple events.
Review the past and learn the new
1. The probability and expression of three events:
①The probability of an inevitable event occurring is 1 and is recorded as P (inevitable event) = 1;
②The probability of an impossible event occurring is 0 and is recorded as P (impossible event) = 0;
③If A is an uncertain event, then 0<P(A)<1
2. Two characteristics of equally likely events:
(1) There are only a limited number of results;
(2) Each outcome is equally likely to occur.
How to find the probability of equally likely events-----dendrogram list method
What are the advantages of using list method and tree diagram method to find probability?
Tree diagrams or tables can be used to clearly represent all possible outcomes of an event, making it easier to find the probability of certain events.
What should we pay attention to when calculating probability using tree diagram and list methods?
When using tree diagrams and lists to find probabilities, it should be noted that the likelihood of various results must be the same.
Dialysis of typical cases
Two opaque bags A and B contain balls that are the same except for the color. Bag A contains one red, blue, and yellow ball, and bag B contains one red and blue ball. They are randomly selected from each bag. If a ball is drawn on the ground, what is the probability that the two balls are of the same color?
Two dice are thrown at the same time. After settling, what is the possible sum of the points on the up side of the two dice? Which number has the highest probability? What number is the least likely?
Analysis: If you draw a tree diagram, you need 42 arrows, which is too troublesome, so it is simpler to use the list method.
Practice in class
1. Integers from 1 to 6 are written on 6 cards respectively. One card is randomly selected and replaced, and another card is randomly selected. Then, the probability that the number taken out for the first time can evenly divide the number taken out for the second time. It's 7/18.
2. A car passing through an intersection may continue to go straight, or it may turn left or right. If these three possibilities are the same, when three cars pass through this intersection, find the probability of the following events:
(1) All three vehicles continue to go straight;
(2) Two cars turn right and one car turns left;
(3) At least two vehicles turn left.
Summary of this lesson
Tree diagrams or tables can be used to clearly represent all possible outcomes of an event, making it easier to find the probability of certain events.
When the test involves two steps, the list method is more convenient. Of course, the tree diagram method can also be used at this time. When the test involves three or more steps, the tree diagram method is convenient.
Keywords: Using drawing tree diagrams and lists to calculate probability teaching courseware, Qingdao edition ninth grade mathematics second volume PPT courseware download, ninth grade mathematics slide courseware download, using drawing tree diagrams and lists to calculate probability PPT courseware download, .PPT format ;
For more information about the PPT courseware "Using Drawing Tree Diagrams and Lists to Calculate Probabilities", please click the Use Drawing Tree Diagrams and Lists to Calculate Probabilities ppt tag.
"Calculating Probability Using Drawing Tree Diagrams and Lists" PPT Courseware 2:
"Calculating Probability Using Drawing Tree Diagrams and Lists" PPT Courseware 2 Review Review What methods of calculating probability did you learn in the previous class? 1. Drawing tree diagrams 2. Lists Teaching objectives 1. Be proficient in using tree diagrams and lists to calculate the probability of random events; 2. By drawing tree diagrams and columns..
File Info
Update Time: 2024-09-08
This template belongs to Mathematics courseware Qingdao Edition Ninth Grade Mathematics Volume 2 industry PPT template
"Calculating Probability Using Drawing Tree Diagrams and Lists" PPT courseware Simple campus recruitment activity planning plan summary enterprise and institution recruitment publicity lecture PPT template is a general PPT template for business post competition provided by the manuscript PPT, simple campus recruitment activity planning plan summary enterprise and institution recruitment promotion Lecture PPT template, you can edit and modify the text and pictures in the source file by downloading the source file. If you want more exquisite business PPT templates, you can come to grid resource. Doug resource PPT, massive PPT template slide material download, we only make high-quality PPT templates!
Tips: If you open the template and feel that it is not suitable for all your needs, you can search for related content "Calculating Probability Using Drawing Tree Diagrams and Lists" PPT courseware is enough.
How to use the Windows system template
Directly decompress the file and use it with office or wps
How to use the Mac system template
Directly decompress the file and use it Office or wps can be used
Related reading
For more detailed PPT-related tutorials and font tutorials, you can view: Click to see
How to create a high-quality technological sense PPT? 4 ways to share the bottom of the box
Notice
Do not download in WeChat, Zhihu, QQ, built-in browsers, please use mobile browsers to download! If you are a mobile phone user, please download it on your computer!
1. The manuscript PPT is only for study and reference, please delete it 24 hours after downloading.
2. If the resource involves your legitimate rights and interests, delete it immediately.
3. Contact information: service@daogebangong.com
"Calculating Probability Using Drawing Tree Diagrams and Lists" PPT courseware, due to usage restrictions, it is only for personal study and reference use. For commercial use, please go to the relevant official website for authorization.
(Personal non-commercial use refers to the use of this font to complete the display of personal works, including but not limited to the design of personal papers, resumes, etc.)
Preview
Related Search:
"Calculating Probability Using Drawing Tree Diagrams and Lists" PPT courseware
2024-09-08
Copyright statement: This material is compiled and released by the user of Daoge Resources. The copyright belongs to the author. For commercial use, please contact the copyright owner. If there is any infringement, please contact the webmaster to remove the resource.
Download Points: 0.00
Free Download
Upgrade VIP
Favorite
Views: 2368 / Downloads: 711


