Western Normal University Edition First Grade Mathematics Volume 1
Beijing Normal University Edition Seventh Grade Mathematics Volume 1
People's Education Press First Grade Mathematics Volume 1
People's Education Press Second Grade Mathematics Volume 1
People's Education Press Third Grade Mathematics Volume 1
Beijing Normal University Edition Seventh Grade Mathematics Volume 2
Qingdao Edition Seventh Grade Mathematics Volume 1
Beijing Normal University Edition Fifth Grade Mathematics Volume 1
Beijing Normal University Edition Eighth Grade Mathematics Volume 1
Hebei Education Edition Third Grade Mathematics Volume 1
People's Education High School Mathematics Edition B Compulsory Course 2
Hebei Education Edition Seventh Grade Mathematics Volume 2
Hebei Education Edition Fourth Grade Mathematics Volume 2
Beijing Normal University Edition Fifth Grade Mathematics Volume 2
Qingdao Edition Seventh Grade Mathematics Volume 2
People's Education Press First Grade Mathematics Volume 2

| Category | Format | Size |
|---|---|---|
| Qingdao Edition Ninth Grade Mathematics Volume 2 | pptx | 6 MB |

"Calculating Probability Using Drawing Tree Diagrams and Lists" PPT Courseware 2
2024-10-19
Copyright statement: This material is compiled and released by the user of Daoge Resources. The copyright belongs to the author. For commercial use, please contact the copyright owner. If there is any infringement, please contact the webmaster to remove the resource.
Download Points: 0.00
Free Download
Upgrade VIP
Favorite
Views: 3778 / Downloads: 917
Description
"Calculating Probability Using Drawing Tree Diagrams and Lists" PPT Courseware 2
review review
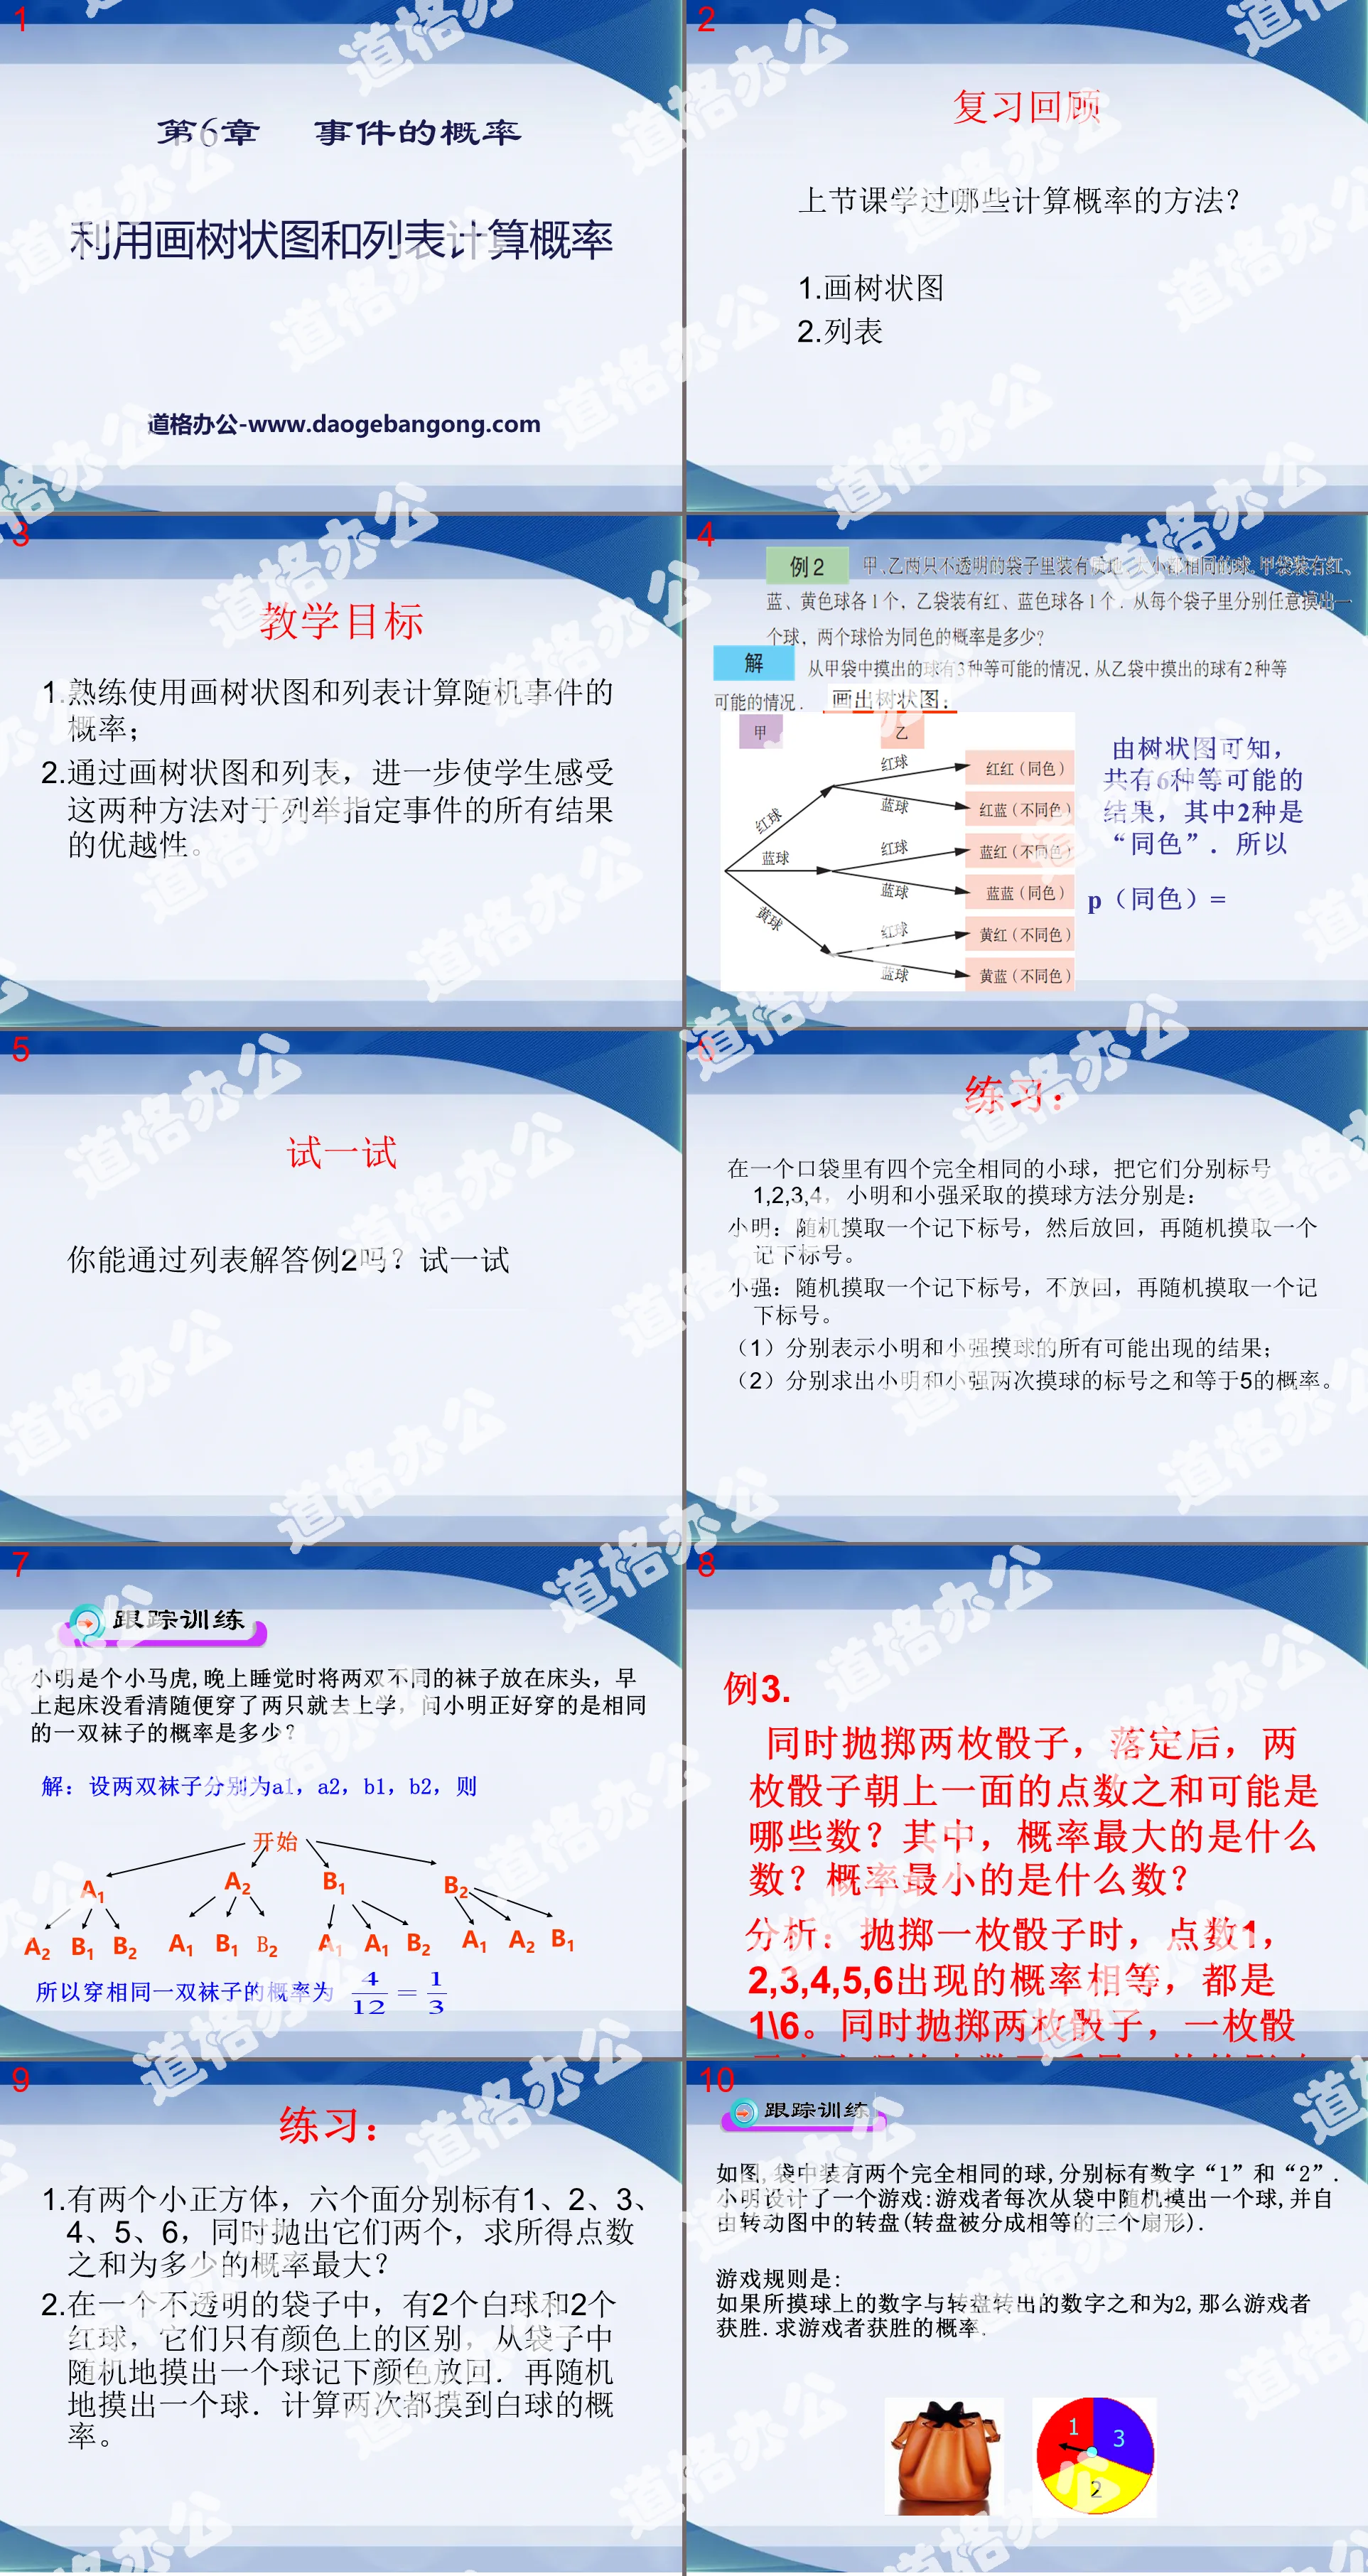
What methods did you learn in the last class to calculate probability?
1. Draw a tree diagram
2. List
teaching objectives
1. Proficient in using tree diagrams and lists to calculate the probability of random events;
2. By drawing tree diagrams and lists, students can further experience the superiority of these two methods for enumerating all the results of specified events.
practise:
There are four identical small balls in a pocket. They are numbered 1, 2, 3, and 4 respectively. The methods used by Xiao Ming and Xiao Qiang to touch the balls are:
Xiao Ming: Pick one at random and write down the number, then put it back, then pick another at random and write down the number.
Xiaoqiang: Pick one at random and write down the number. Do not put it back. Then pick another one at random and write down the number.
(1) Represent all possible results of Xiao Ming and Xiao Qiang touching the ball;
(2) Find the probability that the sum of the numbers of Xiao Ming and Xiao Qiang touching the ball twice is equal to 5.
Track training
As shown in the picture, there are two identical balls in the bag, marked with the numbers "1" and "2" respectively. Xiao Ming designed a game: the player randomly takes out a ball from the bag each time and freely rotates the ball in the picture. The turntable (the turntable is divided into three equal sectors).
The rules of the game are:
If the sum of the number on the touched ball and the number turned out on the turntable is 2, then the player wins. Find the probability of the player winning.
Keywords: Using drawing tree diagrams and lists to calculate probability teaching courseware, Qingdao edition ninth grade mathematics second volume PPT courseware download, ninth grade mathematics slide courseware download, using drawing tree diagrams and lists to calculate probability PPT courseware download, .PPT format ;
For more information about the PPT courseware "Using Drawing Tree Diagrams and Lists to Calculate Probabilities", please click the Use Drawing Tree Diagrams and Lists to Calculate Probabilities PPT tag.
"Calculating Probability Using Drawing Tree Diagrams and Lists" PPT courseware:
"Calculating Probabilities by Drawing Tree Diagrams and Lists" PPT courseware learning objectives 1. Be able to use the method of drawing tree diagrams to find the probabilities of simple events; 2. Be able to use the list method to find the probabilities of simple events. Review the past and learn the new 1. Three types of events The probability and expression of occurrence: ①The inevitable event will happen..
File Info
Update Time: 2024-10-19
This template belongs to Mathematics courseware Qingdao Edition Ninth Grade Mathematics Volume 2 industry PPT template
"Calculating Probability Using Drawing Tree Diagrams and Lists" PPT Courseware 2 Simple campus recruitment activity planning plan summary enterprise and institution recruitment publicity lecture PPT template is a general PPT template for business post competition provided by the manuscript PPT, simple campus recruitment activity planning plan summary enterprise and institution recruitment promotion Lecture PPT template, you can edit and modify the text and pictures in the source file by downloading the source file. If you want more exquisite business PPT templates, you can come to grid resource. Doug resource PPT, massive PPT template slide material download, we only make high-quality PPT templates!
Tips: If you open the template and feel that it is not suitable for all your needs, you can search for related content "Calculating Probability Using Drawing Tree Diagrams and Lists" PPT Courseware 2 is enough.
How to use the Windows system template
Directly decompress the file and use it with office or wps
How to use the Mac system template
Directly decompress the file and use it Office or wps can be used
Related reading
For more detailed PPT-related tutorials and font tutorials, you can view: Click to see
How to create a high-quality technological sense PPT? 4 ways to share the bottom of the box
Notice
Do not download in WeChat, Zhihu, QQ, built-in browsers, please use mobile browsers to download! If you are a mobile phone user, please download it on your computer!
1. The manuscript PPT is only for study and reference, please delete it 24 hours after downloading.
2. If the resource involves your legitimate rights and interests, delete it immediately.
3. Contact information: service@daogebangong.com
"Calculating Probability Using Drawing Tree Diagrams and Lists" PPT Courseware 2, due to usage restrictions, it is only for personal study and reference use. For commercial use, please go to the relevant official website for authorization.
(Personal non-commercial use refers to the use of this font to complete the display of personal works, including but not limited to the design of personal papers, resumes, etc.)
Preview
Related Search:
"Calculating Probability Using Drawing Tree Diagrams and Lists" PPT Courseware 2
2024-10-19
Copyright statement: This material is compiled and released by the user of Daoge Resources. The copyright belongs to the author. For commercial use, please contact the copyright owner. If there is any infringement, please contact the webmaster to remove the resource.
Download Points: 0.00
Free Download
Upgrade VIP
Favorite
Views: 3778 / Downloads: 917


