Western Normal University Edition First Grade Mathematics Volume 1
People's Education Press First Grade Mathematics Volume 1
Beijing Normal University Edition Seventh Grade Mathematics Volume 1
People's Education Press Third Grade Mathematics Volume 1
People's Education Press Second Grade Mathematics Volume 1
Beijing Normal University Edition Fifth Grade Mathematics Volume 1
Hebei Education Edition Third Grade Mathematics Volume 1
Hebei Education Edition Seventh Grade Mathematics Volume 2
Beijing Normal University Edition Seventh Grade Mathematics Volume 2
Qingdao Edition Seventh Grade Mathematics Volume 1
People's Education High School Mathematics Edition B Compulsory Course 2
Beijing Normal University Edition Eighth Grade Mathematics Volume 1
Qingdao Edition Seventh Grade Mathematics Volume 2
Qingdao Edition Second Grade Mathematics Volume 2
Jiangsu Education Edition Fourth Grade Mathematics Volume 1
People's Education Press First Grade Mathematics Volume 2

| Category | Format | Size |
|---|---|---|
| People's Education Press Fourth Grade Mathematics Volume 1 | pptx | 6 MB |

"Bar Chart" PPT courseware
2024-09-08
Copyright statement: This material is compiled and released by the user of Daoge Resources. The copyright belongs to the author. For commercial use, please contact the copyright owner. If there is any infringement, please contact the webmaster to remove the resource.
Download Points: 0.00
Free Download
Upgrade VIP
Favorite
Views: 2909 / Downloads: 719
Description
"Bar Chart" PPT courseware
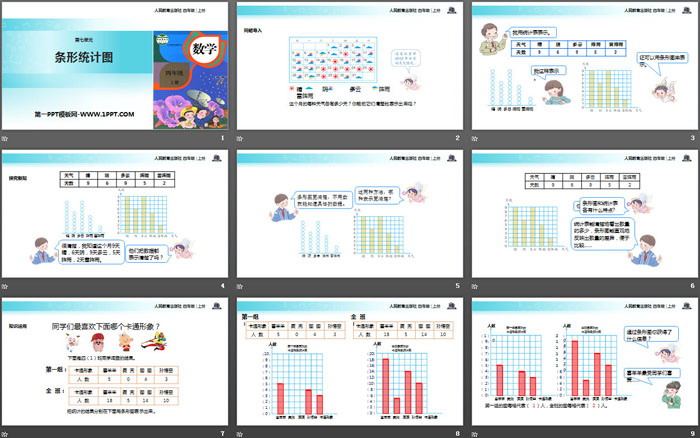
Part One: Problem Introduction
How many days are there in each type of weather this month? Can you express them clearly?
I use statistical tables.
I express this.
It can also be represented by a bar chart.
Bar chart PPT, part 2: exploring new knowledge
Clearly, I know that this month there will be 9 sunny days, 6 cloudy days, 9 cloudy days, 5 showers, and 2 thunderstorms.
Did they present the data clearly?
Bar charts are clearer and you can know the specific data without counting.
Which of these two methods is more clear?
Bar chart PPT, the third part: knowledge application
Which of the following cartoon characters do the students like best?
What information do you gain from a bar chart?
Pleasant Goat is the most popular among classmates...
( ) has the longest lifespan, and ( ) has the shortest lifespan.
How many years longer does an elephant live than a dog?
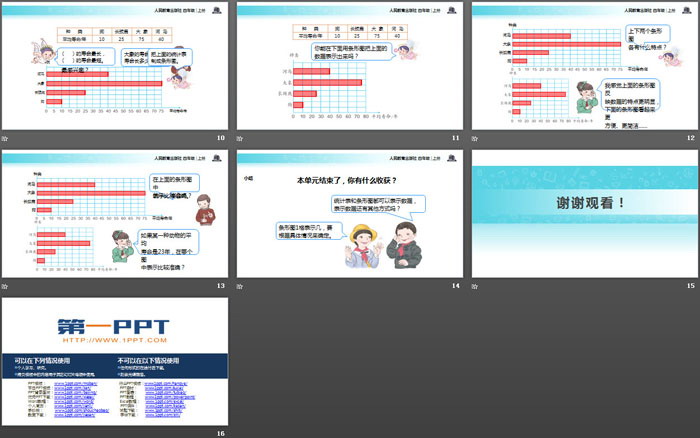
Convert the statistical table above into a bar chart.
Can you represent the data above using a bar chart below?
Bar chart PPT, part 4: summary
This unit is over, what have you gained?
Both statistical tables and bar charts can represent data. Are there other ways to represent data?
The number represented by 1 cell of the bar chart should be determined according to the specific situation.
Keywords: Free download of PPT courseware for fourth-grade mathematics from the People's Education Press, PPT download of bar chart, .PPT format;
For more information about the "Bar Chart" PPT courseware, please click the Bar Chart PPT tab.
"Complex Bar Chart" Data Representation and Analysis PPT Teaching Courseware:
"Complex Bar Chart" Data Representation and Analysis PPT Teaching Courseware Part One: Learning Objectives 1. Through the pitching game, understand the compound bar chart and understand the characteristics of the compound bar chart. 2. Able to obtain as much information as possible from statistical charts and experience...
"Complex Bar Chart" Data Representation and Analysis PPT Download:
"Complex Bar Statistical Chart" Data Representation and Analysis PPT Download Part One Content: Scenario Introduction In physical education class, the teacher organized students to conduct shooting training, but the students encountered difficulties at the beginning of the practice. Some students shot with one hand. , some students use their hands...
"Complex Bar Chart" Data Representation and Analysis PPT:
"Complex Bar Chart" Data Representation and Analysis PPT Part One: Learning Objectives 1. Understand the compound bar chart and understand the characteristics of the compound bar chart. (Key points) 2. Be able to use the information in the compound bar chart to solve problems, and be able to draw complex...
File Info
Update Time: 2024-09-08
This template belongs to Mathematics courseware People's Education Press Fourth Grade Mathematics Volume 1 industry PPT template
"Bar Chart" PPT courseware Simple campus recruitment activity planning plan summary enterprise and institution recruitment publicity lecture PPT template is a general PPT template for business post competition provided by the manuscript PPT, simple campus recruitment activity planning plan summary enterprise and institution recruitment promotion Lecture PPT template, you can edit and modify the text and pictures in the source file by downloading the source file. If you want more exquisite business PPT templates, you can come to grid resource. Doug resource PPT, massive PPT template slide material download, we only make high-quality PPT templates!
Tips: If you open the template and feel that it is not suitable for all your needs, you can search for related content "Bar Chart" PPT courseware is enough.
How to use the Windows system template
Directly decompress the file and use it with office or wps
How to use the Mac system template
Directly decompress the file and use it Office or wps can be used
Related reading
For more detailed PPT-related tutorials and font tutorials, you can view: Click to see
How to create a high-quality technological sense PPT? 4 ways to share the bottom of the box
Notice
Do not download in WeChat, Zhihu, QQ, built-in browsers, please use mobile browsers to download! If you are a mobile phone user, please download it on your computer!
1. The manuscript PPT is only for study and reference, please delete it 24 hours after downloading.
2. If the resource involves your legitimate rights and interests, delete it immediately.
3. Contact information: service@daogebangong.com
"Bar Chart" PPT courseware, due to usage restrictions, it is only for personal study and reference use. For commercial use, please go to the relevant official website for authorization.
(Personal non-commercial use refers to the use of this font to complete the display of personal works, including but not limited to the design of personal papers, resumes, etc.)
Preview
Related Search:
"Bar Chart" PPT courseware
2024-09-08
Copyright statement: This material is compiled and released by the user of Daoge Resources. The copyright belongs to the author. For commercial use, please contact the copyright owner. If there is any infringement, please contact the webmaster to remove the resource.
Download Points: 0.00
Free Download
Upgrade VIP
Favorite
Views: 2909 / Downloads: 719


