"Average" data analysis PPT courseware 3 Simple campus recruitment activity planning plan summary enterprise and institution recruitment publicity lecture PPT template is a general PPT template for business post competition provided by the manuscript PPT, simple campus recruitment activity planning plan summary enterprise and institution recruitment promotion Lecture PPT template, you can edit and modify the text and pictures in the source file by downloading the source file. If you want more exquisite business PPT templates, you can come to grid resource. Doug resource PPT, massive PPT template slide material download, we only make high-quality PPT templates!
| 文件名 如何下载使用 | 下载次数 | Download Points | 下载地址 |
|---|---|---|---|
| "Average" data analysis... | 21850次 | 0.00 | Free Download |
Tips: If you open the template and feel that it is not suitable for all your needs, you can search for related content "Average" data analysis PPT courseware 3 is enough.
How to use the Windows system template
Directly decompress the file and use it with office or wps
How to use the Mac system template
Directly decompress the file and use it Office or wps can be used
Related reading
For more detailed PPT-related tutorials and font tutorials, you can view: Click to see
How to create a high-quality technological sense PPT? 4 ways to share the bottom of the box
Notice
Do not download in WeChat, Zhihu, QQ, built-in browsers, please use mobile browsers to download! If you are a mobile phone user, please download it on your computer!
1. The manuscript PPT is only for study and reference, please delete it 24 hours after downloading.
2. If the resource involves your legitimate rights and interests, delete it immediately.
3. Contact information: service@daogebangong.com
"Average" data analysis PPT courseware 3, due to usage restrictions, it is only for personal study and reference use. For commercial use, please go to the relevant official website for authorization.
(Personal non-commercial use refers to the use of this font to complete the display of personal works, including but not limited to the design of personal papers, resumes, etc.)

Related reading
For more detailed PPT-related tutorials and font tutorials, you can view:Please click to see


Authoritative PPT Summary
"Average" data analysis PPT courseware 3
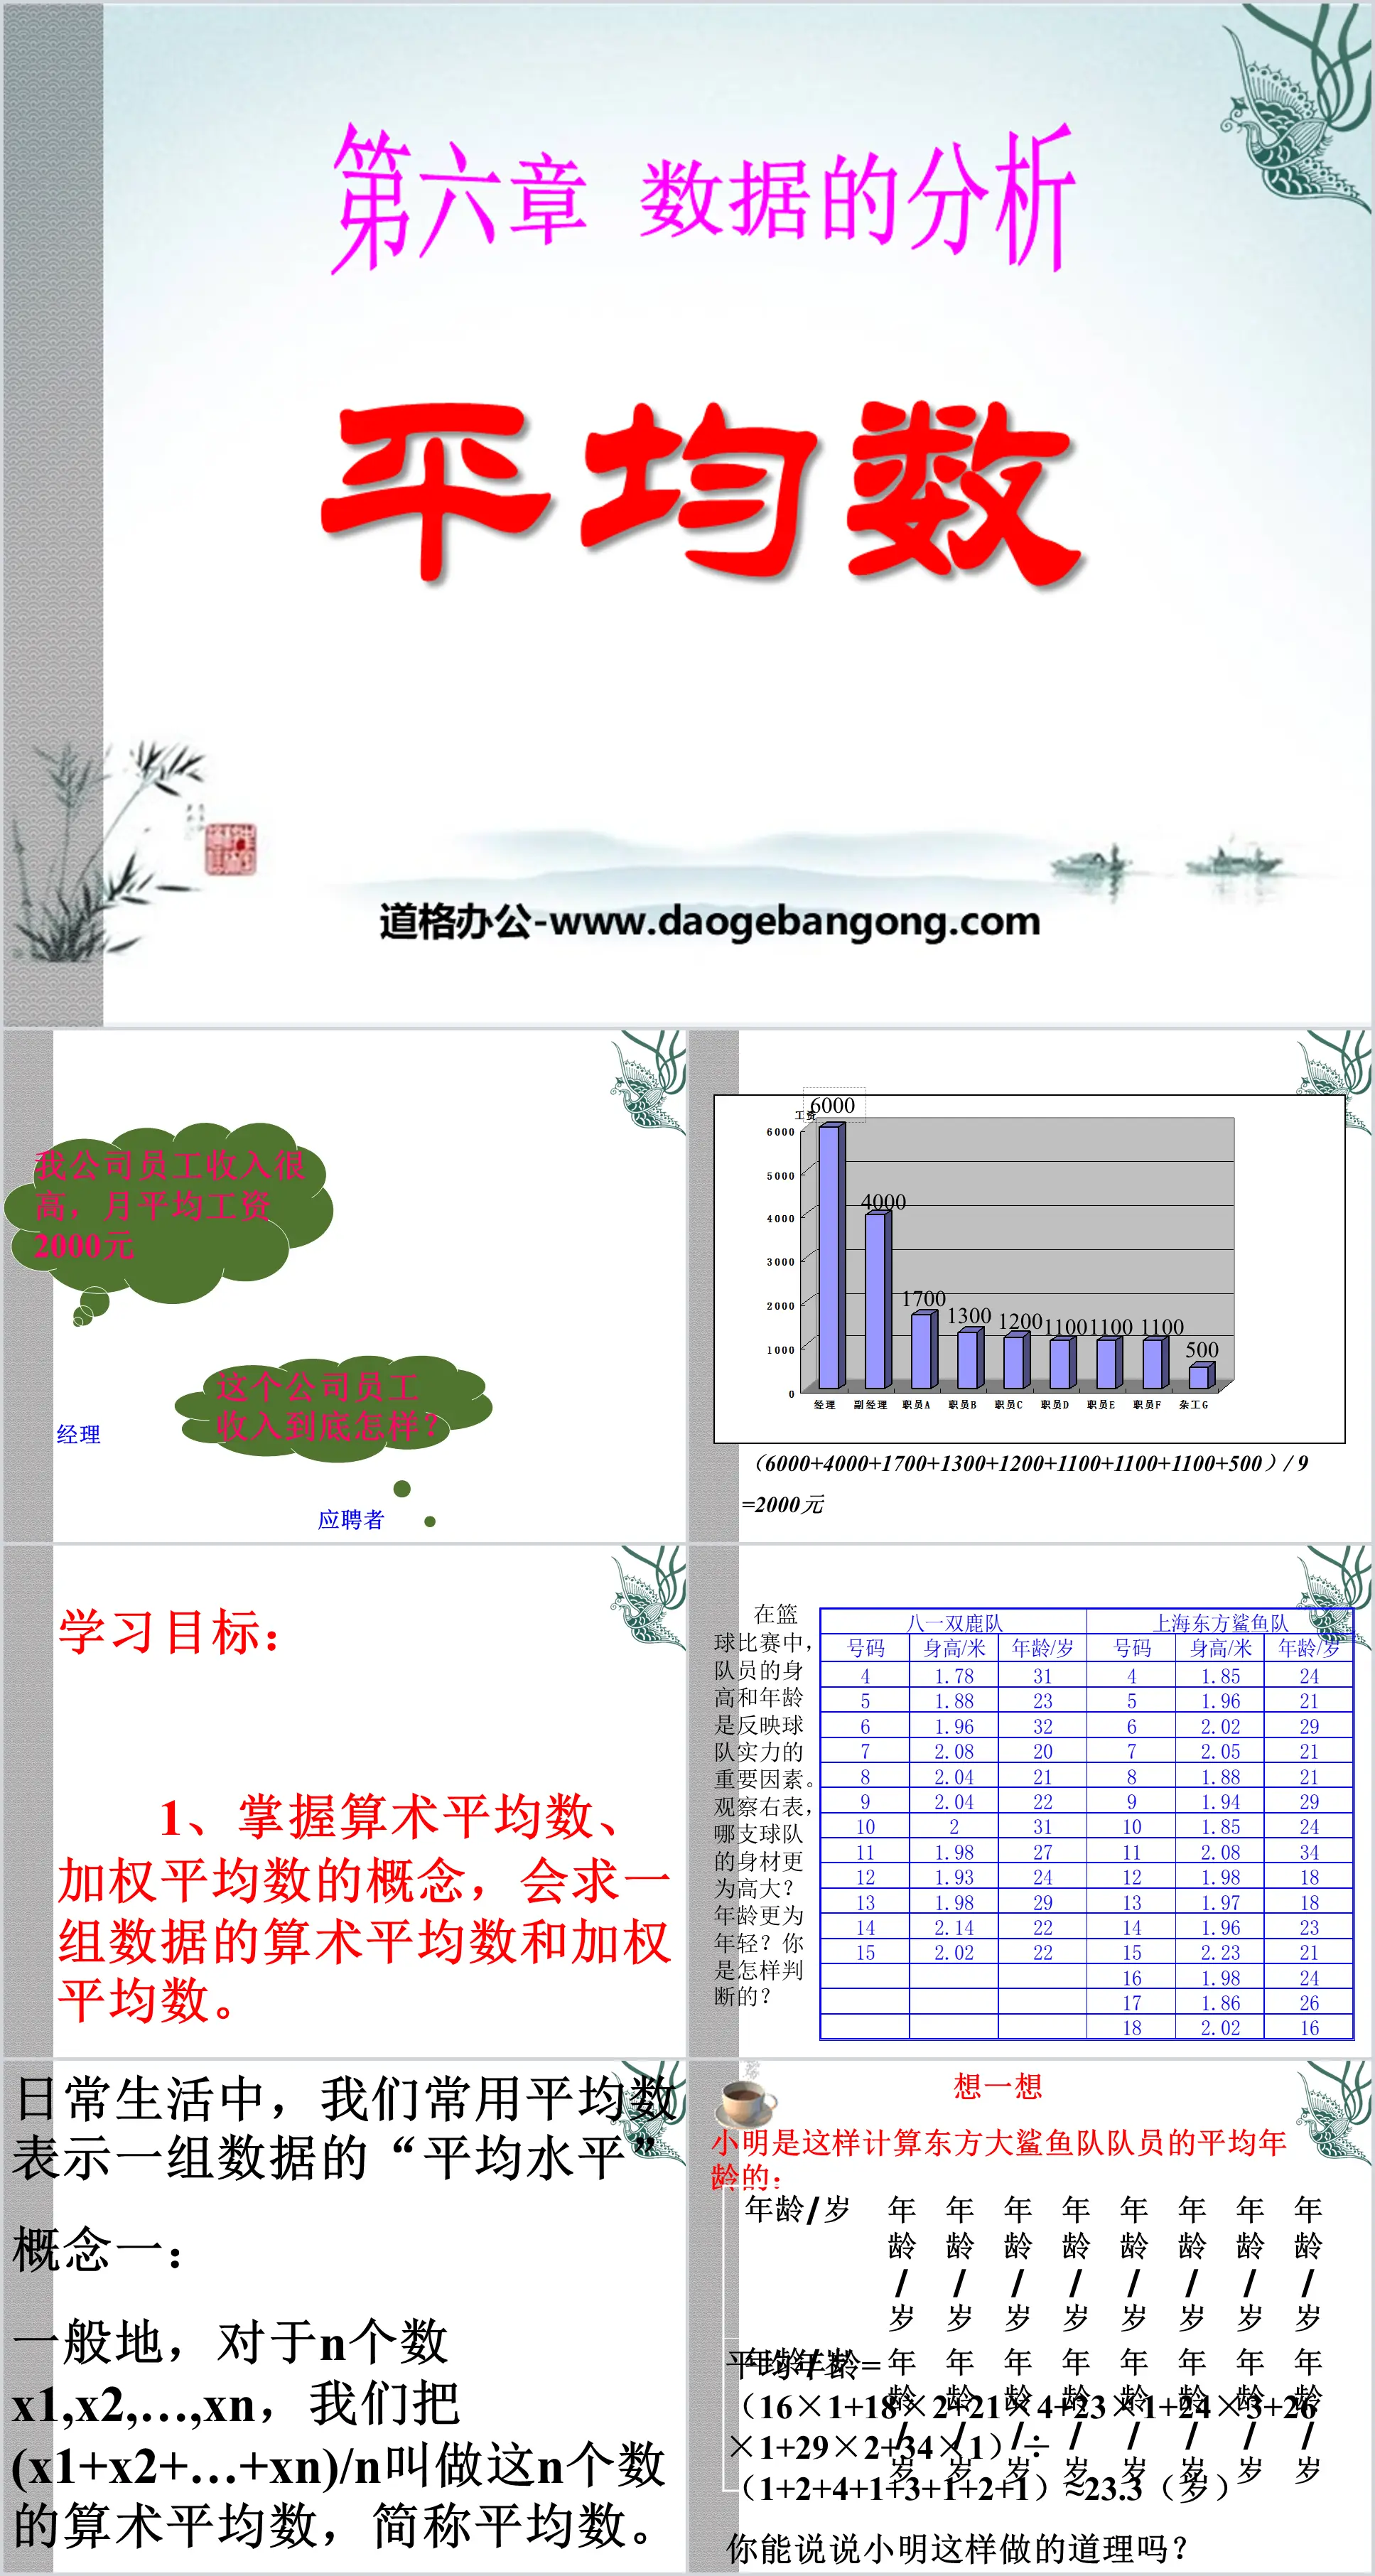
learning target:
1. Master the concepts of arithmetic mean and weighted average, and be able to find the arithmetic mean and weighted average of a set of data.
2. Understand the connection and difference between arithmetic mean and weighted average, and be able to use them to solve some practical problems.
Key points: The concepts of arithmetic mean and weighted average; how to find the arithmetic mean and formal weighted average of a set of data.
Difficulty: How to find the weighted average.
In daily life, we often use average to express the "average level" of a set of data.
Concept 1: Generally, for n numbers x1, x2,...,xn, we call (x1+x2+...+xn)/n the arithmetic mean of these n numbers, or the average for short.
(1) The average score of A is (72+50+88)/3=70 points.
The average score of B is (85+74+45)/3=68 points.
The average score of C is (67+70+67)/3=68 points.
Since 70>68, A will be hired.
(2) The test score of A is
(72×4+50×3+88×1)/(4+3+1)=65.75 points.
B’s test score is (85×4+74×3+45×1)/(4+3+1)=75.875 points.
C’s test score is (67×4+70×3+67×1)/(4+3+1)=68.125 points.
Therefore candidate B will be hired
In practical problems, the "importance" of each data in a set of data may not be the same. Therefore, when calculating this set of data, each data is often given a "weight".
For example, 4 in Example 1 is the right of innovation, 3 is the right of comprehensive knowledge, and 1 is the right of language. And call (72×4+50×3+88×1)/(4+3+1) as the weighted average of A’s three test scores.
Extend and improve
(1) In a certain exam, the average score of 5 students is 82. Except for A, the average score of the other 4 students is 80. Then A’s score is ( )
(A)84 (B) 86 (C) 88 (D) 90
2. If the average of m numbers is x and the average of n numbers is y, then the average of these (m+n) numbers is ( )
A:(x+y)/2 B:(x+y)/(m+n) C:(mx+ny)/(x+y) D:(mx+ny)/(m+n)
3. It is known that the average of data a1, a2, a3 is a, then the average of data 2a1+1, 2a2+1, 2a3+1 is
(A)a (B)2a
(C) 2a+1 (D) 2a/3+1
Keywords: Data analysis courseware, average courseware, Beijing Normal University edition eighth grade mathematics volume 1 PPT courseware, eighth grade mathematics slide courseware download, data analysis PPT courseware download, average PPT courseware download, .ppt format
For more information about the "Analysis of Data Average" PPT courseware, please click the "Analysis of Data ppt Average ppt" tab.
"Average and Weighted Average" PPT courseware 3:
"Average and Weighted Average" PPT courseware 3 (1) Observation and thinking Divide an experimental field into 8 equal areas, each 100m2, and try to plant two different varieties of wheat under the same conditions of soil fertility, fertilizer, management, etc. , the output is as follows: 1. From Figure 261..
"Average and Weighted Average" PPT Courseware 2:
"Average and Weighted Average" PPT Courseware 2 When calculating the weighted average based on the frequency distribution table, the ________ of each group is commonly used in statistics to represent the actual value of each group, and the ______ of each group is regarded as the value in the corresponding group The right of value. 1. (4 points) Among the following sets of data, in the group...
"Average and Weighted Average" PPT courseware:
"Average and Weighted Average" PPT courseware 1. Generally, we call the ratio of the sum of n numbers x1, x2, and xn to n the arithmetic mean of these n numbers. The abbreviated mean is recorded as x and pronounced as x. 2. The importance of each data in a set of data is not necessarily the same...