Western Normal University Edition First Grade Mathematics Volume 1
People's Education Press First Grade Mathematics Volume 1
Beijing Normal University Edition Seventh Grade Mathematics Volume 1
People's Education Press Third Grade Mathematics Volume 1
People's Education Press Second Grade Mathematics Volume 1
Hebei Education Edition Third Grade Mathematics Volume 1
Beijing Normal University Edition Fifth Grade Mathematics Volume 1
Beijing Normal University Edition Seventh Grade Mathematics Volume 2
Hebei Education Edition Seventh Grade Mathematics Volume 2
Qingdao Edition Seventh Grade Mathematics Volume 1
Beijing Normal University Edition Eighth Grade Mathematics Volume 1
People's Education High School Mathematics Edition B Compulsory Course 2
Qingdao Edition Seventh Grade Mathematics Volume 2
Jiangsu Education Edition Fourth Grade Mathematics Volume 1
People's Education Press First Grade Mathematics Volume 2
Qingdao Edition Second Grade Mathematics Volume 2

| Category | Format | Size |
|---|---|---|
| Beijing Normal University Edition Fourth Grade Mathematics Volume 2 | pptx | 6 MB |

"Average" Data Representation and Analysis PPT (Lesson 2)
2024-09-19
Copyright statement: This material is compiled and released by the user of Daoge Resources. The copyright belongs to the author. For commercial use, please contact the copyright owner. If there is any infringement, please contact the webmaster to remove the resource.
Download Points: 0.00
Free Download
Upgrade VIP
Favorite
Views: 4052 / Downloads: 669
Description
"Average" Data Representation and Analysis PPT (Lesson 2)
Part One: Learning Objectives
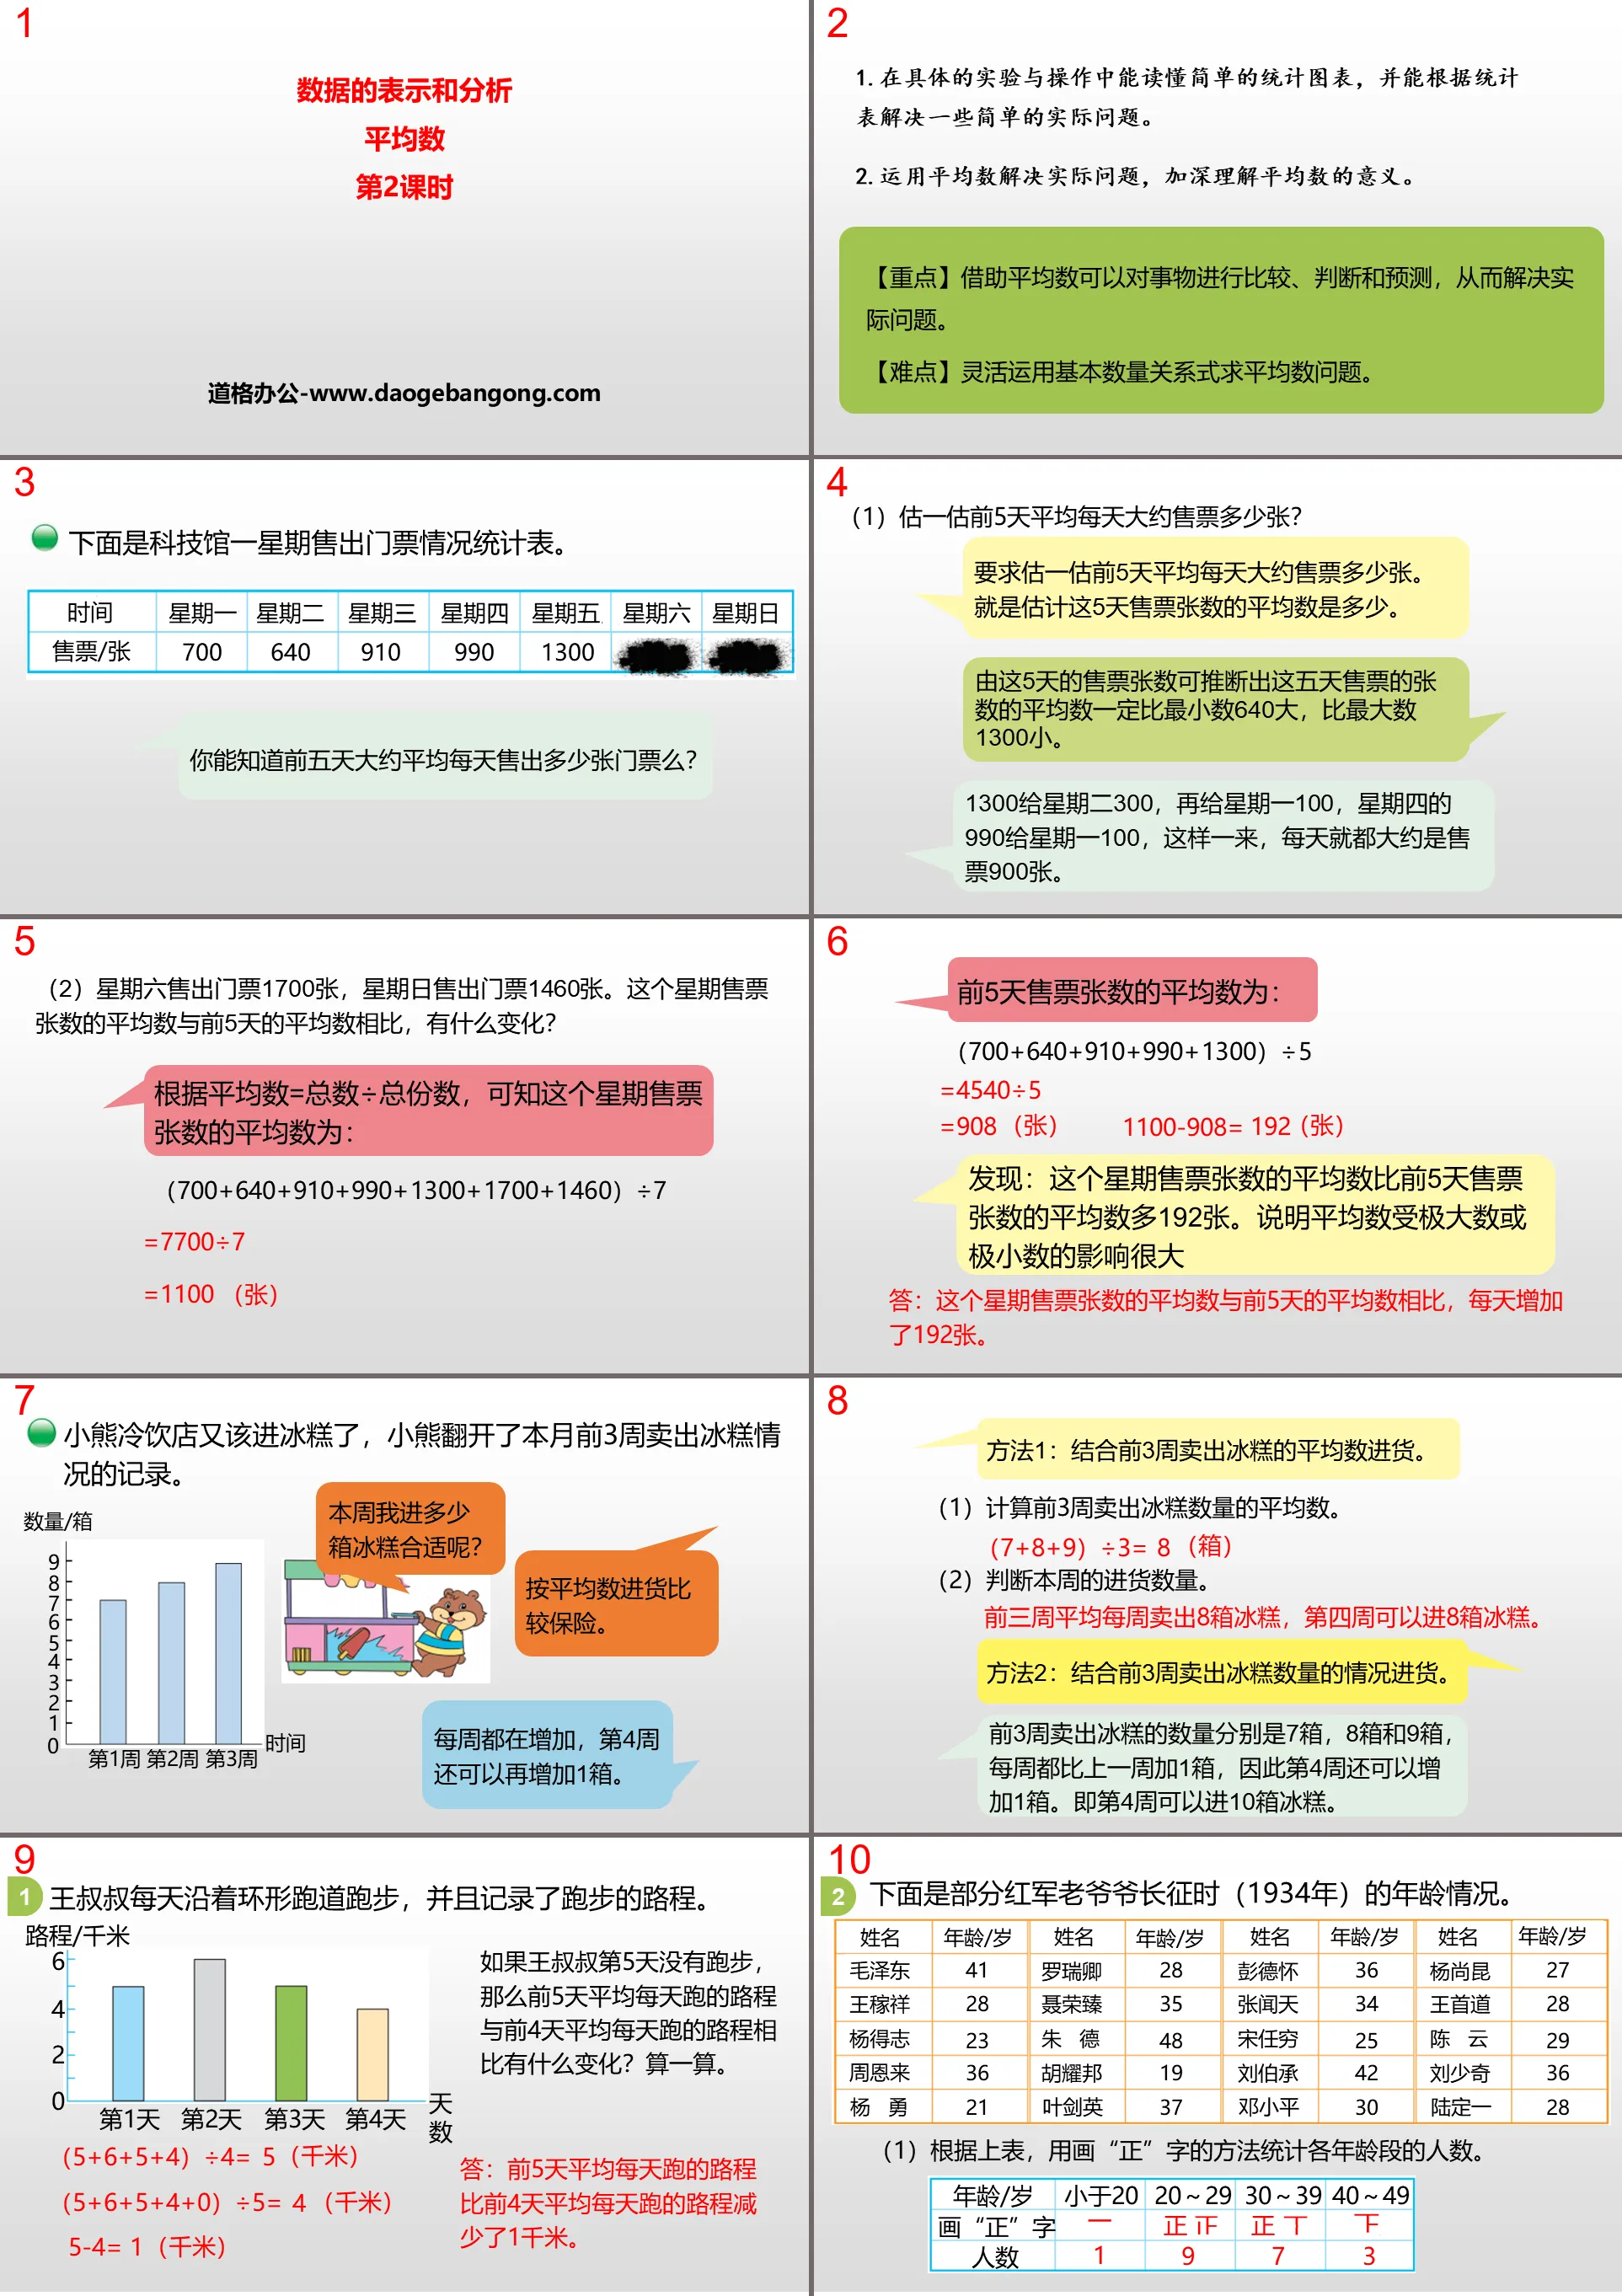
1. Be able to read simple statistical charts in specific experiments and operations, and be able to solve some simple practical problems based on statistical tables.
2. Use averages to solve practical problems and deepen your understanding of the meaning of averages.
[Key Points] Averages can be used to compare, judge and predict things, thereby solving practical problems.
[Difficulty] Flexibly use basic quantitative relationship expressions to find averages.
Average PPT, part 2: exploration of new knowledge
Below is a statistical table of tickets sold by the Science and Technology Museum in one week.
Do you know the approximate average number of tickets sold per day in the past five days?
(1) Estimate the average number of tickets sold per day in the past five days?
Asked to estimate the average number of tickets sold per day in the past five days. It is an estimate of the average number of tickets sold in these five days.
From the number of tickets sold in these five days, it can be inferred that the average number of tickets sold in these five days must be greater than the minimum number of 640 and smaller than the maximum number of 1,300.
1300 is given to 300 for Tuesday, 100 for Monday, 990 for Thursday is given to 100 for Monday. In this way, approximately 900 tickets are sold every day.
(2) 1,700 tickets were sold on Saturday and 1,460 tickets were sold on Sunday. How has the average number of tickets sold this week compared with the average number of the previous five days?
According to the average number = total number ÷ total number of copies, it can be seen that the average number of tickets sold this week is:
(700+640+910+990+1300+1700+1460)÷7
=7700÷7
=1100
Average PPT, Part 3: Classroom Exercises
1. Uncle Wang runs along the circular track every day and records the running distance.
If Uncle Wang did not run on the 5th day, what changes did the average daily distance run in the first 5 days compare with the average daily distance run in the previous 4 days? Do the math.
Answer: The average daily distance run in the first 5 days was 1 kilometer less than the average daily distance run in the previous 4 days.
2. The following is the age of some Red Army veterans during the Long March (1934).
(1) According to the table above, count the number of people in each age group by drawing the word "正".
(2) Draw a statistical chart based on the statistical table.
(3) Answer the questions.
①The oldest among these Red Army grandfathers was __________, who was _________ years old at the time. There are ________ people under the age of 30, accounting for ________ of the surveyed population.
② Without calculation, can you estimate the approximate average age of these Red Army veterans back then?
Yes, the average age of the Red Army grandfathers was about 30 years old.
Average PPT, Part 4: Class Summary
Learn the meaning of average,
Understand the method of finding averages,
Use total quantity ÷ total number of copies,
Solve simple practical problems.
Average PPT, Part 5: Classwork
1. Fill in the blanks.
(1) Mingming read an extracurricular book. He read 17 pages on the first day, 23 pages on the second day, and 20 pages on the third day. He read ( ) pages on average every day.
(2) City Cinema sold 125, 143, 139, 149 and 134 tickets from Monday to Friday respectively. Average number of tickets sold per day during the five days ( )
(3) Uncle Li put the apples picked from three apple trees A, B, and C into 5 baskets. The average weight of each basket was 26 kilograms. It is known that 48 kilograms were picked from tree A and 39 kilograms were picked from tree C. Kilogram, ( ) kilogram was picked from tree B.
2. Single choice questions.
(1) A residential compound counts the electricity consumption of each household this month. Among them, 3 households use 40 kilowatt-hours of electricity, 4 households use 50 kilowatt-hours of electricity, and 5 households use 32 kilowatt-hours of electricity. The average electricity consumption per household is ( ).
A. 47 degrees B. 40 degrees C. 42 degrees
(2) The number of times that 10 students from a certain school participated in charity activities in one school year were 2, 1, 3, 3, 4, 5, 3, 6, 5, and 3 respectively. The average number of this set of data is ( ).
A. 3 B. 3.5 C. 4
(3) The heaviest child in the gifted kindergarten weighs 32.3 kg, and the lightest one weighs 23.6 kg. The average weight of these children may be ( ).
A. 34.5 kg B. 29.8 kg C. 21.4 kg
Keywords: Free download of Beijing Normal University version of fourth grade mathematics volume 2 PPT courseware, mean PPT download, data representation and analysis PPT download, .PPT format;
For more information about the "Representation and Analysis of Average Data" PPT courseware, please click the Representation and Analysis of Average PPT Data PPT tab.
"Average" data analysis PPT teaching courseware:
"Average" data analysis PPT teaching courseware, 15 pages in total. Part One: Knowledge Points Basic Knowledge Point 1 Arithmetic mean 1. The average of a column of numbers 4,5,6,4,4,7, x is 5, then the value of x is (B) A.4 B.5 C.6 D.7 2. (Original) A set of known...
"Average" data analysis PPT download (Lesson 2):
"Average" data analysis PPT download (Lesson 2), 15 pages in total. Part 1: Calculation of type weighted average of numbers 1. 1,500 fish of a certain species were stocked in the fish pond of Lao Wang's family. After a few years, they were going to be salvaged and sold. In order to estimate the number of fish in the fish pond...
"Average" data analysis PPT download (Lesson 1):
"Average" data analysis PPT download (Lesson 1), 24 pages in total. The first part of the content: Learning objectives Arithmetic mean Weighted average (weight expressed in proportion or percentage) ... ... ... Average PPT, the second part of the content: Understanding new knowledge Knowledge points...
File Info
Update Time: 2024-09-19
This template belongs to Mathematics courseware Beijing Normal University Edition Fourth Grade Mathematics Volume 2 industry PPT template
"Average" Data Representation and Analysis PPT (Lesson 2) Simple campus recruitment activity planning plan summary enterprise and institution recruitment publicity lecture PPT template is a general PPT template for business post competition provided by the manuscript PPT, simple campus recruitment activity planning plan summary enterprise and institution recruitment promotion Lecture PPT template, you can edit and modify the text and pictures in the source file by downloading the source file. If you want more exquisite business PPT templates, you can come to grid resource. Doug resource PPT, massive PPT template slide material download, we only make high-quality PPT templates!
Tips: If you open the template and feel that it is not suitable for all your needs, you can search for related content "Average" Data Representation and Analysis PPT (Lesson 2) is enough.
How to use the Windows system template
Directly decompress the file and use it with office or wps
How to use the Mac system template
Directly decompress the file and use it Office or wps can be used
Related reading
For more detailed PPT-related tutorials and font tutorials, you can view: Click to see
How to create a high-quality technological sense PPT? 4 ways to share the bottom of the box
Notice
Do not download in WeChat, Zhihu, QQ, built-in browsers, please use mobile browsers to download! If you are a mobile phone user, please download it on your computer!
1. The manuscript PPT is only for study and reference, please delete it 24 hours after downloading.
2. If the resource involves your legitimate rights and interests, delete it immediately.
3. Contact information: service@daogebangong.com
"Average" Data Representation and Analysis PPT (Lesson 2), due to usage restrictions, it is only for personal study and reference use. For commercial use, please go to the relevant official website for authorization.
(Personal non-commercial use refers to the use of this font to complete the display of personal works, including but not limited to the design of personal papers, resumes, etc.)
Preview
Related Search:
"Average" Data Representation and Analysis PPT (Lesson 2)
2024-09-19
Copyright statement: This material is compiled and released by the user of Daoge Resources. The copyright belongs to the author. For commercial use, please contact the copyright owner. If there is any infringement, please contact the webmaster to remove the resource.
Download Points: 0.00
Free Download
Upgrade VIP
Favorite
Views: 4052 / Downloads: 669


