
"Analyzing the Central Tendency of Data from Statistical Charts" Data Analysis PPT Simple campus recruitment activity planning plan summary enterprise and institution recruitment publicity lecture PPT template is a general PPT template for business post competition provided by the manuscript PPT, simple campus recruitment activity planning plan summary enterprise and institution recruitment promotion Lecture PPT template, you can edit and modify the text and pictures in the source file by downloading the source file. If you want more exquisite business PPT templates, you can come to grid resource. Doug resource PPT, massive PPT template slide material download, we only make high-quality PPT templates!
| 文件名 如何下载使用 | 下载次数 | Download Points | 下载地址 |
|---|---|---|---|
| "Analyzing the Central T... | 5025次 | 0.00 | Free Download |
Tips: If you open the template and feel that it is not suitable for all your needs, you can search for related content "Analyzing the Central Tendency of Data from Statistical Charts" Data Analysis PPT is enough.
How to use the Windows system template
Directly decompress the file and use it with office or wps
How to use the Mac system template
Directly decompress the file and use it Office or wps can be used
Related reading
For more detailed PPT-related tutorials and font tutorials, you can view: Click to see
How to create a high-quality technological sense PPT? 4 ways to share the bottom of the box
Notice
Do not download in WeChat, Zhihu, QQ, built-in browsers, please use mobile browsers to download! If you are a mobile phone user, please download it on your computer!
1. The manuscript PPT is only for study and reference, please delete it 24 hours after downloading.
2. If the resource involves your legitimate rights and interests, delete it immediately.
3. Contact information: service@daogebangong.com
"Analyzing the Central Tendency of Data from Statistical Charts" Data Analysis PPT, due to usage restrictions, it is only for personal study and reference use. For commercial use, please go to the relevant official website for authorization.
(Personal non-commercial use refers to the use of this font to complete the display of personal works, including but not limited to the design of personal papers, resumes, etc.)
Related reading
For more detailed PPT-related tutorials and font tutorials, you can view:Please click to see


Authoritative PPT Summary
"Analyzing the Central Trend of Data from Statistical Charts" Data Analysis PPT, 24 pages in total.
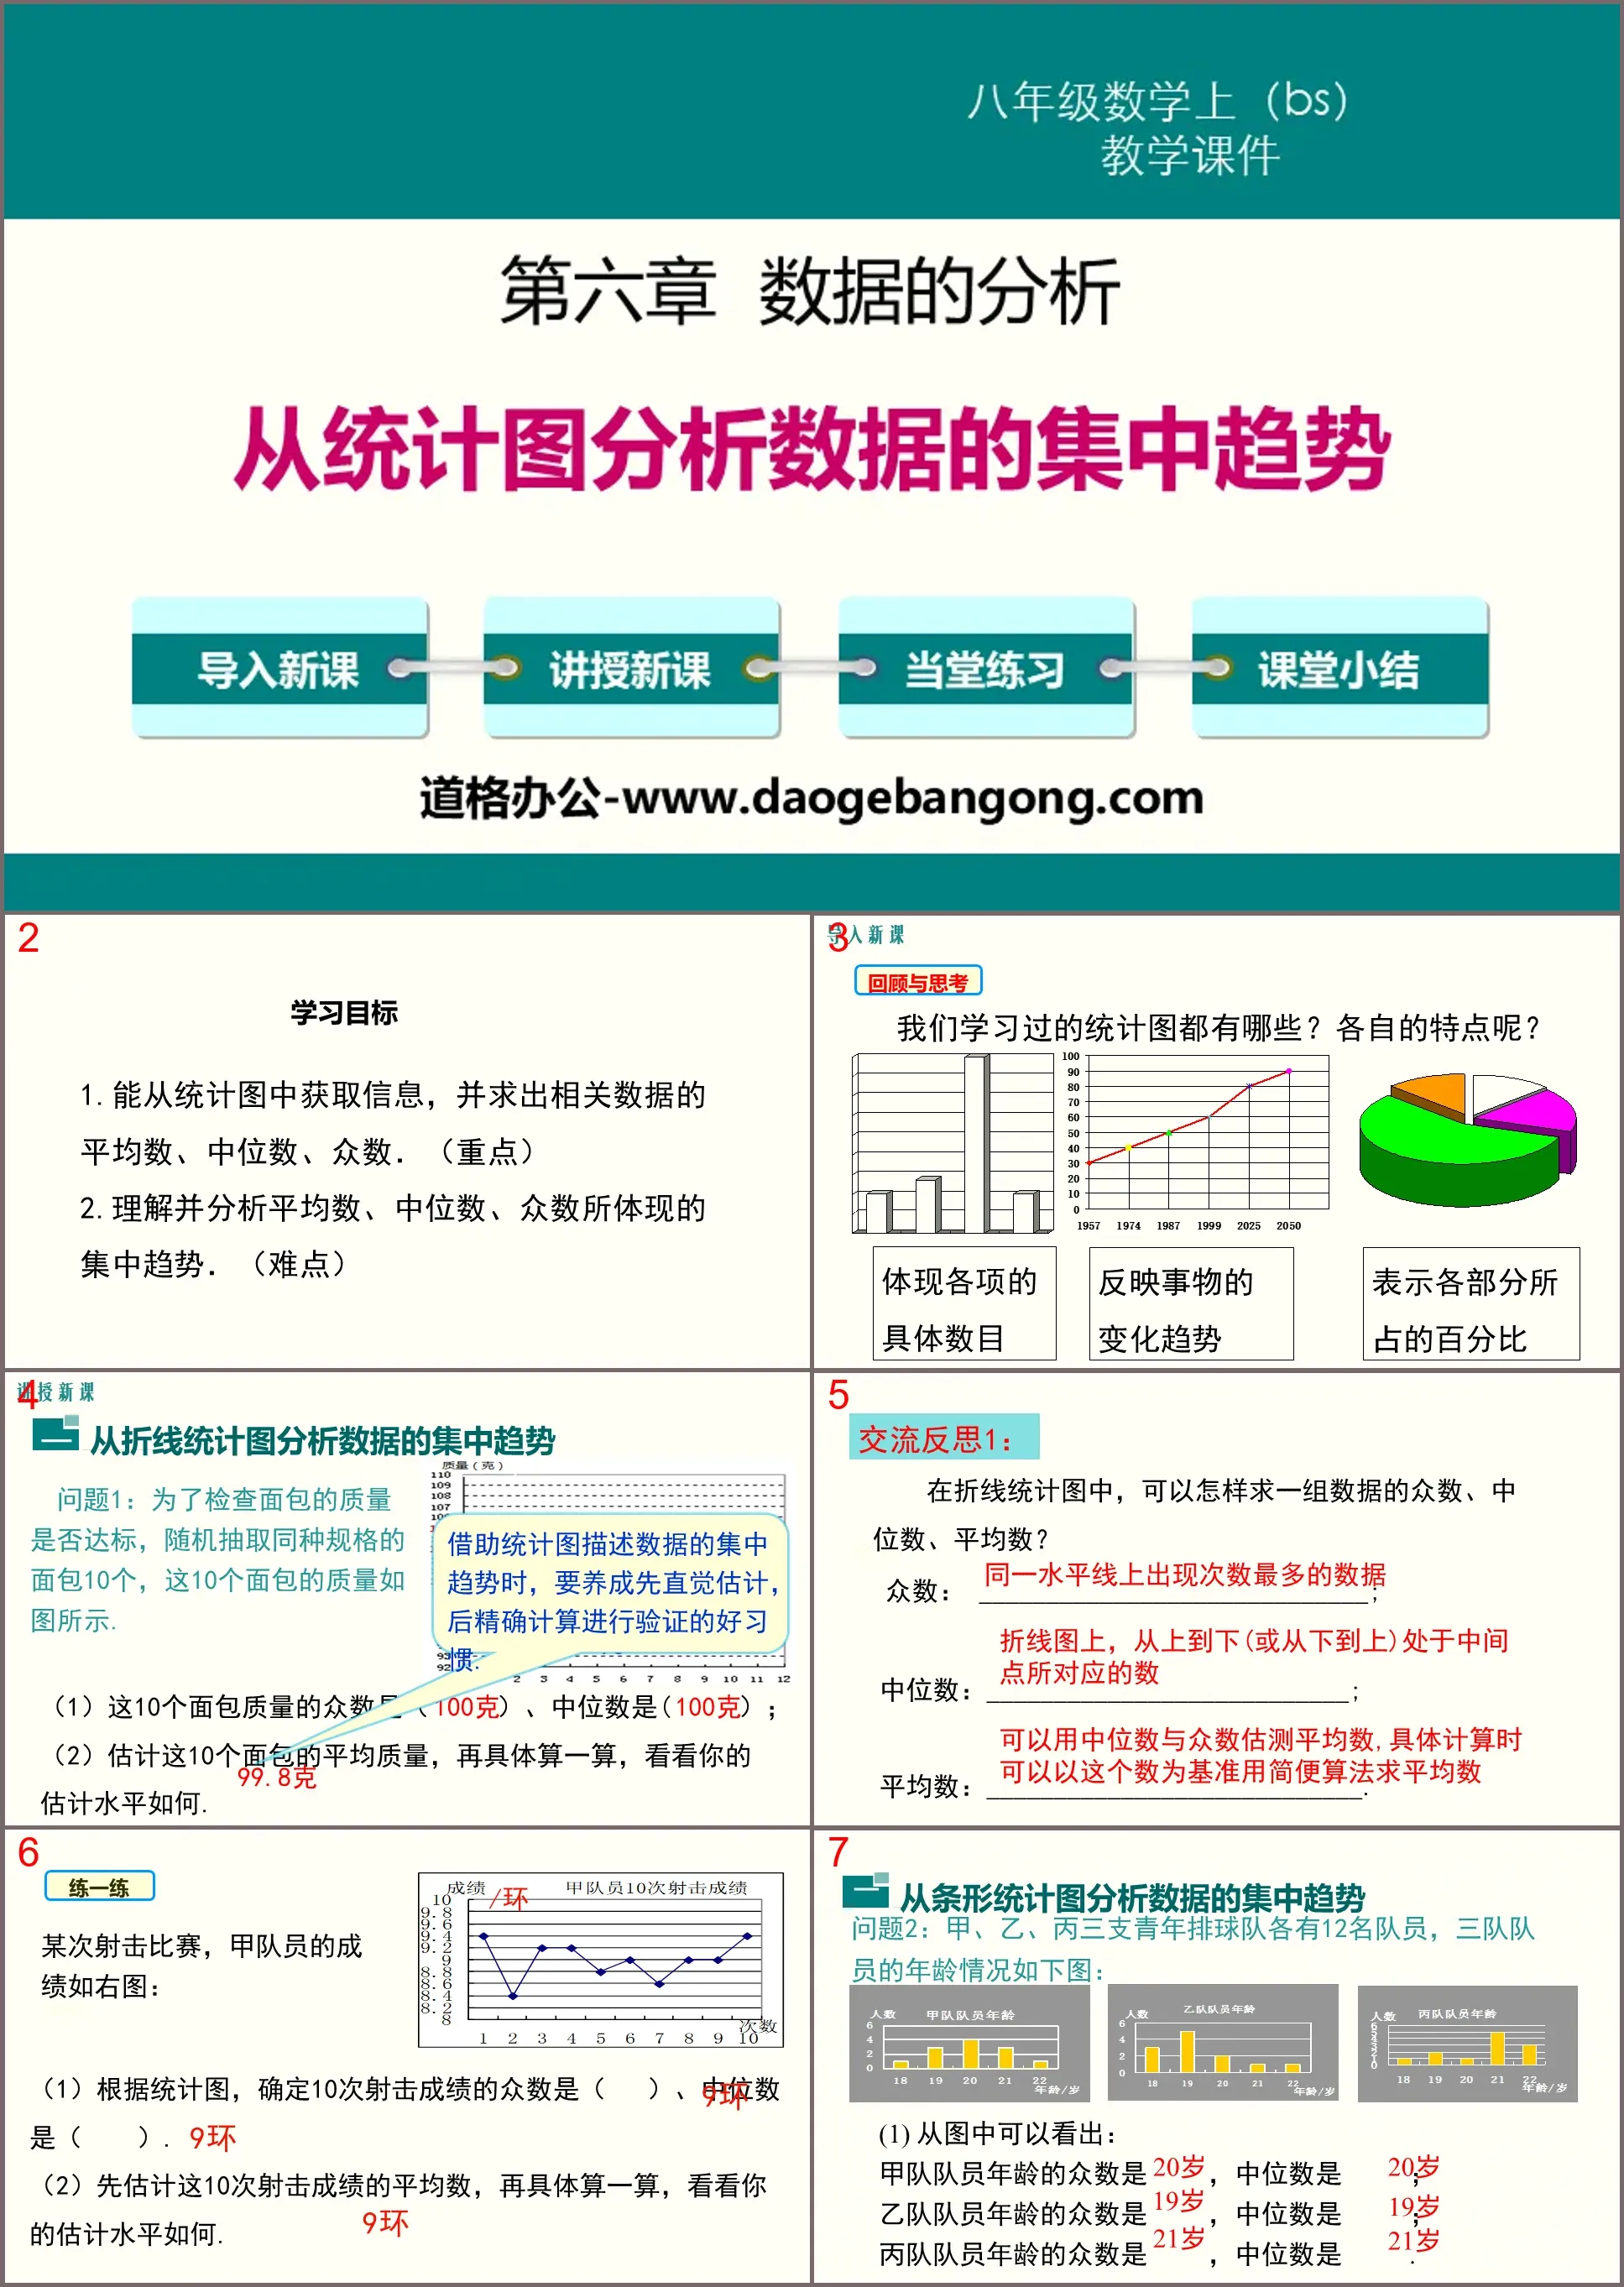
Part One: Learning Objectives
1. Able to obtain information from statistical charts and find the average, median, and mode of relevant data. (emphasis)
2. Understand and analyze the central tendency reflected in the mean, median, and mode. (difficulty)
Analyzing the central tendency of data from statistical charts PPT, part 2: teaching new lessons
Analyze the central tendency of data from line charts
Question 1: In order to check whether the quality of bread meets the standard, 10 breads of the same specifications are randomly selected. The quality of these 10 breads is as shown in the picture.
(1) The mode of the quality of these 10 breads is ( ) and the median is ( );
(2) Estimate the average quality of these 10 loaves, and then calculate it specifically to see how good your estimate is.
Analyze the central tendency of data from bar charts
Question 2: The three youth volleyball teams A, B, and C each have 12 members. The ages of the members of the three teams are as follows:
(1) It can be seen from the figure:
The mode of age of team A members is ______, and the median is ______;
The mode of age of team B members is ______, and the median is ______;
The mode of the age of team C members is ______, and the median is ______.
Analyze the central tendency of data from statistical charts PPT, part three: practice in class
1. In order to understand the development of the "National Fitness" activity in a certain community, a volunteer made statistics on the physical exercise time of 50 adults living in the community for a week, and drew a bar chart as shown in the figure. According to the information provided in the figure, the mode and median of the physical exercise time of these 50 people in a week are ( )
(A) 6 hours, 6 hours (B) 6 hours, 4 hours
(C) 4 hours, 4 hours (D) 4 hours, 6 hours
2. In a charity donation, 40 students in a certain class took out their pocket money, and some donated 5 yuan, 10 yuan, 20 yuan, and 50 yuan. Figure 7 reflects the proportion of people donating in different ways. Then the number of students in this class The average donation per student is _________ yuan, the median is ______ yuan, and the mode is _________ yuan.
Analyze the central tendency of data from statistical charts PPT, Part 4: Class summary
Line chart
bar chart
fan chart
Keywords: Free download of Beijing Normal University edition eighth-grade mathematics PPT courseware for the first volume, PPT download of central tendency analysis of data from statistical charts, PPT download of data analysis, .PPT format;
For more information about the PPT courseware "Data Analysis to Analyze the Central Tendency of Data from Statistical Charts", please click the Data Analysis PPT to Analyze the Central Tendency of Data from Statistical Charts PPT tag.
"Analyzing the Central Trend of Data from Statistical Charts" Data Analysis PPT Teaching Courseware:
"Analyzing the Central Trend of Data from Statistical Charts" Data Analysis PPT Teaching Courseware Part One Content: Basic Knowledge Points Analyzing the Central Trend of Data from Statistical Charts 1. A teacher in the class he teaches in order to understand the students' weekend study time Random checks...
"Analyzing the Central Tendency of Data from Statistical Charts" Data analysis PPT download:
"Analyzing the Central Tendency of Data from Statistical Charts" data analysis PPT download, 24 pages in total. Part One: Learning Objectives Obtain data information from line charts Obtain data information from bar charts (frequency histograms) Fan charts ... ... ... ... ..
"Analyzing the Central Trend of Data from Statistical Charts" Data Analysis PPT Courseware 2:
"Analyzing the Central Trend of Data from Statistical Charts" Data Analysis PPT Courseware 2 Teaching Objectives: 1. Experience the activities of analyzing the central tendency of data from statistical charts, establish data intuition, and develop geometric intuition. 2. Can be obtained from statistical charts such as bar charts and fan charts.