| Category | Format | Size |
|---|---|---|
| Beijing Normal University Edition Eighth Grade Mathematics Volume 1 | pptx | 6 MB |

"Dispersion Degree of Data" Data Analysis PPT Download (Lesson 1)
Description
"The Dispersion Degree of Data" Data Analysis PPT Download (Lesson 1), 32 pages in total.
Part 1: New Knowledge
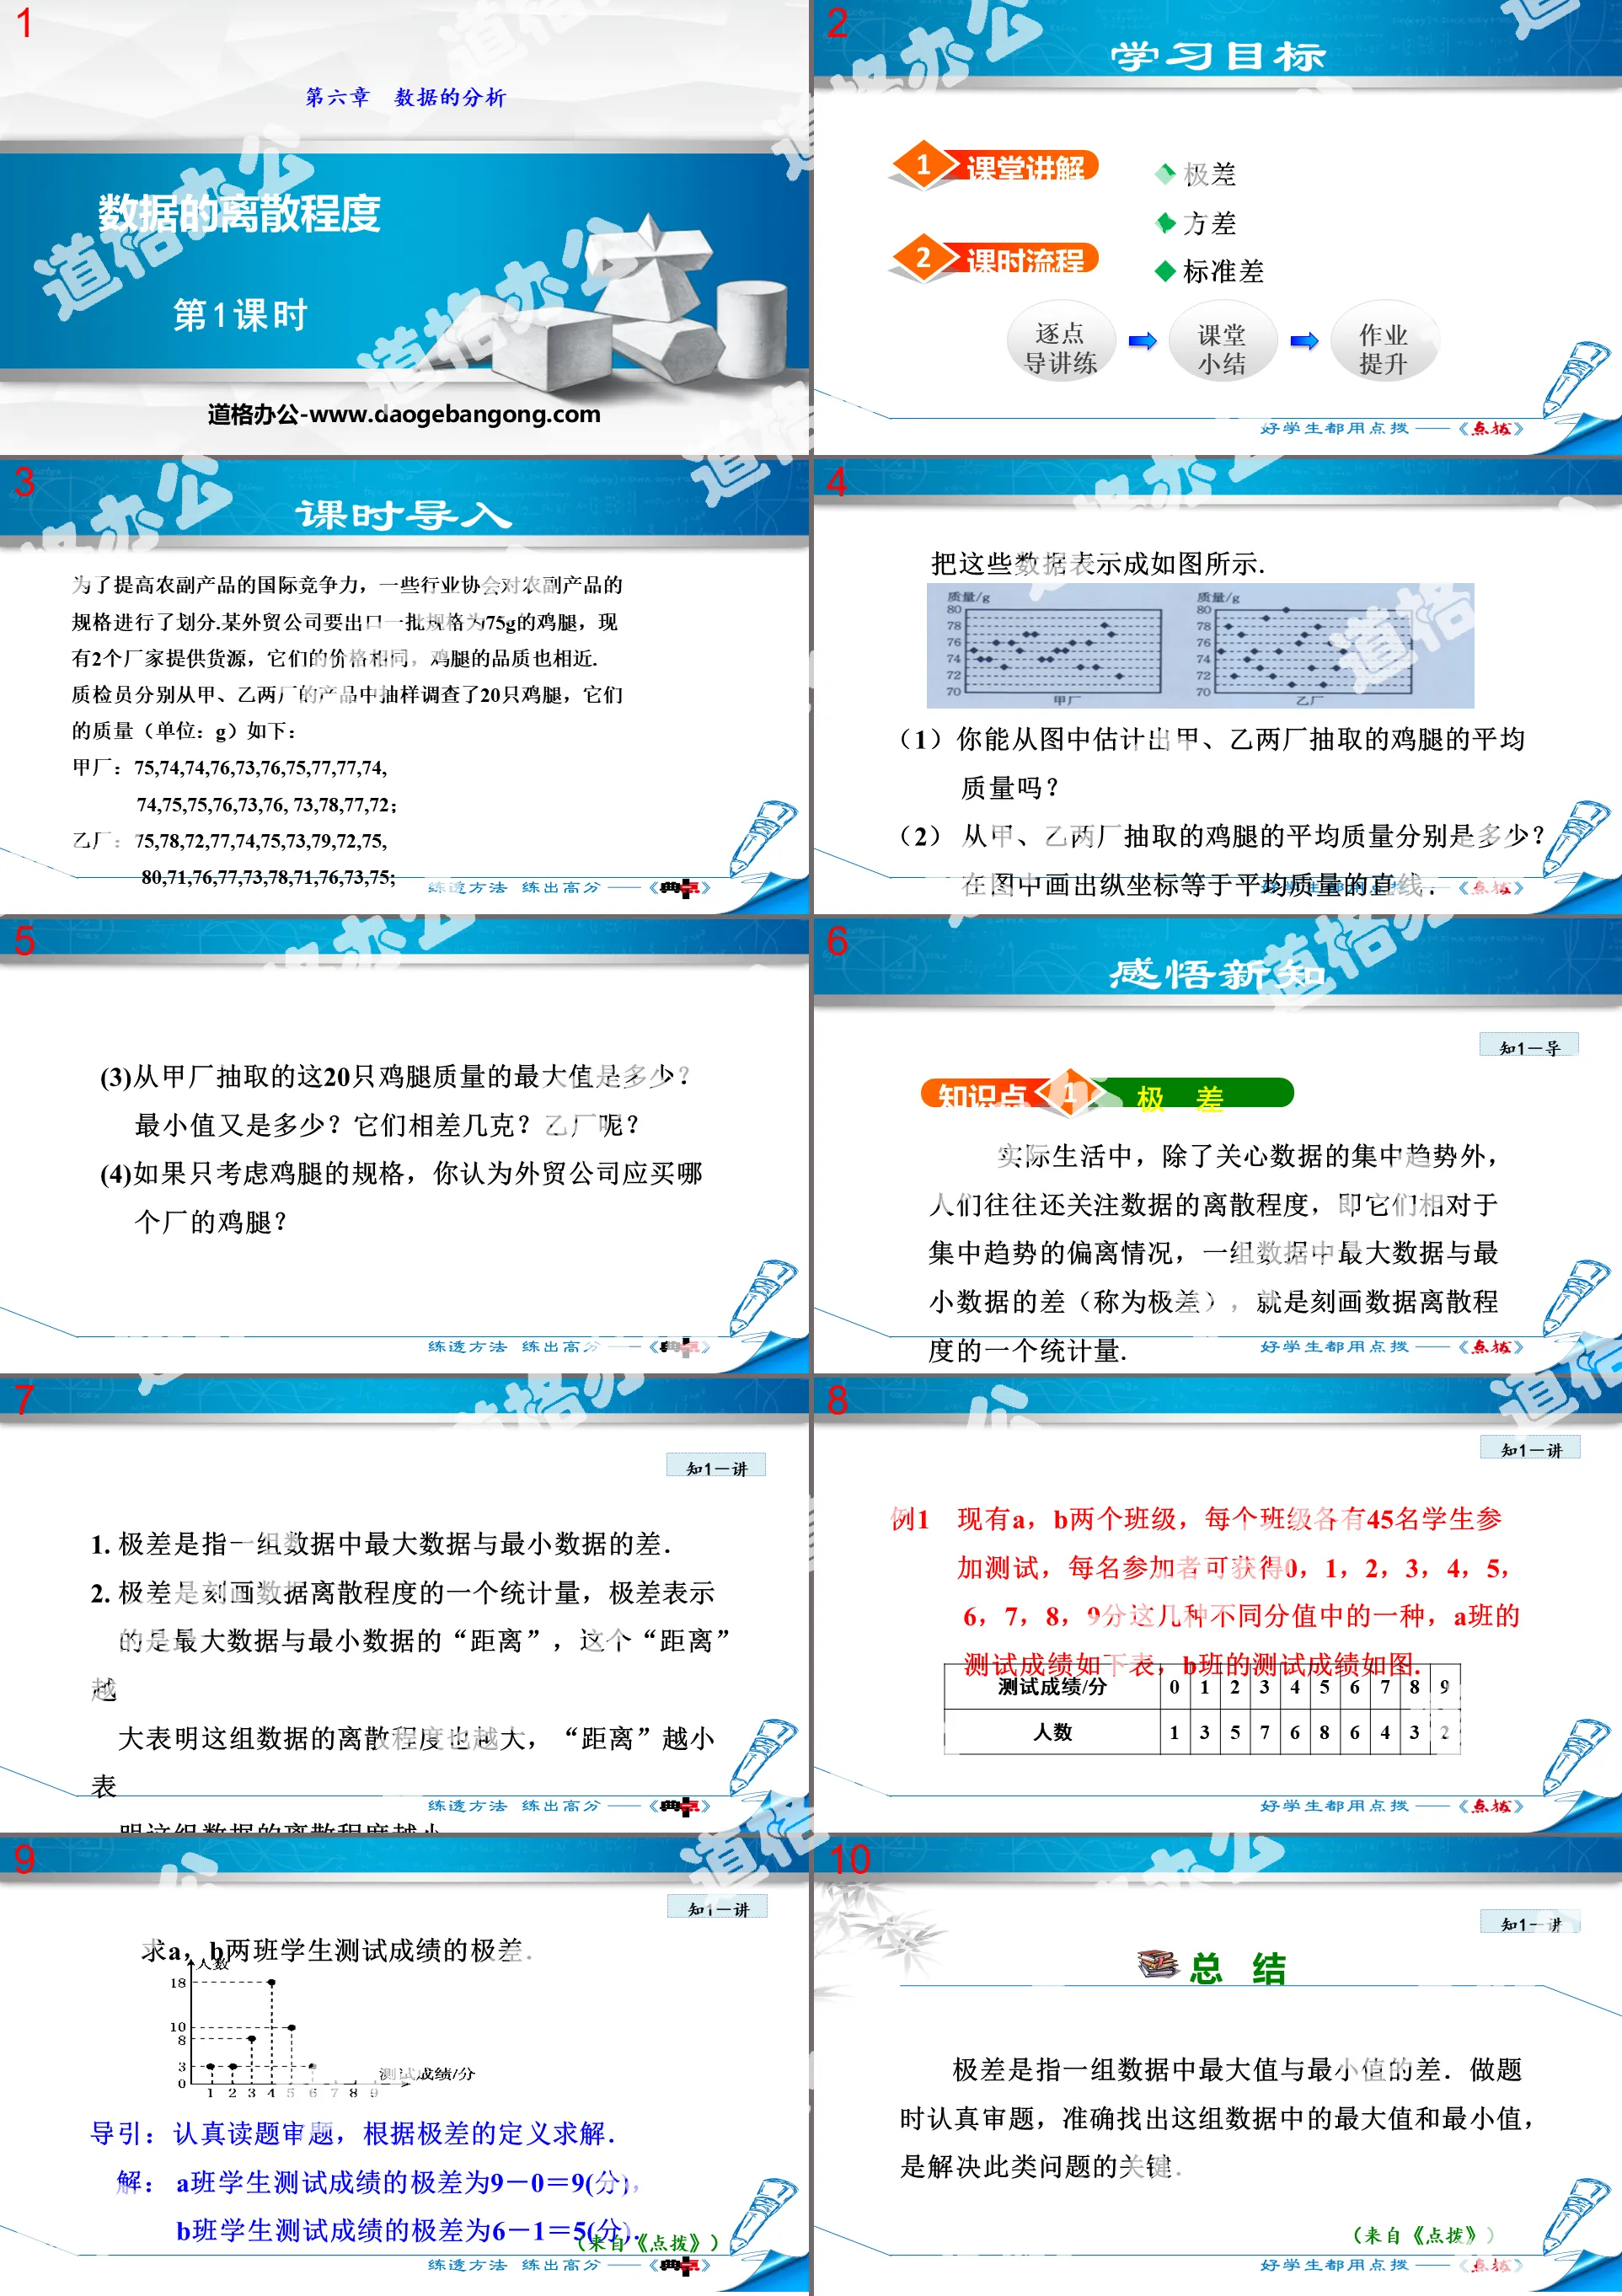
Knowledge points extremely poor
In real life, in addition to caring about the central tendency of the data, people often also pay attention to the degree of dispersion of the data, that is, their deviation from the central tendency. The difference between the largest data and the smallest data in a set of data (called the range) is A statistic that describes the degree of dispersion of data.
Knowledge point variance
Do it
If Factory C also participates in the competition, sample from this factory
20 chicken legs were investigated and the data are shown in the figure.
(1) What are the average and range of the quality of these 20 chicken legs in Factory C?
(2) How to describe the difference between the quality of the 20 chicken legs in Factory C and its average number? Calculate the difference between the quality of 20 chicken legs from factories A and C and their corresponding averages.
(3) Among the two factories A and C, which factory do you think the quality of chicken legs meets the requirements better? Why?
Dispersion degree of data PPT, part 2 content: Class summary
1. Variance is an important statistic used to measure the fluctuation of a set of data. It reflects the fluctuation of data around the mean. For two sets of data of the same problem, the greater the variance, the greater the fluctuation of the data. The smaller the variance, the smaller the data. The smaller the fluctuation; the sample variance is often used in statistics to estimate the population variance.
2. The range is the difference between the largest data and the smallest data in a set of data. Range can reflect the range of changes in data and is the simplest measure of data fluctuations.
3. The standard deviation is the arithmetic square root of the variance.
Keywords: Free download of Beijing Normal University edition eighth-grade mathematics PPT courseware for volume 1, data discreteness PPT download, data analysis PPT download, .PPT format;
For more information about the "Data Analysis and Dispersion Degree of Data" PPT courseware, please click on the Data Analysis PPT and Data Dispersion Degree PPT tab.
"The Dispersion Degree of Data" Data Analysis PPT Teaching Courseware:
"The Dispersion Degree of Data" data analysis PPT teaching courseware, 14 pages in total. Part One: Knowledge Points Basic Knowledge Point 1 Range and Variance 1. The range of a set of data 15-20-1 is (C) A.5 B.6 C.7 D.8 2. A, B, C The four players, Ding and Ding each...
"Dispersion Degree of Data" Data Analysis PPT Download (Lesson 2):
"The Dispersion Degree of Data" Data Analysis PPT Download (Lesson 2), 12 pages in total. Part One: Type Analysis, Type, Comprehensive Application of Variance and Average 1. [2016 Inner Mongolia] A shooting team selects one person from two athletes A and B to participate in the national...
"Dispersion Degree of Data" Data Analysis PPT:
"Dispersion Degree of Data" Data Analysis PPT, 23 pages in total. Part One: Learning Objectives 1. Understand the meaning of range and master the calculation method of range. (Key points) 2. Understand the meaning of variance and standard deviation, and be able to use sample variance and standard deviation to estimate the population square...
File Info
Update Time: 2024-07-22
This template belongs to Mathematics courseware Beijing Normal University Edition Eighth Grade Mathematics Volume 1 industry PPT template
"Dispersion Degree of Data" Data Analysis PPT Download (Lesson 1) Simple campus recruitment activity planning plan summary enterprise and institution recruitment publicity lecture PPT template is a general PPT template for business post competition provided by the manuscript PPT, simple campus recruitment activity planning plan summary enterprise and institution recruitment promotion Lecture PPT template, you can edit and modify the text and pictures in the source file by downloading the source file. If you want more exquisite business PPT templates, you can come to grid resource. Doug resource PPT, massive PPT template slide material download, we only make high-quality PPT templates!
Tips: If you open the template and feel that it is not suitable for all your needs, you can search for related content "Dispersion Degree of Data" Data Analysis PPT Download (Lesson 1) is enough.
How to use the Windows system template
Directly decompress the file and use it with office or wps
How to use the Mac system template
Directly decompress the file and use it Office or wps can be used
Related reading
For more detailed PPT-related tutorials and font tutorials, you can view: Click to see
How to create a high-quality technological sense PPT? 4 ways to share the bottom of the box
Notice
Do not download in WeChat, Zhihu, QQ, built-in browsers, please use mobile browsers to download! If you are a mobile phone user, please download it on your computer!
1. The manuscript PPT is only for study and reference, please delete it 24 hours after downloading.
2. If the resource involves your legitimate rights and interests, delete it immediately.
3. Contact information: service@daogebangong.com
"Dispersion Degree of Data" Data Analysis PPT Download (Lesson 1), due to usage restrictions, it is only for personal study and reference use. For commercial use, please go to the relevant official website for authorization.
(Personal non-commercial use refers to the use of this font to complete the display of personal works, including but not limited to the design of personal papers, resumes, etc.)
Preview
Related Search: