Western Normal University Edition First Grade Mathematics Volume 1
Beijing Normal University Edition Seventh Grade Mathematics Volume 1
People's Education Press First Grade Mathematics Volume 1
People's Education Press Third Grade Mathematics Volume 1
People's Education Press Second Grade Mathematics Volume 1
Hebei Education Edition Third Grade Mathematics Volume 1
Beijing Normal University Edition Seventh Grade Mathematics Volume 2
Beijing Normal University Edition Fifth Grade Mathematics Volume 1
Qingdao Edition Seventh Grade Mathematics Volume 1
Beijing Normal University Edition Eighth Grade Mathematics Volume 1
Hebei Education Edition Seventh Grade Mathematics Volume 2
People's Education High School Mathematics Edition B Compulsory Course 2
People's Education Press First Grade Mathematics Volume 2
Jiangsu Education Edition Fourth Grade Mathematics Volume 1
Qingdao Edition Seventh Grade Mathematics Volume 2
Beijing Normal University Edition Fifth Grade Mathematics Volume 2

| Category | Format | Size |
|---|---|---|
| People's Education Press Seventh Grade Mathematics Volume 2 | pptx | 6 MB |

"Statistical Survey" data collection, organization and description PPT download (sampling survey in the second lesson)
2024-09-24
Copyright statement: This material is compiled and released by the user of Daoge Resources. The copyright belongs to the author. For commercial use, please contact the copyright owner. If there is any infringement, please contact the webmaster to remove the resource.
Download Points: 0.00
Free Download
Upgrade VIP
Favorite
Views: 1226 / Downloads: 148
Description
"Statistical Survey" data collection, organization and description PPT download (sampling survey in the second lesson)
Part 1: Importing new lessons
Scenario introduction
Is this how Xiaohua buys matches?
One day, his father asked his son Xiaohua to buy a box of matches. Before going out, his father asked his son to buy matches that could strike. Xiaohua took the money and went out. After a while, Xiaohua returned home.
"Can a match be struck and ignited?" Dad asked.
"It can burn it."
"Are you so sure?"
Xiaohua handed over a box of struck matches and said excitedly: "I've tried every one."
Thinking: Is it accurate to get information about whether a match can strike or burn? Is this good?
Statistical survey PPT, part 2: teaching new lessons
sample survey
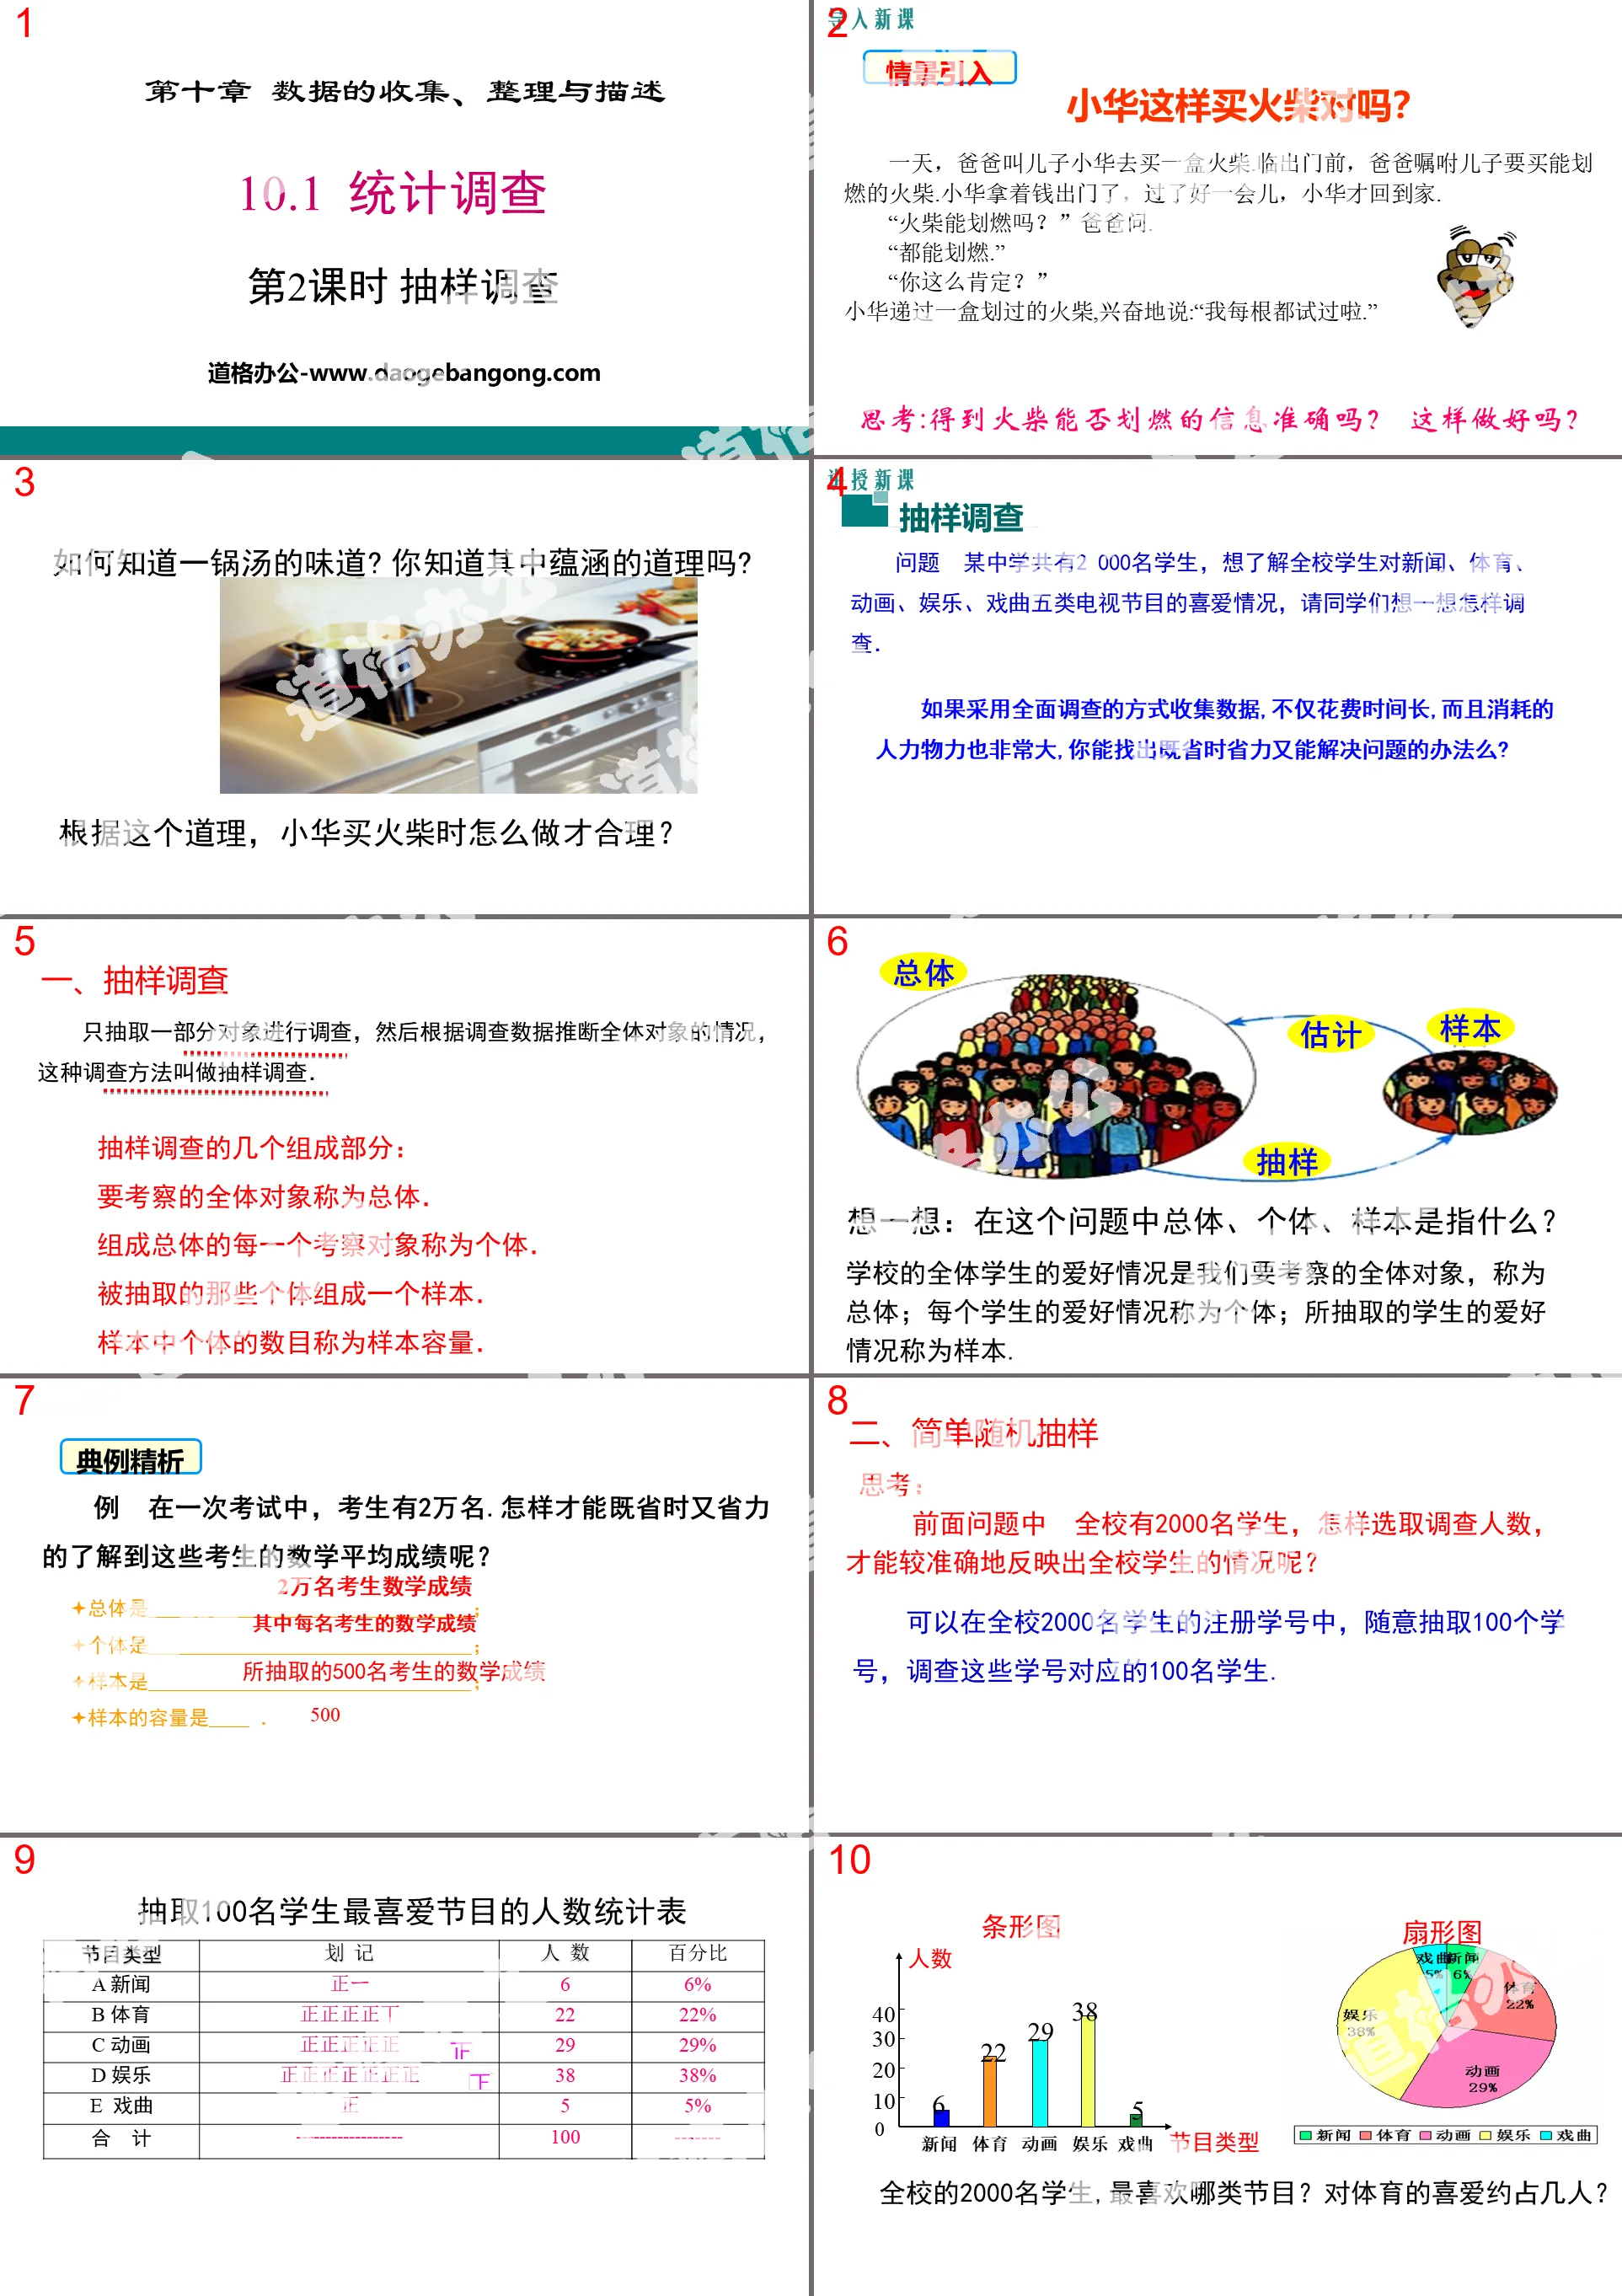
Question: There are 2,000 students in a middle school. I want to know the students’ love for five types of TV programs: news, sports, animation, entertainment, and opera. Please think about how to investigate.
If a comprehensive survey is used to collect data, it will not only take a long time, but also consume a lot of manpower and material resources. Can you find a way to save time and effort and solve the problem?
1. Sampling survey
Only a part of the objects are selected for investigation, and then the situation of all objects is inferred based on the survey data. This investigation method is called sampling survey.
Several components of a sample survey:
The entire object to be investigated is called the overall.
Each object of investigation that makes up the population is called an individual.
The selected individuals form a sample.
The number of individuals in the sample is called the sample size.
Think about it: What do the population, individual, and sample mean in this question?
The hobbies of all students in the school are the entire object we want to examine, which is called the population; the hobbies of each student are called individuals; and the hobbies of the selected students are called samples.
2. Simple random sampling
Thinking: In the previous question, there are 2,000 students in the school. How to select the number of people to be surveyed in order to more accurately reflect the situation of the students in the school?
You can randomly select 100 student numbers from the registered student numbers of 2,000 students in the school, and investigate the 100 students corresponding to these student numbers.
In order for the sample to better reflect the overall situation, in addition to having an appropriate sample size, it is also necessary to try to ensure that each individual has an equal chance of being drawn when drawing.
In the process of selecting samples above, every individual in the population has an equal chance of being selected. A sampling method like this is a simple random sampling.
Sampling survey is a survey method often used in practice. If the sample is properly selected, it can reflect the overall situation well. Otherwise, the results of the sampling survey will deviate from the overall situation.
3. Comparison between comprehensive survey and sample survey
A comprehensive survey collects data through an overall survey, so the survey results obtained are more accurate; but it may require dozens of times or even more manpower, material resources and time to be invested.
Sampling surveys collect data by surveying samples, so there may be some errors between the survey results and the overall results, but they are low investment and easy to operate, and sometimes they can only be investigated by sampling, such as studying the damage of a batch of artillery shells. radius, it is impossible to launch all the cannonballs, so a reasonable sampling survey is a good choice.
Statistical survey PPT, part three: practice in class
1. For the following questions, should we conduct a comprehensive survey or a sample survey?
(1) Investigate whether a certain food additive on the market meets national standards;
(2) Test the air quality of a certain city;
(3) Survey the income of all families in a village;
(4) Investigate people’s awareness of environmental protection;
(5) Investigate the opinions of students in a class on establishing a class English corner;
(6) Investigate people’s enthusiasm for movies shown in cinemas.
2. What investigation method should be used to know the lifespan of a batch of light bulbs?
3. If you want to know the killing radius of a batch of missiles, what investigation method should you use? Why?
Statistical Survey PPT, Part 4: Class Summary
Can you talk about what you learned from this class?
1. Can you give an example of a sample survey and tell what the population and sample are?
2. What are the benefits of using sample surveys to conduct surveys?
Benefits: Save manpower and material resources for investigation,
Disadvantages: There may be errors from actual results.
3. Use the characteristics of the sample to estimate the characteristics of the population.
Keywords: free download of PPT courseware for mathematics in the second volume of the seventh grade of the People's Education Press, download of statistical survey PPT, download of data collection, organization and description PPT, download of sample survey PPT, .PPT format;
For more information about the PPT courseware "Collection, Arrangement and Description of Data Statistical Survey and Sampling Survey", please click the Collection, Arrangement and Description of Data PPT Statistical Survey PPT Sampling Survey PPT tag.
"Statistical Survey" data collection, organization and description PPT download (comprehensive survey in the first lesson):
"Statistical Survey" data collection, arrangement and description PPT download (comprehensive survey in the first lesson) Part 1: Introduction of new lesson situations In the classroom, the teacher asked all the students about a certain topic, and the students raised their hands one after another... .. ... ... Statistical Survey P..
"Statistical Survey" data collection, organization and description PPT courseware (sampling survey in the second lesson):
"Statistical Survey" data collection, arrangement and description PPT courseware (sample survey in the second lesson) Part 1: New Knowledge Analysis Question 2 There are 2,000 students in a school. We want to understand the students' views on news, sports, animation, entertainment, and opera. Five favorite TV shows..
"Statistical Survey" data collection, arrangement and description PPT courseware (comprehensive survey in the first lesson):
"Statistical Survey" data collection, arrangement and description PPT courseware (comprehensive survey in the first lesson) Part One Content: New Lesson Analysis Question 1 If you want to know the whole class's views on the five categories of TV programs: news, sports, animation, entertainment, and opera Like the situation, what would you do...
File Info
Update Time: 2024-09-24
This template belongs to Mathematics courseware People's Education Press Seventh Grade Mathematics Volume 2 industry PPT template
"Statistical Survey" data collection, organization and description PPT download (sampling survey in the second lesson) Simple campus recruitment activity planning plan summary enterprise and institution recruitment publicity lecture PPT template is a general PPT template for business post competition provided by the manuscript PPT, simple campus recruitment activity planning plan summary enterprise and institution recruitment promotion Lecture PPT template, you can edit and modify the text and pictures in the source file by downloading the source file. If you want more exquisite business PPT templates, you can come to grid resource. Doug resource PPT, massive PPT template slide material download, we only make high-quality PPT templates!
Tips: If you open the template and feel that it is not suitable for all your needs, you can search for related content "Statistical Survey" data collection, organization and description PPT download (sampling survey in the second lesson) is enough.
How to use the Windows system template
Directly decompress the file and use it with office or wps
How to use the Mac system template
Directly decompress the file and use it Office or wps can be used
Related reading
For more detailed PPT-related tutorials and font tutorials, you can view: Click to see
How to create a high-quality technological sense PPT? 4 ways to share the bottom of the box
Notice
Do not download in WeChat, Zhihu, QQ, built-in browsers, please use mobile browsers to download! If you are a mobile phone user, please download it on your computer!
1. The manuscript PPT is only for study and reference, please delete it 24 hours after downloading.
2. If the resource involves your legitimate rights and interests, delete it immediately.
3. Contact information: service@daogebangong.com
"Statistical Survey" data collection, organization and description PPT download (sampling survey in the second lesson), due to usage restrictions, it is only for personal study and reference use. For commercial use, please go to the relevant official website for authorization.
(Personal non-commercial use refers to the use of this font to complete the display of personal works, including but not limited to the design of personal papers, resumes, etc.)
Preview
Related Search:
"Statistical Survey" data collection, organization and description PPT download (sampling survey in the second lesson)
2024-09-24
Copyright statement: This material is compiled and released by the user of Daoge Resources. The copyright belongs to the author. For commercial use, please contact the copyright owner. If there is any infringement, please contact the webmaster to remove the resource.
Download Points: 0.00
Free Download
Upgrade VIP
Favorite
Views: 1226 / Downloads: 148


