Western Normal University Edition First Grade Mathematics Volume 1
Beijing Normal University Edition Seventh Grade Mathematics Volume 1
People's Education Press First Grade Mathematics Volume 1
People's Education Press Third Grade Mathematics Volume 1
People's Education Press Second Grade Mathematics Volume 1
Hebei Education Edition Third Grade Mathematics Volume 1
Beijing Normal University Edition Seventh Grade Mathematics Volume 2
Beijing Normal University Edition Fifth Grade Mathematics Volume 1
Qingdao Edition Seventh Grade Mathematics Volume 1
Beijing Normal University Edition Eighth Grade Mathematics Volume 1
Hebei Education Edition Seventh Grade Mathematics Volume 2
People's Education High School Mathematics Edition B Compulsory Course 2
People's Education Press First Grade Mathematics Volume 2
Jiangsu Education Edition Fourth Grade Mathematics Volume 1
Qingdao Edition Seventh Grade Mathematics Volume 2
Beijing Normal University Edition Fifth Grade Mathematics Volume 2

| Category | Format | Size |
|---|---|---|
| People's Education Press Seventh Grade Mathematics Volume 2 | pptx | 6 MB |

"Statistical Survey" data collection, organization and description PPT courseware (sampling survey in the second lesson)
2024-09-30
Copyright statement: This material is compiled and released by the user of Daoge Resources. The copyright belongs to the author. For commercial use, please contact the copyright owner. If there is any infringement, please contact the webmaster to remove the resource.
Download Points: 0.00
Free Download
Upgrade VIP
Favorite
Views: 3941 / Downloads: 161
Description
"Statistical Survey" Data Collection, Arrangement and Description PPT Courseware (Sampling Survey in Lesson 2)
Part I: New Knowledge Analysis
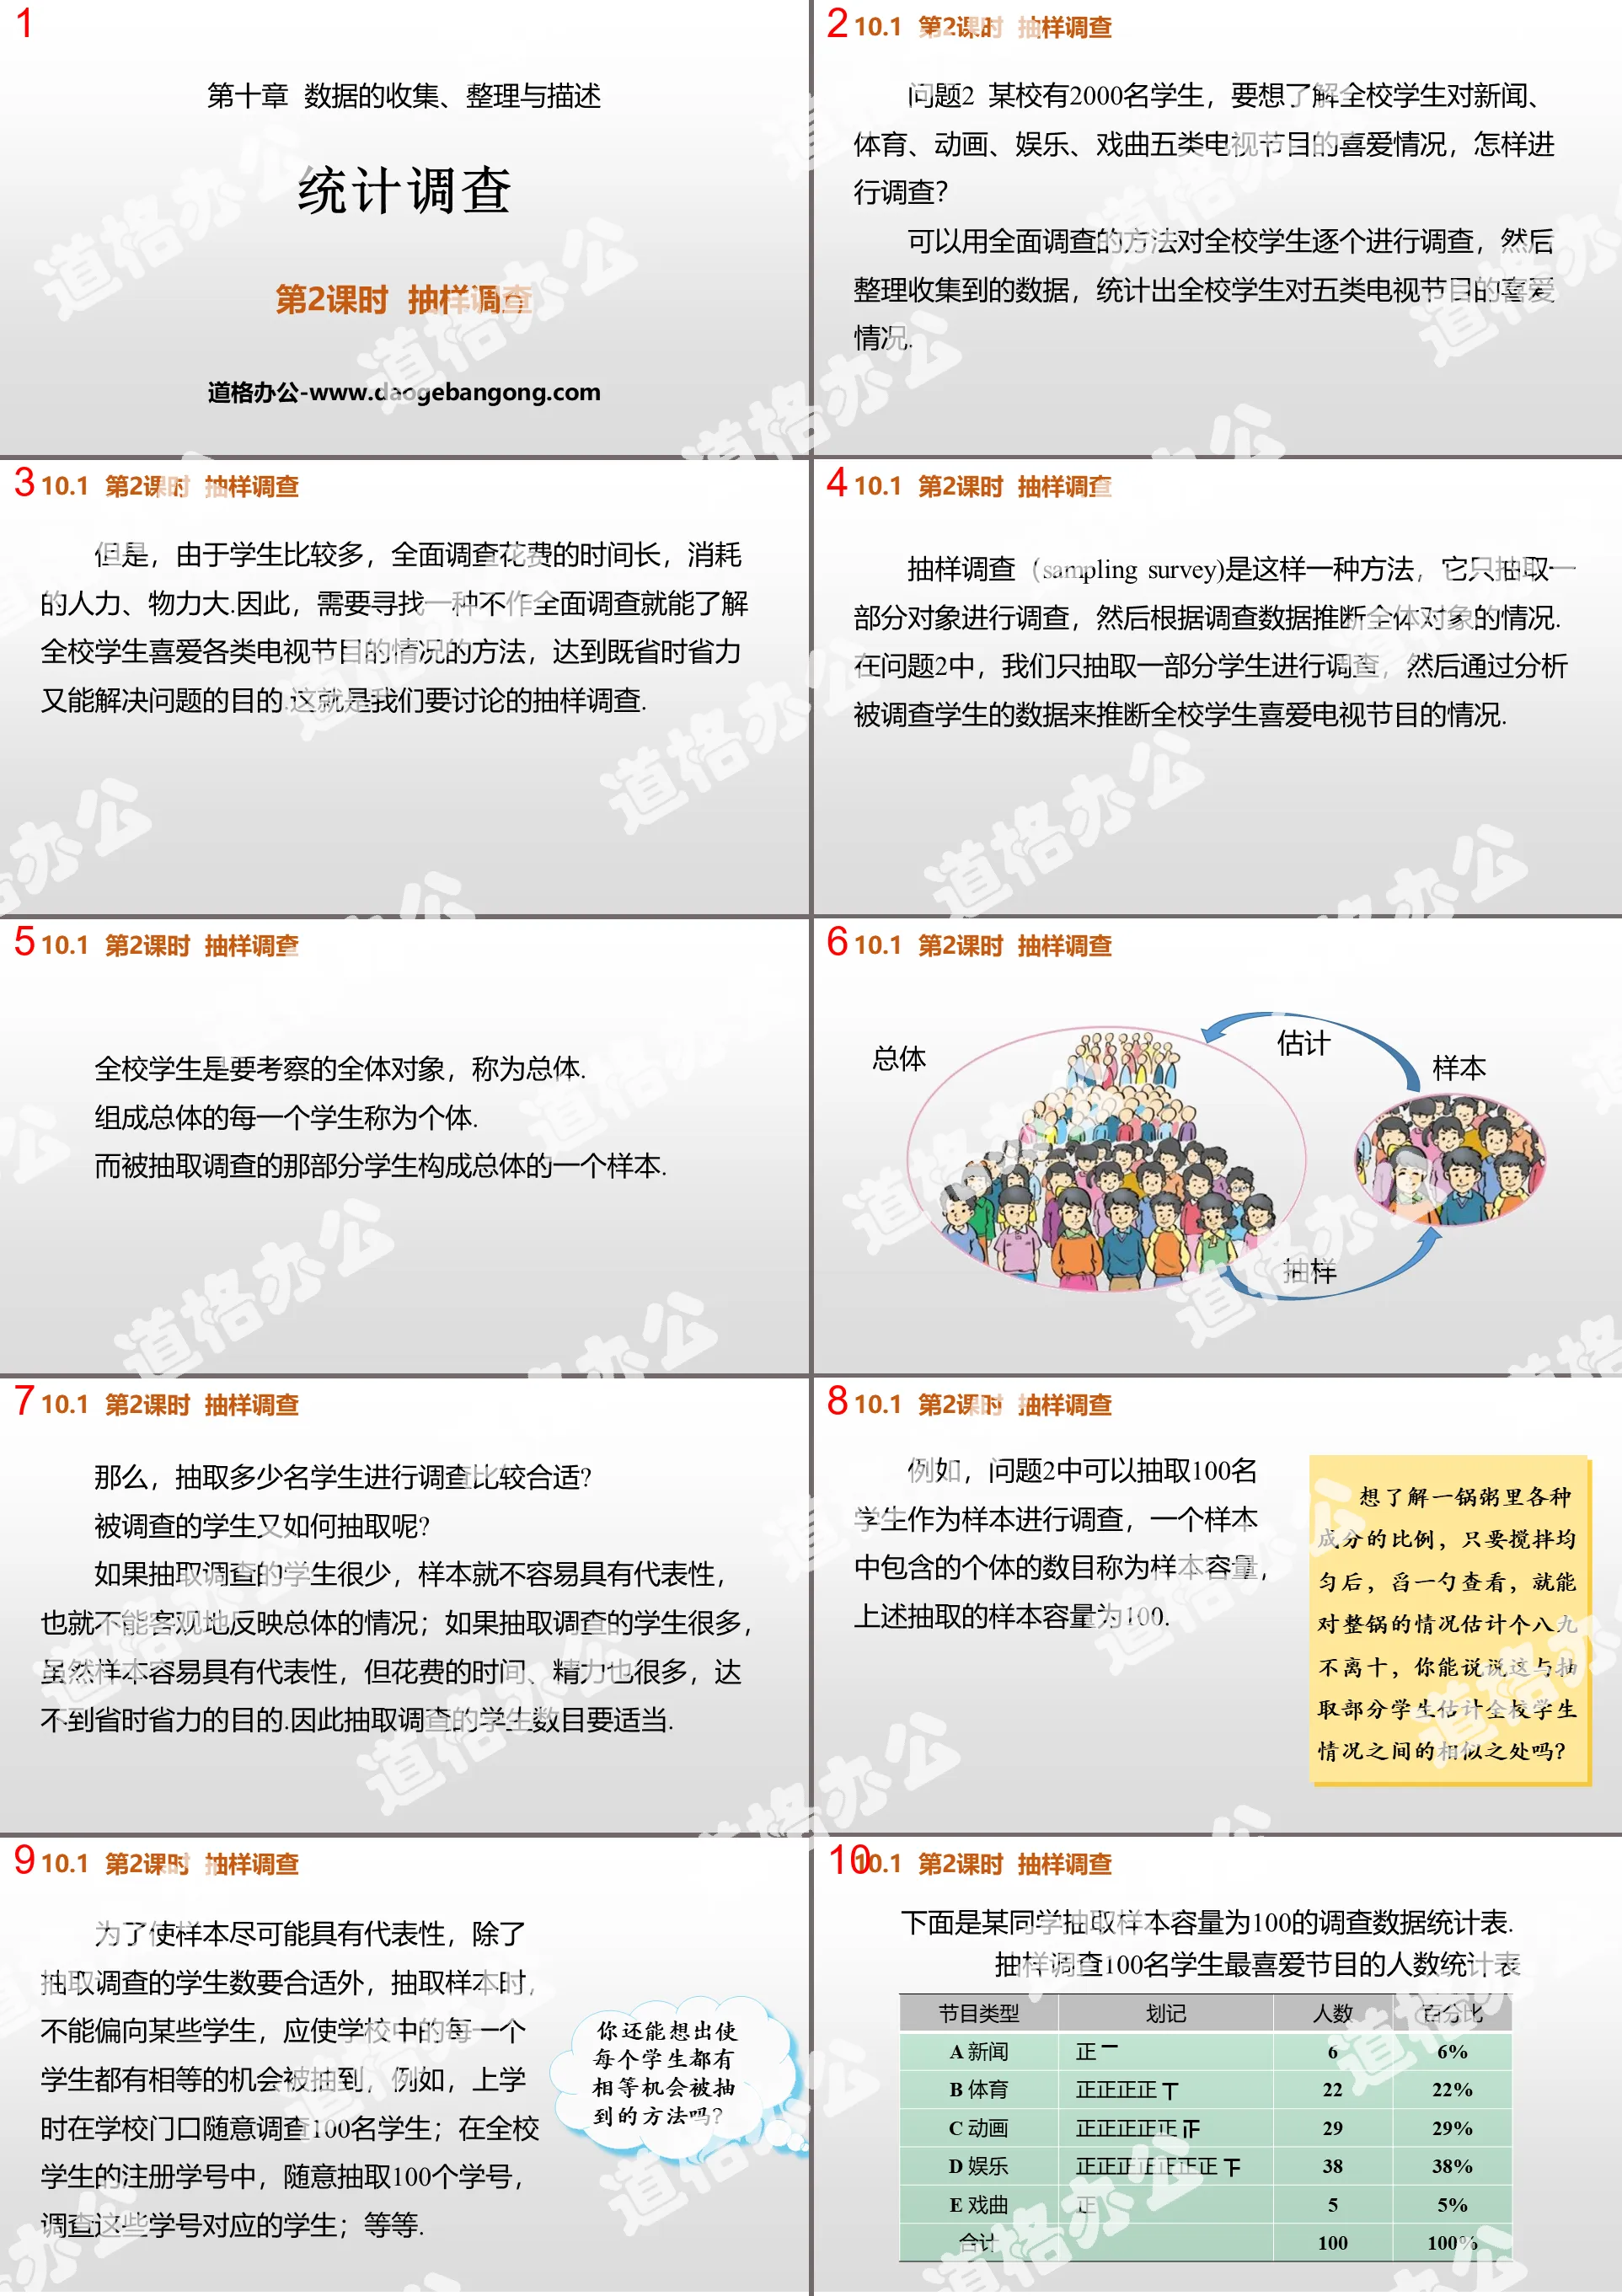
Question 2: There are 2,000 students in a school. If you want to know the students’ love for TV programs in five categories: news, sports, animation, entertainment, and opera, how to conduct a survey?
You can use a comprehensive survey method to investigate all the students in the school one by one, and then organize the collected data to calculate the students' love for five categories of TV programs.
However, due to the large number of students, a comprehensive survey takes a long time and consumes a lot of manpower and material resources. Therefore, it is necessary to find a way to understand the preferences of students in the school for various TV programs without conducting a comprehensive survey, so as to save time and effort. And it can solve the problem. This is the sample survey we are going to discuss.
Sampling survey is a method that only selects a part of the subjects for survey, and then infers the situation of all subjects based on the survey data. In question 2, we only select a part of the students for survey, and then analyze the characteristics of the surveyed students. Use data to infer the popularity of TV programs among students across the school.
All students in the school are the entire object to be inspected and are called the population.
Each student who makes up the population is called an individual.
The portion of students selected for the survey constitutes a sample of the population.
So, how many students should be selected for the survey?
How to select the students under investigation?
If only a few students are selected for investigation, the sample will not be representative and cannot objectively reflect the overall situation; if a large number of students are selected for investigation, although the sample will be representative, it will take a lot of time and energy. This does not serve the purpose of saving time and effort. Therefore, the number of students selected for the survey must be appropriate.
Statistical survey PPT, part 2: summary
Comprehensive survey and sampling survey are two ways to collect data. Comprehensive survey collects comprehensive and accurate data, but it generally costs a lot and takes a long time, and some surveys are not suitable for comprehensive survey. Sampling survey has the characteristics of low cost and time saving. , but whether the sample drawn is representative is directly related to the accuracy of the overall estimate.
Please work as a group to solve the following questions.
Question 3 Compare the average weight of classmates from three grades in your school:
(1) Develop an investigation plan and use your spare time to conduct the investigation;
(2) Based on the collected data, analyze the average weight of students in each grade, and use a line chart to show the changing trend of the average weight as the grade increases;
(3) Arrange a representative from each group to introduce the group's completion of the above problems to the whole class, and make comparisons and comments.
Statistical survey PPT, part 3: in-class exercises
In order to understand the average height of the students in the school, Xiao Ming surveyed the three students sitting next to him and used the average of their heights as an estimate of the average height of the students in the school.
(1) Is Xiao Ming’s survey a sampling survey?
(2) Can this survey result better reflect the overall situation? If not, please explain the reason.
Solution (1) Xiao Ming’s survey is a sampling survey.
(2) This survey result cannot better reflect the overall situation. Because the whole school
Students are of different age groups and have large height differences. The sample selected by Xiao Ming is not representative.
A certain class will choose 3 students to represent the class in inter-class exchange activities. Now choose according to the following method: write the names of all the students in the class on small pieces of paper with no obvious difference, and mix the pieces of paper in a box , after stirring thoroughly, randomly select 3 pieces of paper and select 3 students according to the names written on the pieces of paper. Do you think the above extraction process is simple random sampling? Why?
Solution: The above extraction process is simple random sampling. Because every student has an equal chance of being selected.
Among the following surveys, which ones are suitable for comprehensive surveys and which ones are suitable for sample surveys?
(1) Investigate the impact resistance of a certain batch of cars;
(2) Understand the height of students in a certain class;
(3) Investigate the ratings of the Spring Festival Gala;
(4) Select the fastest sprinter from a certain school to participate in the city-wide competition.
Solution (2)(4) is suitable for comprehensive survey, and (1)(3) is suitable for sampling survey.
Statistical Survey PPT, Part 4: Expanding Applications
During the 1936 U.S. presidential election, Literary Digest magazine mailed questionnaires to 10 million voters, whose lists were selected from phone books, club rosters, and magazine subscribers. As a result, approximately 2.4 million voters returned the survey. Based on the answers of these voters, the magazine predicted that Republican Langdon would be elected. But the election results were completely beyond their expectations. Democratic Roosevelt was elected with a majority of votes. This major mistake caused this magazine, which is very prestigious in polling, to lose face. So why did the magazine predict failure?
It turns out that the 1930s was a period of economic recession in the United States. At that time, most Americans who could install telephones, join upper-class clubs, or subscribe to magazines were wealthy and supported the Republican Party. In other words, although the sample size selected by this magazine was huge, But the sample is not representative.
Keywords: free download of PPT courseware for mathematics in the second volume of the seventh grade of the People's Education Press, download of statistical survey PPT, download of data collection, organization and description PPT, download of sample survey PPT, .PPT format;
For more information about the PPT courseware "Collection, Arrangement and Description of Data Statistical Survey and Sampling Survey", please click the Collection, Arrangement and Description of Data PPT Statistical Survey PPT Sampling Survey PPT tag.
"Statistical Survey" data collection, organization and description PPT download (sampling survey in the second lesson):
"Statistical Survey" data collection, arrangement and description PPT download (sampling survey in the second lesson) Part 1: Introduction of new lesson Scenario introduction Is this the right way for Xiaohua to buy matches? One day, his father asked his son Xiaohua to buy a box of matches. Before going out, his father asked his son to...
"Statistical Survey" data collection, organization and description PPT download (comprehensive survey in the first lesson):
"Statistical Survey" data collection, arrangement and description PPT download (comprehensive survey in the first lesson) Part 1: Introduction of new lesson situations In the classroom, the teacher asked all the students about a certain topic, and the students raised their hands one after another... .. ... ... Statistical Survey P..
"Statistical Survey" data collection, arrangement and description PPT courseware (comprehensive survey in the first lesson):
"Statistical Survey" data collection, arrangement and description PPT courseware (comprehensive survey in the first lesson) Part One Content: New Lesson Analysis Question 1 If you want to know the whole class's views on the five categories of TV programs: news, sports, animation, entertainment, and opera Like the situation, what would you do...
File Info
Update Time: 2024-09-30
This template belongs to Mathematics courseware People's Education Press Seventh Grade Mathematics Volume 2 industry PPT template
"Statistical Survey" data collection, organization and description PPT courseware (sampling survey in the second lesson) Simple campus recruitment activity planning plan summary enterprise and institution recruitment publicity lecture PPT template is a general PPT template for business post competition provided by the manuscript PPT, simple campus recruitment activity planning plan summary enterprise and institution recruitment promotion Lecture PPT template, you can edit and modify the text and pictures in the source file by downloading the source file. If you want more exquisite business PPT templates, you can come to grid resource. Doug resource PPT, massive PPT template slide material download, we only make high-quality PPT templates!
Tips: If you open the template and feel that it is not suitable for all your needs, you can search for related content "Statistical Survey" data collection, organization and description PPT courseware (sampling survey in the second lesson) is enough.
How to use the Windows system template
Directly decompress the file and use it with office or wps
How to use the Mac system template
Directly decompress the file and use it Office or wps can be used
Related reading
For more detailed PPT-related tutorials and font tutorials, you can view: Click to see
How to create a high-quality technological sense PPT? 4 ways to share the bottom of the box
Notice
Do not download in WeChat, Zhihu, QQ, built-in browsers, please use mobile browsers to download! If you are a mobile phone user, please download it on your computer!
1. The manuscript PPT is only for study and reference, please delete it 24 hours after downloading.
2. If the resource involves your legitimate rights and interests, delete it immediately.
3. Contact information: service@daogebangong.com
"Statistical Survey" data collection, organization and description PPT courseware (sampling survey in the second lesson), due to usage restrictions, it is only for personal study and reference use. For commercial use, please go to the relevant official website for authorization.
(Personal non-commercial use refers to the use of this font to complete the display of personal works, including but not limited to the design of personal papers, resumes, etc.)
Preview
Related Search:
"Statistical Survey" data collection, organization and description PPT courseware (sampling survey in the second lesson)
2024-09-30
Copyright statement: This material is compiled and released by the user of Daoge Resources. The copyright belongs to the author. For commercial use, please contact the copyright owner. If there is any infringement, please contact the webmaster to remove the resource.
Download Points: 0.00
Free Download
Upgrade VIP
Favorite
Views: 3941 / Downloads: 161


