Western Normal University Edition First Grade Mathematics Volume 1
Beijing Normal University Edition Seventh Grade Mathematics Volume 1
People's Education Press First Grade Mathematics Volume 1
People's Education Press Second Grade Mathematics Volume 1
People's Education Press Third Grade Mathematics Volume 1
Hebei Education Edition Third Grade Mathematics Volume 1
Beijing Normal University Edition Seventh Grade Mathematics Volume 2
Beijing Normal University Edition Fifth Grade Mathematics Volume 1
Qingdao Edition Seventh Grade Mathematics Volume 1
Beijing Normal University Edition Eighth Grade Mathematics Volume 1
Hebei Education Edition Seventh Grade Mathematics Volume 2
People's Education High School Mathematics Edition B Compulsory Course 2
Jiangsu Education Edition Fourth Grade Mathematics Volume 1
People's Education Press First Grade Mathematics Volume 2
Qingdao Edition Seventh Grade Mathematics Volume 2
Beijing Normal University Edition Fifth Grade Mathematics Volume 2

| Category | Format | Size |
|---|---|---|
| People's Education Press Seventh Grade Mathematics Volume 2 | pptx | 6 MB |

"Statistical Survey" data collection, arrangement and description PPT courseware (comprehensive survey in the first lesson)
2024-09-30
Copyright statement: This material is compiled and released by the user of Daoge Resources. The copyright belongs to the author. For commercial use, please contact the copyright owner. If there is any infringement, please contact the webmaster to remove the resource.
Download Points: 0.00
Free Download
Upgrade VIP
Favorite
Views: 1938 / Downloads: 896
Description
"Statistical Survey" data collection, arrangement and description PPT courseware (comprehensive survey in the first lesson)
Part One: Analysis of the New Course
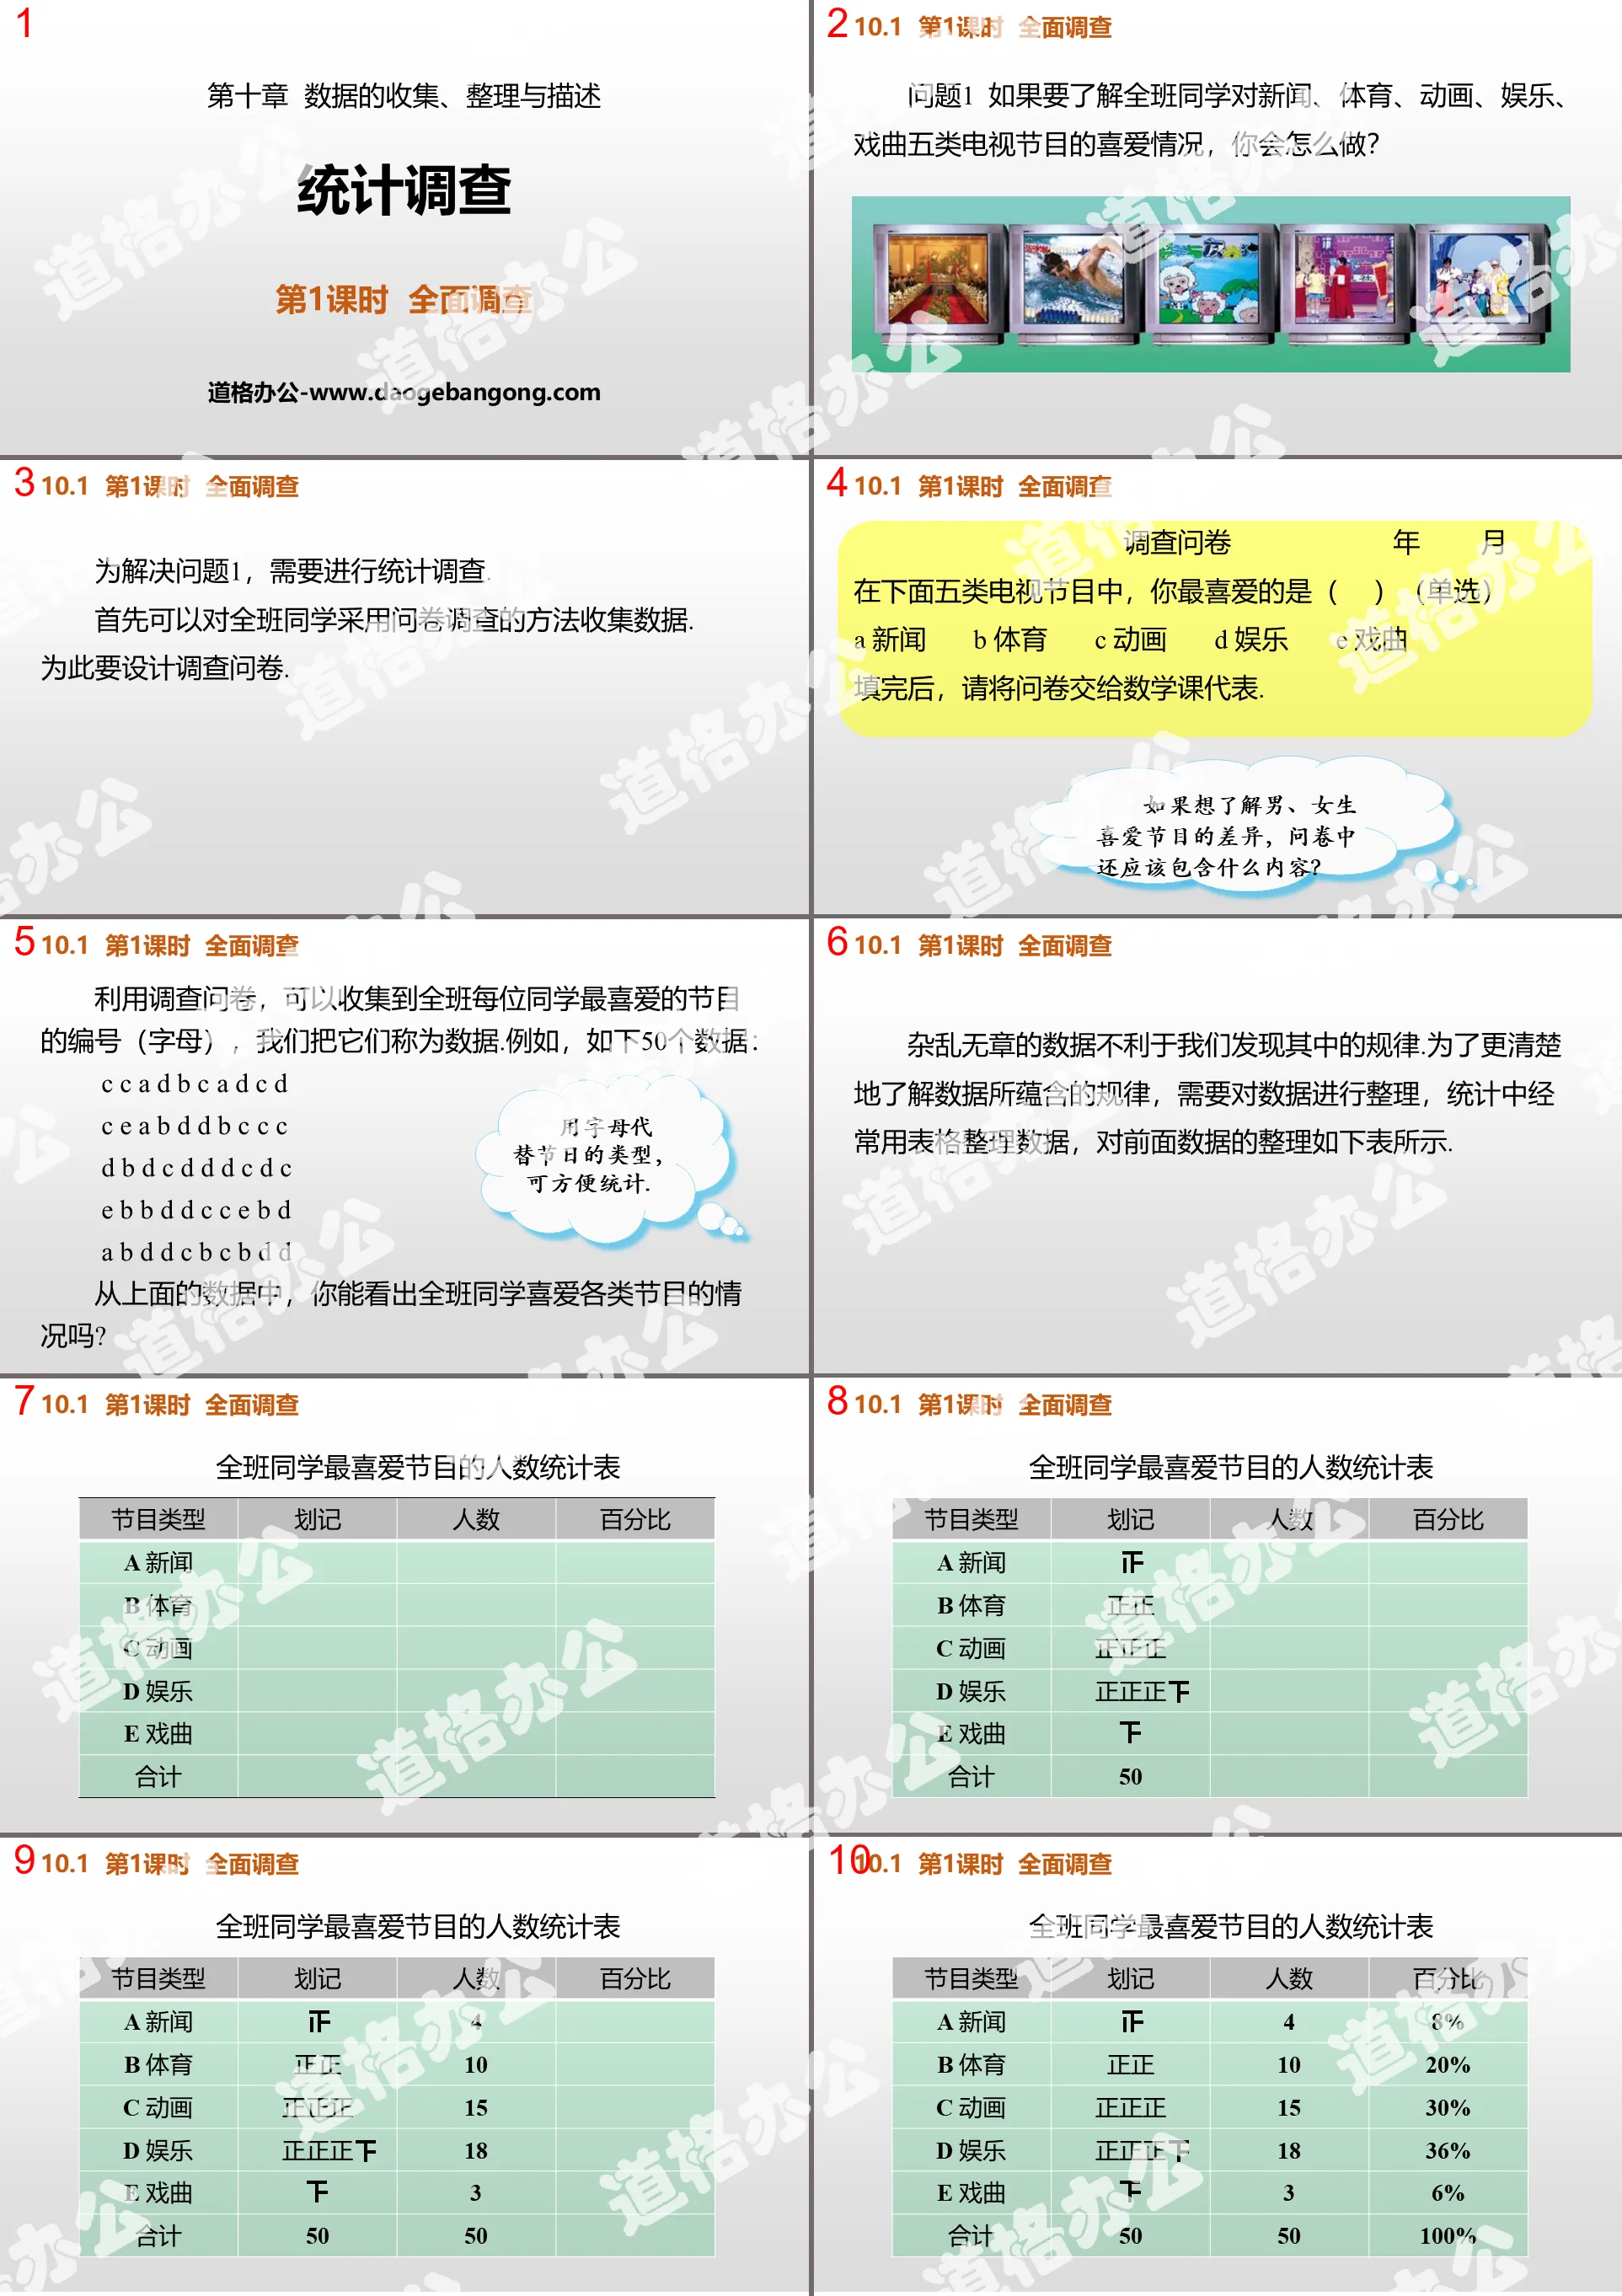
Question 1 What would you do if you wanted to know the class’s preference for TV programs in five categories: news, sports, animation, entertainment, and opera?
To solve question 1, a statistical survey is needed.
First, you can use a questionnaire survey method to collect data from the whole class. For this purpose, a questionnaire should be designed.
Questionnaire
Among the following five types of TV programs, which one is your favorite ( ) (single choice)
A News B Sports C Animation D Entertainment E Opera
When completed, please give the questionnaire to the math class representative.
Using questionnaires, we can collect the numbers (letters) of each student's favorite program in the class. We call them data. For example, the following 50 data:
C C A D B C A D C D
C E A B D D B C C C
D B D C D D D C D C
E B B D D C C E B D
A B D D C B C B D D
From the above data, can you tell how much the class likes various programs?
Statistical survey PPT, part 2: in-class exercises
In order to understand the students’ extracurricular life, Xiao Ming designed the following survey questions: Your favorite extracurricular activity is ( ).
A Reading extracurricular books B Sports activities C Watching TV D Playing football
Do you think the answer options for this question are well designed? Why? If it is unreasonable, please modify it.
The solution is unreasonable. Because the contents of options B and D are repeated, and the four options listed are only part of the extracurricular activities. You can change option D to "other".
After investigation, among the means of transportation used by students in a certain class to go to school, bicycles account for 60%, buses account for 30%, and others account for 10%. Please draw a fan chart to describe the above statistical data.
Please give some examples of the use of comprehensive investigations in your life.
Solution: Such as the seventh national census that will be carried out in 2020; the security inspection of passengers’ luggage at the airport when taking a plane; adjusting the eyesight of the students in this class, etc.
Statistical Survey PPT, Part 3: Class Summary
What are the advantages and disadvantages of bar charts and pie charts when reflecting statistical information?
Bar chart
Easily compare differences between each set of data
It is not easy to display the size of each set of data relative to the population
fan chart
Easily display the size of each set of data relative to the population
Unable to determine the absolute size of each group of numbers
Keywords: free download of PPT courseware for mathematics in the second volume of the seventh grade of the People's Education Press, download of statistical survey PPT, download of data collection, organization and description PPT, download of comprehensive survey PPT, .PPT format;
For more information about the PPT courseware "Data Collection, Arrangement and Description of Statistical Investigation and Comprehensive Investigation", please click on the Data Collection, Arrangement and Description of PPT Statistical Investigation and PPT Comprehensive Investigation PPT tab.
"Statistical Survey" data collection, organization and description PPT download (sampling survey in the second lesson):
"Statistical Survey" data collection, arrangement and description PPT download (sampling survey in the second lesson) Part 1: Introduction of new lesson Scenario introduction Is this the right way for Xiaohua to buy matches? One day, his father asked his son Xiaohua to buy a box of matches. Before going out, his father asked his son to...
"Statistical Survey" data collection, organization and description PPT download (comprehensive survey in the first lesson):
"Statistical Survey" data collection, arrangement and description PPT download (comprehensive survey in the first lesson) Part 1: Introduction of new lesson situations In the classroom, the teacher asked all the students about a certain topic, and the students raised their hands one after another... .. ... ... Statistical Survey P..
"Statistical Survey" data collection, organization and description PPT courseware (sampling survey in the second lesson):
"Statistical Survey" data collection, arrangement and description PPT courseware (sample survey in the second lesson) Part 1: New Knowledge Analysis Question 2 There are 2,000 students in a school. We want to understand the students' views on news, sports, animation, entertainment, and opera. Five favorite TV shows..
File Info
Update Time: 2024-09-30
This template belongs to Mathematics courseware People's Education Press Seventh Grade Mathematics Volume 2 industry PPT template
"Statistical Survey" data collection, arrangement and description PPT courseware (comprehensive survey in the first lesson) Simple campus recruitment activity planning plan summary enterprise and institution recruitment publicity lecture PPT template is a general PPT template for business post competition provided by the manuscript PPT, simple campus recruitment activity planning plan summary enterprise and institution recruitment promotion Lecture PPT template, you can edit and modify the text and pictures in the source file by downloading the source file. If you want more exquisite business PPT templates, you can come to grid resource. Doug resource PPT, massive PPT template slide material download, we only make high-quality PPT templates!
Tips: If you open the template and feel that it is not suitable for all your needs, you can search for related content "Statistical Survey" data collection, arrangement and description PPT courseware (comprehensive survey in the first lesson) is enough.
How to use the Windows system template
Directly decompress the file and use it with office or wps
How to use the Mac system template
Directly decompress the file and use it Office or wps can be used
Related reading
For more detailed PPT-related tutorials and font tutorials, you can view: Click to see
How to create a high-quality technological sense PPT? 4 ways to share the bottom of the box
Notice
Do not download in WeChat, Zhihu, QQ, built-in browsers, please use mobile browsers to download! If you are a mobile phone user, please download it on your computer!
1. The manuscript PPT is only for study and reference, please delete it 24 hours after downloading.
2. If the resource involves your legitimate rights and interests, delete it immediately.
3. Contact information: service@daogebangong.com
"Statistical Survey" data collection, arrangement and description PPT courseware (comprehensive survey in the first lesson), due to usage restrictions, it is only for personal study and reference use. For commercial use, please go to the relevant official website for authorization.
(Personal non-commercial use refers to the use of this font to complete the display of personal works, including but not limited to the design of personal papers, resumes, etc.)
Preview
Related Search:
"Statistical Survey" data collection, arrangement and description PPT courseware (comprehensive survey in the first lesson)
2024-09-30
Copyright statement: This material is compiled and released by the user of Daoge Resources. The copyright belongs to the author. For commercial use, please contact the copyright owner. If there is any infringement, please contact the webmaster to remove the resource.
Download Points: 0.00
Free Download
Upgrade VIP
Favorite
Views: 1938 / Downloads: 896


