Western Normal University Edition First Grade Mathematics Volume 1
Beijing Normal University Edition Seventh Grade Mathematics Volume 1
People's Education Press First Grade Mathematics Volume 1
People's Education Press Third Grade Mathematics Volume 1
People's Education Press Second Grade Mathematics Volume 1
Hebei Education Edition Third Grade Mathematics Volume 1
Beijing Normal University Edition Seventh Grade Mathematics Volume 2
Beijing Normal University Edition Fifth Grade Mathematics Volume 1
Qingdao Edition Seventh Grade Mathematics Volume 1
Hebei Education Edition Seventh Grade Mathematics Volume 2
Beijing Normal University Edition Eighth Grade Mathematics Volume 1
People's Education High School Mathematics Edition B Compulsory Course 2
Jiangsu Education Edition Fourth Grade Mathematics Volume 1
People's Education Press First Grade Mathematics Volume 2
Qingdao Edition Seventh Grade Mathematics Volume 2
Beijing Normal University Edition Fifth Grade Mathematics Volume 2
| Category | Format | Size |
|---|---|---|
| People's Education Press Seventh Grade Mathematics Volume 2 | pptx | 6 MB |

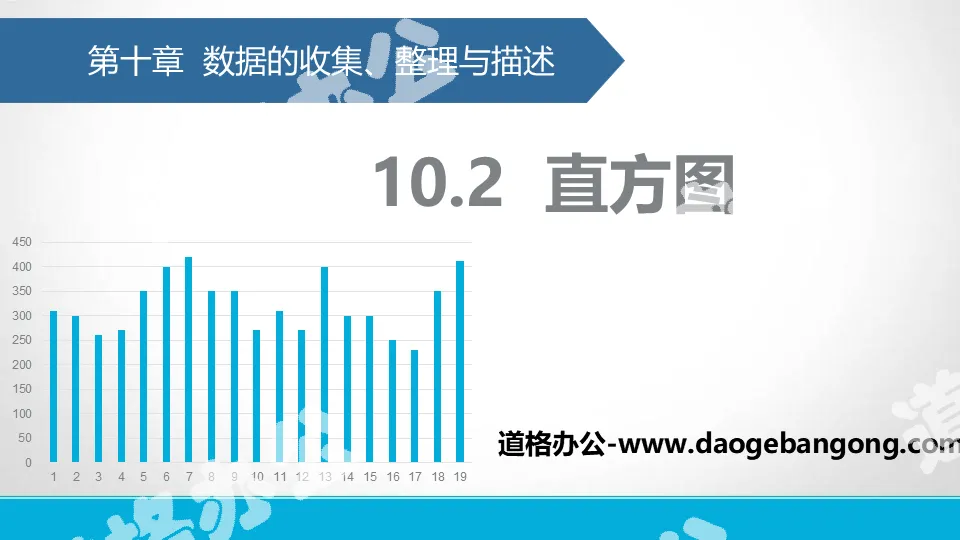
"Histogram" data collection, organization and description PPT teaching courseware
2024-09-23
Copyright statement: This material is compiled and released by the user of Daoge Resources. The copyright belongs to the author. For commercial use, please contact the copyright owner. If there is any infringement, please contact the webmaster to remove the resource.
Download Points: 0.00
Free Download
Upgrade VIP
Favorite
Views: 4130 / Downloads: 419
Description
"Histogram" data collection, organization and description PPT teaching courseware
Part One: Review and Review
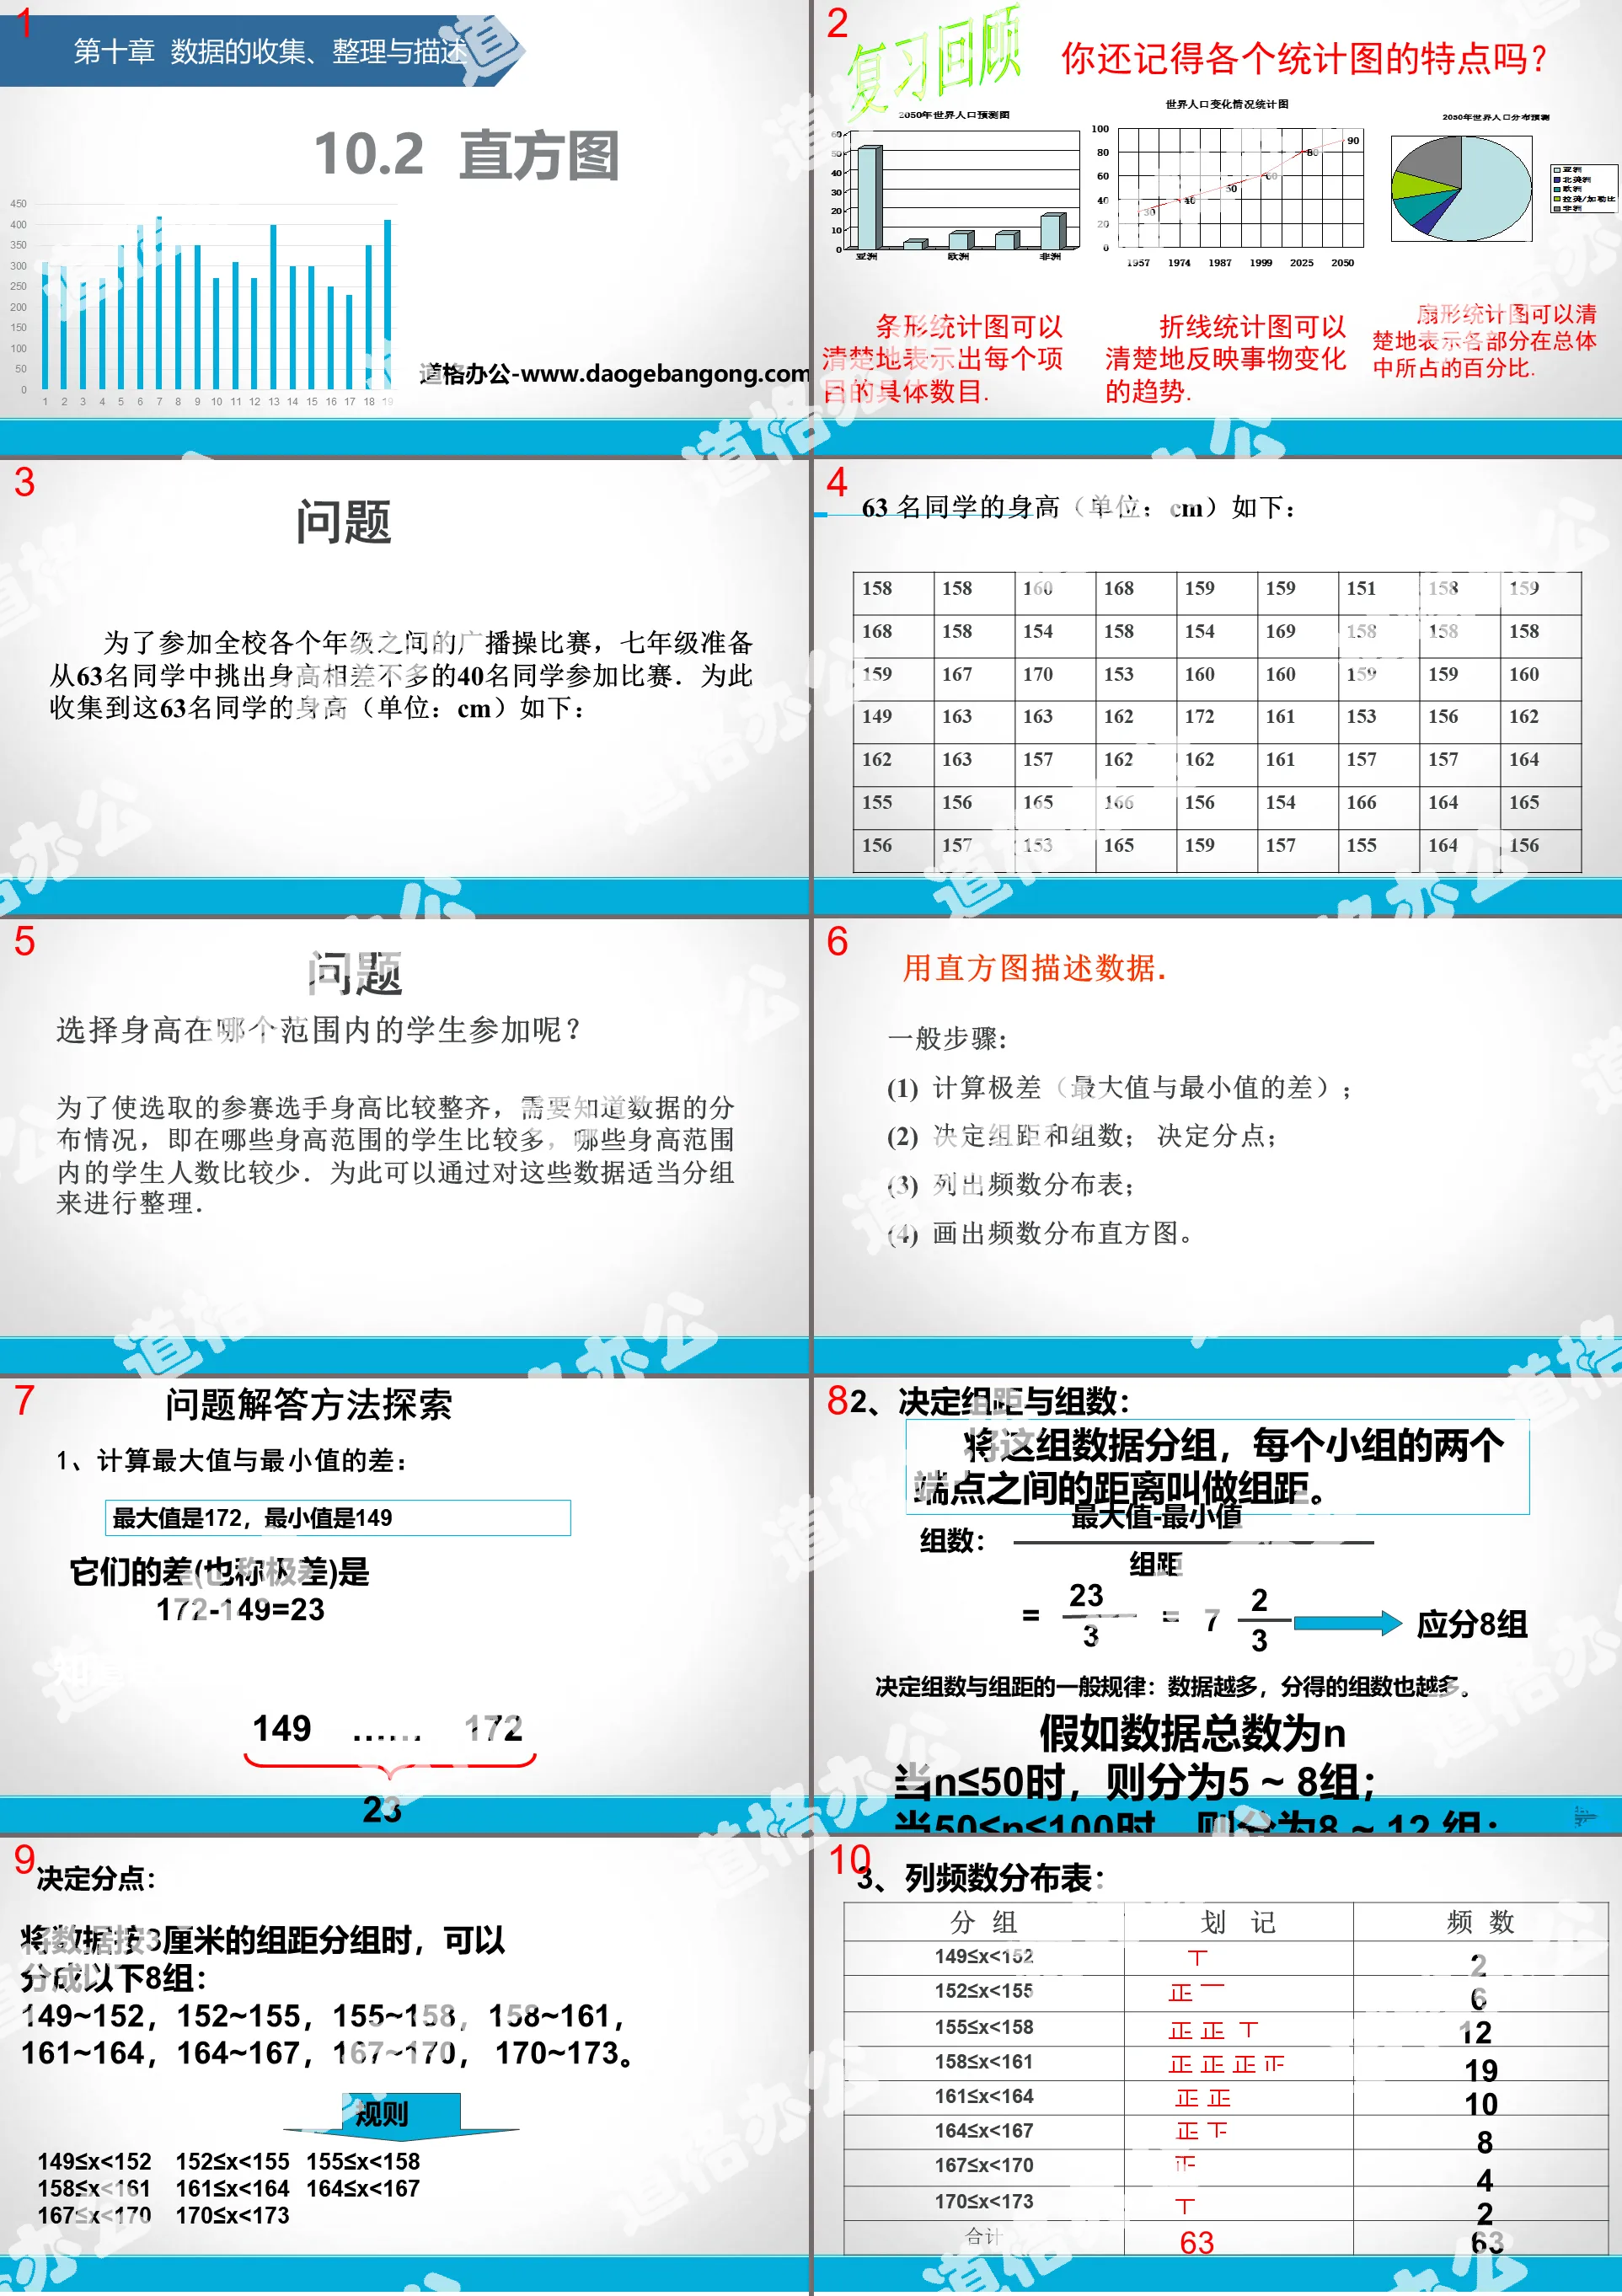
Do you still remember the characteristics of each statistical chart?
Bar charts can clearly show the specific number of each item.
Line statistical charts can clearly reflect the changing trends of things.
A fan chart can clearly show the percentage of each part in the whole.
question
In order to participate in the broadcasting exercise competition between various grades in the school, the seventh grade students are going to select 40 students of similar heights from 63 students to participate in the competition. For this purpose, the heights (unit: cm) of these 63 students were collected as follows:
Which height range should students be selected to participate?
In order to make the selected contestants' heights more uniform, it is necessary to know the distribution of the data, that is, in which height ranges there are more students and in which height ranges there are fewer students. This can be done by grouping the data appropriately.
Histogram PPT, part 2: Exploring problem-solving methods
1. Calculate the difference between the maximum value and the minimum value:
The maximum value is 172 and the minimum value is 149
Their difference (also called range) is 172-149=23
Know the range of changes in this set of data.
2. Determine the group distance and number of groups:
This set of data is grouped, and the distance between the two endpoints of each group is called the group distance.
The general rule that determines the number of groups and the distance between groups: the more data, the more groups you will get.
If the total number of data is n
When n≤50, it is divided into 5 ~ 8 groups;
When 50≤n≤100, it is divided into 8 ~ 12 groups;
Histogram PPT, the third part: summary
General steps for drawing a frequency distribution histogram:
(1) Calculate the difference (range) between the maximum value and the minimum value.
(2) Determine the group distance and number of groups.
(3) Column frequency distribution table.
Count the frequency of each group
(4) Draw a frequency distribution histogram.
The horizontal axis represents each group of data, and the vertical axis represents the frequency. The frequency within the group is high, and rectangles are drawn.
Histogram PPT, Part 4: Practical Exercise
A school conducted a survey on the vacation situation of a certain class of students during the May Day holiday, and based on the collected data, the two incomplete statistical charts in Figure 10-2-7 were drawn. Please use the information provided in the chart to Answer the following questions:
(1) Find the total number of students in the class. (2) Complete the frequency distribution histogram.
(3) Find the degree of ∠α in the fan chart. (4) Which way of vacation do you prefer?
Histogram PPT, Part 5: Class Summary
Through the study of this lesson, we need to master:
1. Frequency distribution table
2. Frequency distribution histogram
Keywords: free download of PPT courseware for mathematics in the second volume of the seventh grade of the People's Education Press, download of histogram PPT, download of data collection, organization and description PPT, .PPT format;
For more information about the PPT courseware "Collection, Organization and Description of Data Histogram", please click the "Collection, Organization and Description of Data PPT Histogram PPT" tab.
"Histogram" data collection, organization and description PPT free courseware:
"Histogram" Data Collection, Arrangement and Description PPT Free Courseware Part One Content: New Knowledge Analysis We have learned methods of describing data such as bar charts, line charts, and fan charts. Here is another statistical chart commonly used to describe data. Histogram. Question for..
"Histogram" data collection, organization and description PPT courseware download:
"Histogram" Data Collection, Arrangement and Description PPT Courseware Download Part One Content: Learning Objectives: Master the basic steps of using frequency distribution histograms to describe data distribution; (Key Points) Be able to use simple frequency distribution histograms to explain the characteristics contained in the data information,..
"Histogram" data collection, organization and description PPT download:
"Histogram" Data Collection, Arrangement and Description PPT Download Part One: Learning Objectives: Be able to recognize histograms, draw histograms, and use histograms to interpret the information contained in the data. ... ... ... Histogram PPT, part 2: exploration...
File Info
Update Time: 2024-09-23
This template belongs to Mathematics courseware People's Education Press Seventh Grade Mathematics Volume 2 industry PPT template
"Histogram" data collection, organization and description PPT teaching courseware Simple campus recruitment activity planning plan summary enterprise and institution recruitment publicity lecture PPT template is a general PPT template for business post competition provided by the manuscript PPT, simple campus recruitment activity planning plan summary enterprise and institution recruitment promotion Lecture PPT template, you can edit and modify the text and pictures in the source file by downloading the source file. If you want more exquisite business PPT templates, you can come to grid resource. Doug resource PPT, massive PPT template slide material download, we only make high-quality PPT templates!
Tips: If you open the template and feel that it is not suitable for all your needs, you can search for related content "Histogram" data collection, organization and description PPT teaching courseware is enough.
How to use the Windows system template
Directly decompress the file and use it with office or wps
How to use the Mac system template
Directly decompress the file and use it Office or wps can be used
Related reading
For more detailed PPT-related tutorials and font tutorials, you can view: Click to see
How to create a high-quality technological sense PPT? 4 ways to share the bottom of the box
Notice
Do not download in WeChat, Zhihu, QQ, built-in browsers, please use mobile browsers to download! If you are a mobile phone user, please download it on your computer!
1. The manuscript PPT is only for study and reference, please delete it 24 hours after downloading.
2. If the resource involves your legitimate rights and interests, delete it immediately.
3. Contact information: service@daogebangong.com
"Histogram" data collection, organization and description PPT teaching courseware, due to usage restrictions, it is only for personal study and reference use. For commercial use, please go to the relevant official website for authorization.
(Personal non-commercial use refers to the use of this font to complete the display of personal works, including but not limited to the design of personal papers, resumes, etc.)
Preview
Related Search:
"Histogram" data collection, organization and description PPT teaching courseware
2024-09-23
Copyright statement: This material is compiled and released by the user of Daoge Resources. The copyright belongs to the author. For commercial use, please contact the copyright owner. If there is any infringement, please contact the webmaster to remove the resource.
Download Points: 0.00
Free Download
Upgrade VIP
Favorite
Views: 4130 / Downloads: 419


