| Category | Format | Size |
|---|---|---|
| Beijing Normal University Edition Fifth Grade Mathematics Volume 2 | pptx | 6 MB |

"Re-understanding of Averages" Data Analysis and Organization PPT Download
Description
"Re-understanding of Averages" Data Analysis and Organization PPT Download
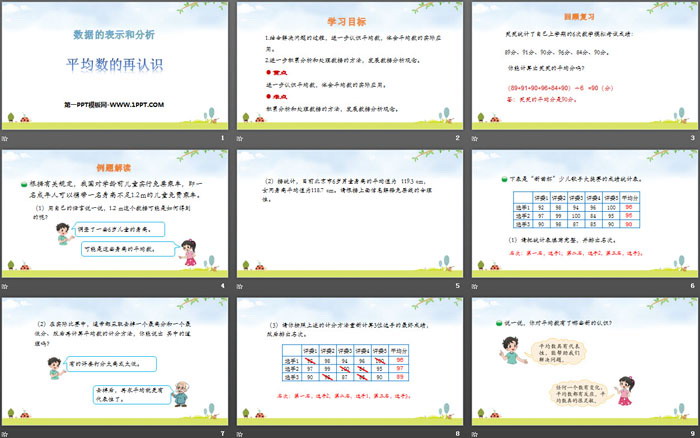
Part One: Learning Objectives
1. Combined with the problem-solving process, further understand the average and experience the practical application of the average.
2. Further accumulate methods of analyzing and processing data, and develop data analysis concepts.
focus
Learn more about averages and experience their practical applications.
difficulty
Accumulate methods of analyzing and processing data, and develop data analysis concepts.
PPT on re-understanding of averages, part 2: interpretation of examples
According to relevant regulations, my country provides free rides for preschool children, that is, an adult can bring a child with a height of less than 1.2 meters to ride for free.
(1) In your own language, how might the data of 1.2 m be obtained?
(2) According to statistics, the current average height of 6-year-old boys in Beijing is 119.3 cm, and the average height of lesbians is 118.7 cm. Please explain the rationality of the free ticket line based on the above information.
The following table is the performance statistics of the "Xinmiao Cup" Children's Singer Grand Prix.
(1) Please fill in the statistical table completely and rank.
Ranking: first place, player 1; second place, player 2, third place, player 3.
(2) In actual competitions, the scoring method is usually to remove the highest score and the lowest score, and then calculate the average. Can you tell me the reason?
Some judges scored too high or too low.
After removing them, the average will be more representative.
(3) Please recalculate the final scores of the three players according to the above scoring method, and then rank them.
Ranking: first place, player 2; second place, player 1, third place, player 3.
PPT on re-understanding of averages, part three: summary
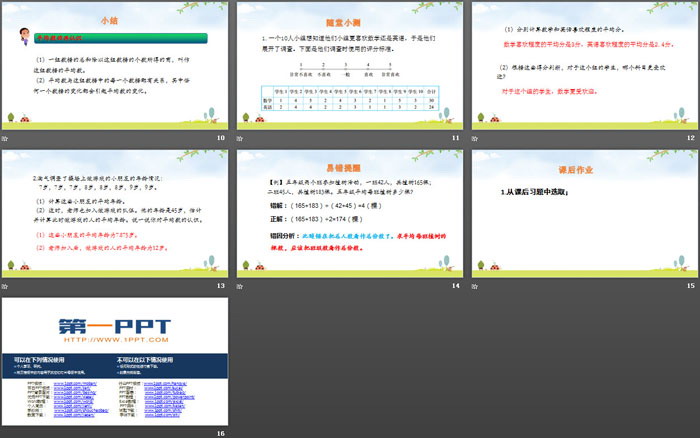
Re-understanding of averages
(1) The quotient obtained by dividing the sum of a set of data by the number of this set of data is called the average of this set of data.
(2) The average is related to every data in this set of data, and changes in any one of the data will cause changes in the average.
PPT on re-understanding of averages, part 4: quiz in class
1. A group of 10 people wanted to know whether their group preferred math or English, so they launched a survey. Below is the scoring rubric they used in their survey.
(1) Calculate the average scores of preference for mathematics and English respectively.
The average score for liking mathematics is 3 points, and the average score for liking English is 2.4 points.
(2) Based on these scores, which subject is more popular for this group of students?
For this group of students, mathematics is more popular.
2. Naughty investigated the age of the children playing games on the playground:
7 years old, 7 years old, 7 years old, 8 years old, 8 years old, 8 years old, 9 years old, 9 years old.
(1) Calculate the average age of these children.
(2) At this time, the teacher also joined the team of playing games. His age is 45 years old, estimate and calculate the average age of people making games at this time. Tell me about your understanding of averages.
(1) The average age of these children is 7.875 years old.
(2) After the teacher joins, the average age of the game players is 12 years old.
Re-understanding of averages PPT, Part 5: Homework
1. Select from the after-class exercises;
Keywords: Free download of Beijing Normal University version of fifth-grade mathematics volume 2 PPT courseware, re-understanding of averages PPT download, data analysis and organization PPT download, .PPT format;
For more information about the PPT courseware "Analysis and Organization of Data for Re-Understanding of Averages", please click on the PPT tab for "Analysis and Organization of Data for Re-understanding of Averages".
"Re-understanding of Averages" Data Analysis and Organization PPT:
"Reunderstanding of Averages" Data Analysis and Organization PPT Part One Content: Learning Objectives 1. Further study averages, be able to calculate the average of simple data, and use average knowledge to solve problems. (Key points) 2. Understand the impact of extreme data on averages. ..
"Re-Understanding of Averages" Data Representation and Analysis PPT Courseware:
"Re-Understanding of Averages" Data Representation and Analysis PPT Courseware According to relevant regulations, my country allows preschool children to ride free of charge, that is, an adult can bring a child with a height of less than 1.2m to ride for free. ⑴How might the data of 1.2m be obtained?
File Info
Update Time: 2024-07-08
This template belongs to Mathematics courseware Beijing Normal University Edition Fifth Grade Mathematics Volume 2 industry PPT template
"Re-understanding of Averages" Data Analysis and Organization PPT Download Simple campus recruitment activity planning plan summary enterprise and institution recruitment publicity lecture PPT template is a general PPT template for business post competition provided by the manuscript PPT, simple campus recruitment activity planning plan summary enterprise and institution recruitment promotion Lecture PPT template, you can edit and modify the text and pictures in the source file by downloading the source file. If you want more exquisite business PPT templates, you can come to grid resource. Doug resource PPT, massive PPT template slide material download, we only make high-quality PPT templates!
Tips: If you open the template and feel that it is not suitable for all your needs, you can search for related content "Re-understanding of Averages" Data Analysis and Organization PPT Download is enough.
How to use the Windows system template
Directly decompress the file and use it with office or wps
How to use the Mac system template
Directly decompress the file and use it Office or wps can be used
Related reading
For more detailed PPT-related tutorials and font tutorials, you can view: Click to see
How to create a high-quality technological sense PPT? 4 ways to share the bottom of the box
Notice
Do not download in WeChat, Zhihu, QQ, built-in browsers, please use mobile browsers to download! If you are a mobile phone user, please download it on your computer!
1. The manuscript PPT is only for study and reference, please delete it 24 hours after downloading.
2. If the resource involves your legitimate rights and interests, delete it immediately.
3. Contact information: service@daogebangong.com
"Re-understanding of Averages" Data Analysis and Organization PPT Download, due to usage restrictions, it is only for personal study and reference use. For commercial use, please go to the relevant official website for authorization.
(Personal non-commercial use refers to the use of this font to complete the display of personal works, including but not limited to the design of personal papers, resumes, etc.)
Preview
Related Search: