Western Normal University Edition First Grade Mathematics Volume 1
Beijing Normal University Edition Seventh Grade Mathematics Volume 1
People's Education Press First Grade Mathematics Volume 1
People's Education Press Third Grade Mathematics Volume 1
People's Education Press Second Grade Mathematics Volume 1
Beijing Normal University Edition Seventh Grade Mathematics Volume 2
Hebei Education Edition Third Grade Mathematics Volume 1
Beijing Normal University Edition Fifth Grade Mathematics Volume 1
Qingdao Edition Seventh Grade Mathematics Volume 1
Beijing Normal University Edition Eighth Grade Mathematics Volume 1
Hebei Education Edition Seventh Grade Mathematics Volume 2
People's Education High School Mathematics Edition B Compulsory Course 2
Qingdao Edition Seventh Grade Mathematics Volume 2
People's Education Press First Grade Mathematics Volume 2
Beijing Normal University Edition Fifth Grade Mathematics Volume 2
Jiangsu Education Edition Fourth Grade Mathematics Volume 1

| Category | Format | Size |
|---|---|---|
| Beijing Normal University Edition Fourth Grade Mathematics Volume 2 | pptx | 6 MB |

"Planting Garlic Seedlings (1)" Data Representation and Analysis PPT (Lesson 2)
2024-09-30
Copyright statement: This material is compiled and released by the user of Daoge Resources. The copyright belongs to the author. For commercial use, please contact the copyright owner. If there is any infringement, please contact the webmaster to remove the resource.
Download Points: 0.00
Free Download
Upgrade VIP
Favorite
Views: 1809 / Downloads: 809
Description
"Planting Garlic Seedlings (1)" Data Representation and Analysis PPT (Lesson 2)
Part One: Learning Objectives
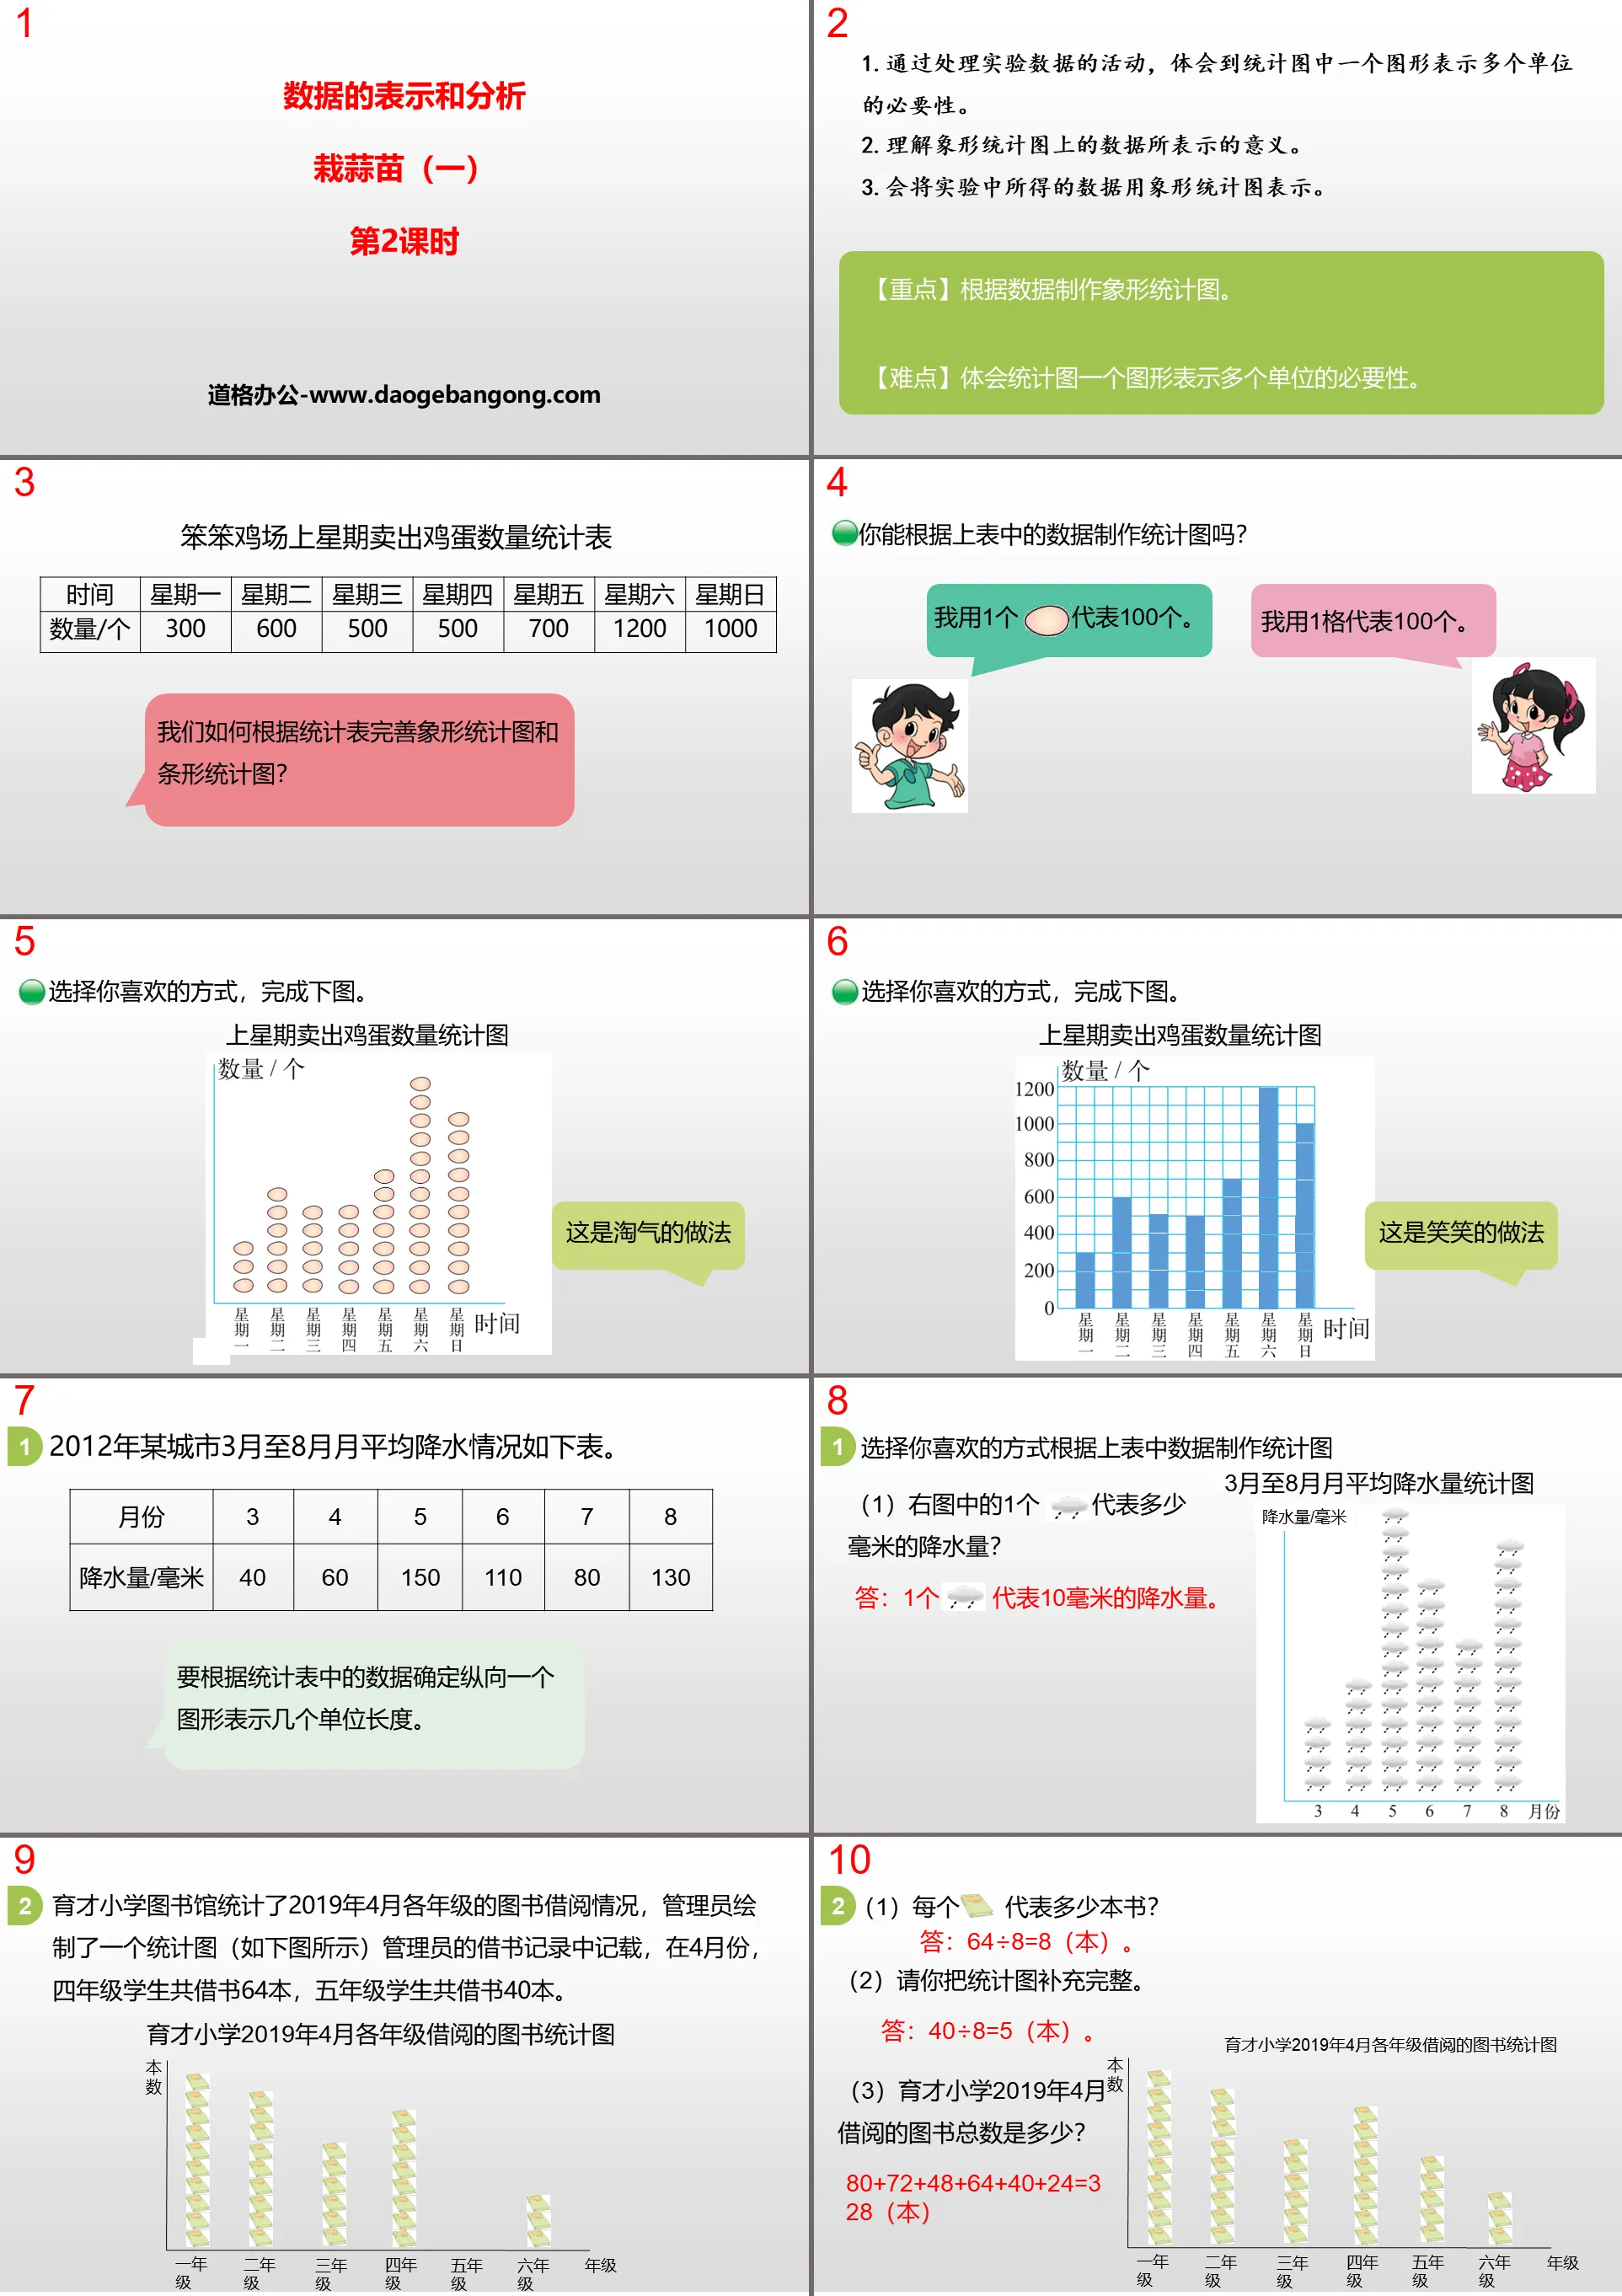
1. Through the activities of processing experimental data, realize the necessity of one graphic representing multiple units in statistical charts.
2. Understand the meaning of the data on the pictogram chart.
3. The data obtained in the experiment will be represented by pictograms.
【Key points】Create pictograms based on data.
[Difficulty] Understand the necessity of a statistical chart to represent multiple units.
Planting garlic seedlings PPT, part 2: exploration of new knowledge
Can you create a statistical graph based on the data in the table above?
I used 1 egg to represent 100.
I use 1 square to represent 100.
Planting garlic seedlings PPT, Part 3: Classroom exercises
1.The average monthly precipitation in a certain city from March to August in 2012 is as follows.
It is necessary to determine how many units of length a vertical graph represents based on the data in the statistical table.
2. The Yucai Primary School Library counted the borrowing situation of books by each grade in April 2019. The administrator drew a statistical chart (as shown in the figure below). The administrator’s borrowing records recorded that in April, a total of fourth-grade students borrowed books. There are 64 books, and fifth grade students borrowed a total of 40 books.
3. The following is the situation of Xingfu Village volunteers delivering rice dumplings to the elderly in various community welfare homes during the Dragon Boat Festival. Please convert the data provided by the statistical chart into a bar chart.
Planting garlic seedlings PPT, Part 4 content: Class summary
Based on the data given, one unit length can represent a larger quantity.
Both pictograms and bar charts can represent a set of data, but in different forms.
When drawing a bar chart, you must first determine two mutually perpendicular rays based on the size of the paper. The horizontal direction is the horizontal axis, and the one perpendicular to the horizontal axis is the vertical axis. Then determine the appropriate position of each straight bar on the horizontal axis, and determine the unit length on the vertical axis based on the size of the given data. Finally, draw the statistical graph.
Planting garlic seedlings PPT, Part 5: Classwork
1. Fill in the blanks.
Below is a statistical table of cartoon images that students in Class 4 (1) like.
(1) The largest number of people who like one of the cartoon images is ( ) people.
(2) The difference between the most and least liked cartoon characters is ( ) people.
(3) Complete the statistical chart based on the statistical table.
(4) 1 cell represents ( ) people.
2. I am a little judge. (Draw “√” if it’s right, “×” if it’s wrong)
(1) Bar charts use the length of the bars to represent quantities. ( )
(2) Bars and pictograms use one unit of length to represent a certain quantity. ( )
(3) Students generally use bar charts to represent the number of students in each class. ( )
(4) In order to clearly show the average precipitation from March to August, a pictogram chart can be used. ( )
Keywords: Free download of Beijing Normal University edition fourth-grade mathematics PPT courseware for the second volume, PPT download of planting garlic seedlings, PPT download of data representation and analysis, .PPT format;
For more information about the PPT courseware "Representation and Analysis of Data on Planting Garlic Seedlings", please click on the PPT tab of "Representation and Analysis of Data on Planting Garlic Seedlings".
"Planting Garlic Seedlings (2)" Data Representation and Analysis PPT:
"Planting Garlic Seedlings (2)" Data Representation and Analysis PPT Part One: Learning Objectives 1. Experience the process of processing experimental data and understand the characteristics of line statistical charts. 2. Through our independent exploration and cooperative communication, we experience the collection, organization and description of data...
"Planting Garlic Seedlings (1)" Data Representation and Analysis PPT (Lesson 1):
"Planting Garlic Seedlings (1)" Data Representation and Analysis PPT (Lesson 1) Part One: Learning Objectives 1. Combined with the experimental data of growing garlic seedlings, guide us to improve the statistical chart and feel that one grid in the statistical chart represents multiple unit quantities necessity. 2. Cultivate us through activities..
File Info
Update Time: 2024-09-30
This template belongs to Mathematics courseware Beijing Normal University Edition Fourth Grade Mathematics Volume 2 industry PPT template
"Planting Garlic Seedlings (1)" Data Representation and Analysis PPT (Lesson 2) Simple campus recruitment activity planning plan summary enterprise and institution recruitment publicity lecture PPT template is a general PPT template for business post competition provided by the manuscript PPT, simple campus recruitment activity planning plan summary enterprise and institution recruitment promotion Lecture PPT template, you can edit and modify the text and pictures in the source file by downloading the source file. If you want more exquisite business PPT templates, you can come to grid resource. Doug resource PPT, massive PPT template slide material download, we only make high-quality PPT templates!
Tips: If you open the template and feel that it is not suitable for all your needs, you can search for related content "Planting Garlic Seedlings (1)" Data Representation and Analysis PPT (Lesson 2) is enough.
How to use the Windows system template
Directly decompress the file and use it with office or wps
How to use the Mac system template
Directly decompress the file and use it Office or wps can be used
Related reading
For more detailed PPT-related tutorials and font tutorials, you can view: Click to see
How to create a high-quality technological sense PPT? 4 ways to share the bottom of the box
Notice
Do not download in WeChat, Zhihu, QQ, built-in browsers, please use mobile browsers to download! If you are a mobile phone user, please download it on your computer!
1. The manuscript PPT is only for study and reference, please delete it 24 hours after downloading.
2. If the resource involves your legitimate rights and interests, delete it immediately.
3. Contact information: service@daogebangong.com
"Planting Garlic Seedlings (1)" Data Representation and Analysis PPT (Lesson 2), due to usage restrictions, it is only for personal study and reference use. For commercial use, please go to the relevant official website for authorization.
(Personal non-commercial use refers to the use of this font to complete the display of personal works, including but not limited to the design of personal papers, resumes, etc.)
Preview
Related Search:
"Planting Garlic Seedlings (1)" Data Representation and Analysis PPT (Lesson 2)
2024-09-30
Copyright statement: This material is compiled and released by the user of Daoge Resources. The copyright belongs to the author. For commercial use, please contact the copyright owner. If there is any infringement, please contact the webmaster to remove the resource.
Download Points: 0.00
Free Download
Upgrade VIP
Favorite
Views: 1809 / Downloads: 809


