Western Normal University Edition First Grade Mathematics Volume 1
Beijing Normal University Edition Seventh Grade Mathematics Volume 1
People's Education Press First Grade Mathematics Volume 1
People's Education Press Third Grade Mathematics Volume 1
People's Education Press Second Grade Mathematics Volume 1
Beijing Normal University Edition Seventh Grade Mathematics Volume 2
Hebei Education Edition Third Grade Mathematics Volume 1
Beijing Normal University Edition Fifth Grade Mathematics Volume 1
Qingdao Edition Seventh Grade Mathematics Volume 1
Beijing Normal University Edition Eighth Grade Mathematics Volume 1
Hebei Education Edition Seventh Grade Mathematics Volume 2
People's Education High School Mathematics Edition B Compulsory Course 2
Qingdao Edition Seventh Grade Mathematics Volume 2
People's Education Press First Grade Mathematics Volume 2
Beijing Normal University Edition Fifth Grade Mathematics Volume 2
Hebei Education Edition Fourth Grade Mathematics Volume 2

| Category | Format | Size |
|---|---|---|
| Beijing Normal University Edition Seventh Grade Mathematics Volume 2 | pptx | 6 MB |

"Variable Relationships Expressed with Graphics" PPT on the relationship between variables (Lesson 2)
2024-09-29
Copyright statement: This material is compiled and released by the user of Daoge Resources. The copyright belongs to the author. For commercial use, please contact the copyright owner. If there is any infringement, please contact the webmaster to remove the resource.
Download Points: 0.00
Free Download
Upgrade VIP
Favorite
Views: 4004 / Downloads: 871
Description
"Variable Relationships Expressed with Graphics" PPT on the relationship between variables (Lesson 2)
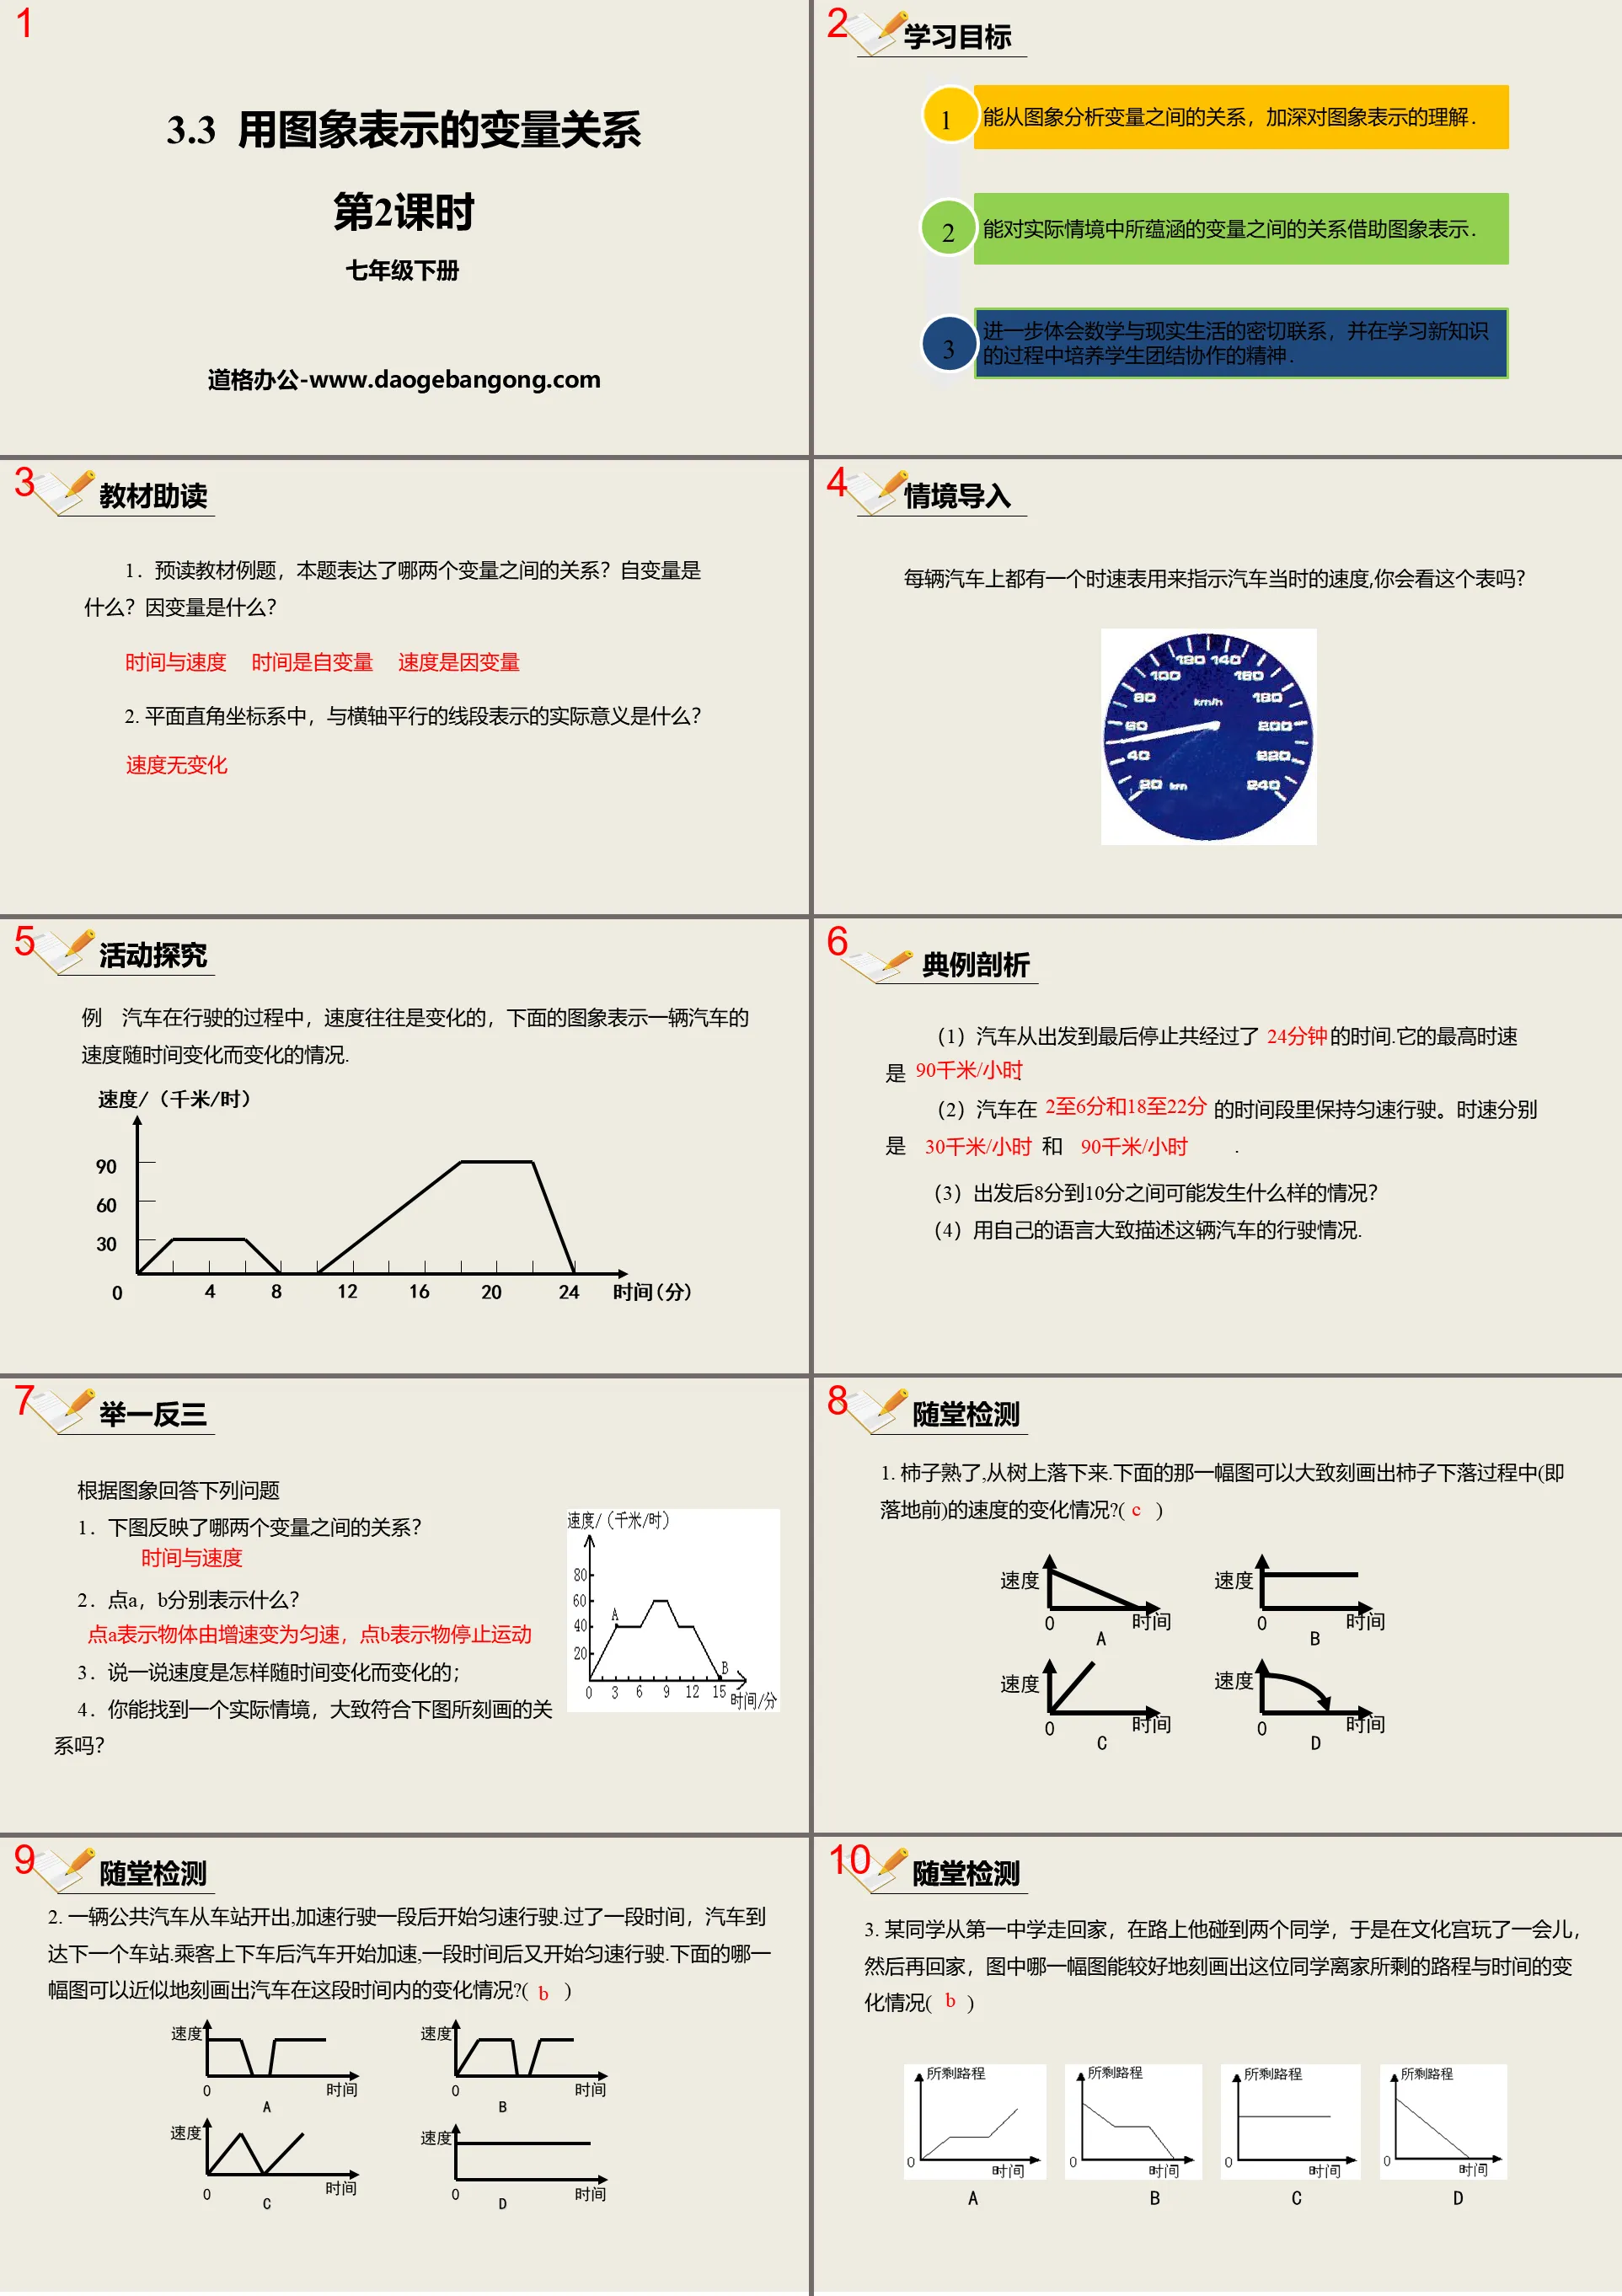
Part One: Learning Objectives
1. Be able to analyze the relationship between variables from images and deepen the understanding of image representation.
2. Be able to use images to represent the relationships between variables contained in actual situations.
3. Further understand the close connection between mathematics and real life, and cultivate students' spirit of unity and cooperation in the process of learning new knowledge.
Variable relationship PPT represented by images, part 2 content: teaching material reading aid
1. Pre-read the textbook example questions. Which two variables does this question express the relationship between? What is the independent variable? What is the dependent variable?
Time and speed Time is the independent variable Speed is the dependent variable
2. In the plane Cartesian coordinate system, what is the actual meaning of the line segments parallel to the horizontal axis?
No change in speed
Variable relationship PPT represented by images, the third part: activity exploration
Example: When a car is driving, its speed often changes. The image below shows how the speed of a car changes with time.
(1) A total of _________ time has passed since the car started to its final stop. Its maximum speed is ________.
(2) The car keeps driving at a constant speed during the time period of ______________. The speeds per hour are ______________ and ______________ respectively.
(3) What may happen between 8 and 10 minutes after departure?
(4) Use your own words to roughly describe the driving conditions of this car.
Variable relationship PPT represented by images, the fourth part: draw inferences from one example
Answer the following questions based on the image
1. The graph below reflects the relationship between which two variables?
time and speed
2. What do points A and B represent respectively?
Point A indicates that the object changes from increasing speed to uniform speed, and point B indicates that the object stops moving.
3. Talk about how speed changes with time;
4. Can you find an actual situation that roughly matches the relationship depicted in the picture below?
Variable relationship PPT represented by images, part 5: in-class testing
1. The persimmon is ripe and falls from the tree. Which picture below can roughly depict the changes in the speed of the persimmon during its falling (that is, before it hits the ground)? ( )
2. A bus drove out from the station, accelerated for a while and then started to drive at a constant speed. After a while, the bus arrived at the next station. After the passengers got on and off, the bus started to accelerate, and after a while it started to drive at a constant speed. Which of the following? Which picture can approximately depict the changes in the car during this period? ( )
3. A classmate was walking home from No. 1 Middle School. He met two classmates on the way, so he played in the Cultural Palace for a while, and then went home. Which picture better depicts this classmate leaving home? Changes in remaining distance and time ( )
Variable relationship PPT represented by images, part 6 content: Class summary
What did you learn in this lesson?
1. Through the situation of speed changing with time, experience the process of analyzing the relationship between variables from the image, and deepen the understanding of image representation.
2. Not only understand the written language, but also understand the graphic language.
3. The most important thing is to understand the independent variables and dependent variables, and understand their changing relationship.
4. The relationship between some variables can be represented graphically. It is vivid, intuitive and easy to explore trends.
5. When observing an image, pay attention to the names and units on its two axes. When identifying changes, you can grasp special positions such as the starting point, end point, and the highest (lowest) point.
Variable relationships represented by images PPT, Part 7: Personalized assignments
1. Li Ming rode his bicycle to school. He started traveling at a certain speed. The car broke down along the way and he had to stop for repairs. After the car was repaired, he accelerated the speed because he was afraid of delaying school time. In the diagram below (s is the distance, t is the time) which conforms to the above situation is ( )
2. Water drops into the glass container as shown in the figure below (the speed of the water drops is the same). How does the height h of the water change with time t? Please select the matching diagram and container.
(A)——( ) (B)——( )
(C)——( ) (D)——( )
3. Observe the picture below and answer the questions.
(1) Which relationship between two variables does it reflect?
(2) What do points A and B represent respectively?
(3) Talk about how speed changes with time;
(4) Can you find an actual situation that roughly conforms to the relationship depicted in the figure below?
Keywords: Beijing Normal University Edition seventh grade mathematics volume 2 free download PPT courseware, PPT download of the relationship between variables represented by images, PPT download of the relationship between variables, .PPT format;
For more information about the PPT courseware "Relationships Between Variables Used to Represent Variable Relationships with Graphics", please click on the PPT tag of "Relationships Between Variables Represented with Graphics Relation between Variables".
"Variable Relationships Expressed with Graphics" PPT on the relationship between variables (Lesson 1):
"Variable Relationships Represented by Graphics" PPT on the relationship between variables (Lesson 1) Part 1: Textbook reading aid 1. How to construct a plane rectangular coordinate system? The plane rectangular coordinate system is constructed from two mutually perpendicular number axes. The horizontal number axis is the x-axis, and the vertical...
File Info
Update Time: 2024-09-29
This template belongs to Mathematics courseware Beijing Normal University Edition Seventh Grade Mathematics Volume 2 industry PPT template
"Variable Relationships Expressed with Graphics" PPT on the relationship between variables (Lesson 2) Simple campus recruitment activity planning plan summary enterprise and institution recruitment publicity lecture PPT template is a general PPT template for business post competition provided by the manuscript PPT, simple campus recruitment activity planning plan summary enterprise and institution recruitment promotion Lecture PPT template, you can edit and modify the text and pictures in the source file by downloading the source file. If you want more exquisite business PPT templates, you can come to grid resource. Doug resource PPT, massive PPT template slide material download, we only make high-quality PPT templates!
Tips: If you open the template and feel that it is not suitable for all your needs, you can search for related content "Variable Relationships Expressed with Graphics" PPT on the relationship between variables (Lesson 2) is enough.
How to use the Windows system template
Directly decompress the file and use it with office or wps
How to use the Mac system template
Directly decompress the file and use it Office or wps can be used
Related reading
For more detailed PPT-related tutorials and font tutorials, you can view: Click to see
How to create a high-quality technological sense PPT? 4 ways to share the bottom of the box
Notice
Do not download in WeChat, Zhihu, QQ, built-in browsers, please use mobile browsers to download! If you are a mobile phone user, please download it on your computer!
1. The manuscript PPT is only for study and reference, please delete it 24 hours after downloading.
2. If the resource involves your legitimate rights and interests, delete it immediately.
3. Contact information: service@daogebangong.com
"Variable Relationships Expressed with Graphics" PPT on the relationship between variables (Lesson 2), due to usage restrictions, it is only for personal study and reference use. For commercial use, please go to the relevant official website for authorization.
(Personal non-commercial use refers to the use of this font to complete the display of personal works, including but not limited to the design of personal papers, resumes, etc.)
Preview
Related Search:
"Variable Relationships Expressed with Graphics" PPT on the relationship between variables (Lesson 2)
2024-09-29
Copyright statement: This material is compiled and released by the user of Daoge Resources. The copyright belongs to the author. For commercial use, please contact the copyright owner. If there is any infringement, please contact the webmaster to remove the resource.
Download Points: 0.00
Free Download
Upgrade VIP
Favorite
Views: 4004 / Downloads: 871


