| Category | Format | Size |
|---|---|---|
| Beijing Normal University Edition Eighth Grade Mathematics Volume 1 | pptx | 6 MB |

"Dispersion Degree of Data" Data Analysis PPT
Description
"Dispersion Degree of Data" Data Analysis PPT, 23 pages in total.
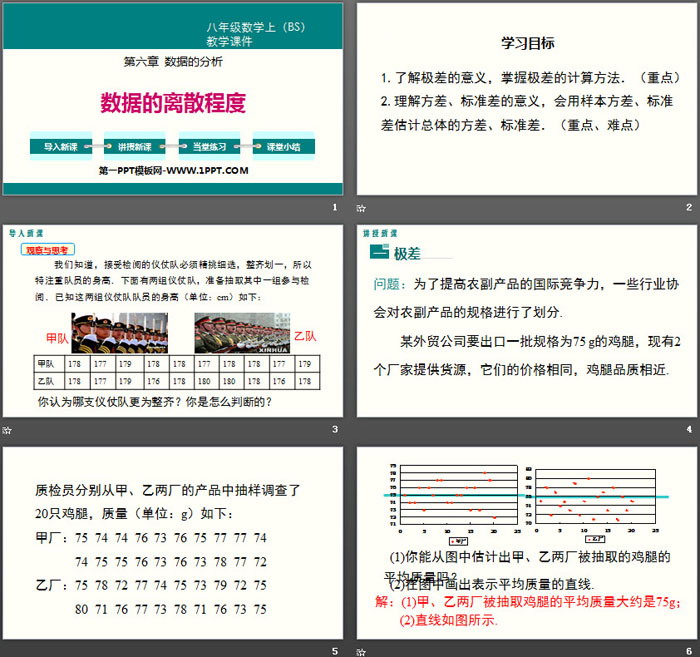
Part One: Learning Objectives
1. Understand the meaning of range and master the calculation method of range. (emphasis)
2. Understand the meaning of variance and standard deviation, and be able to use sample variance and standard deviation to estimate the population variance and standard deviation. (main difficulty)
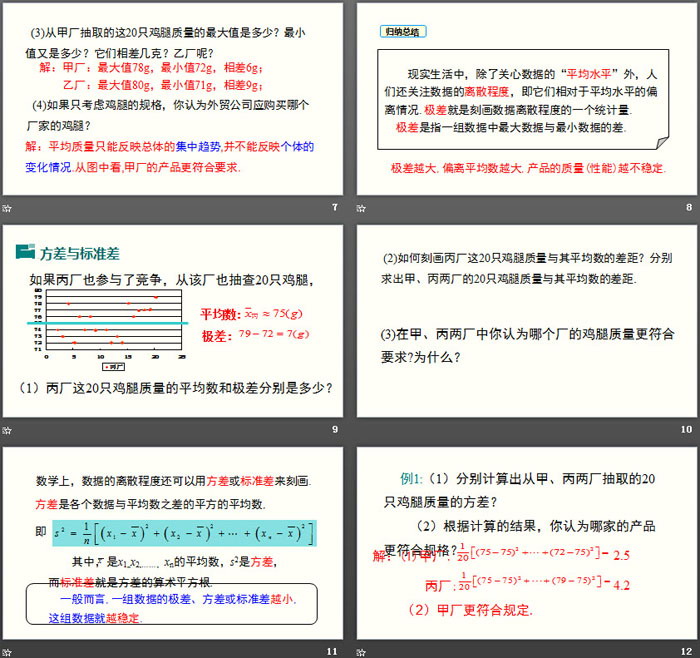
Dispersion degree of data PPT, part 2 content: teaching new lessons
Very poor
Question: In order to improve the international competitiveness of agricultural and sideline products, some industry associations have divided the specifications of agricultural and sideline products.
A foreign trade company wants to export a batch of 75 g chicken legs. There are currently two manufacturers providing supply. Their prices are the same and the quality of the chicken legs is similar.
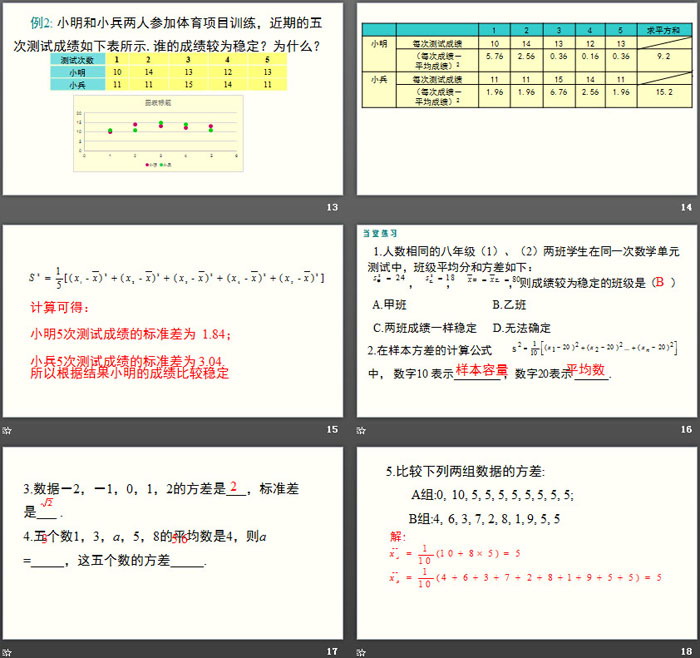
In conclusion
In real life, in addition to caring about the "average level" of data, people also pay attention to the degree of dispersion of data, that is, their deviation from the average level. Range is a statistic that describes the degree of dispersion of data.
Range refers to the difference between the largest data and the smallest data in a set of data.
Variance and standard deviation
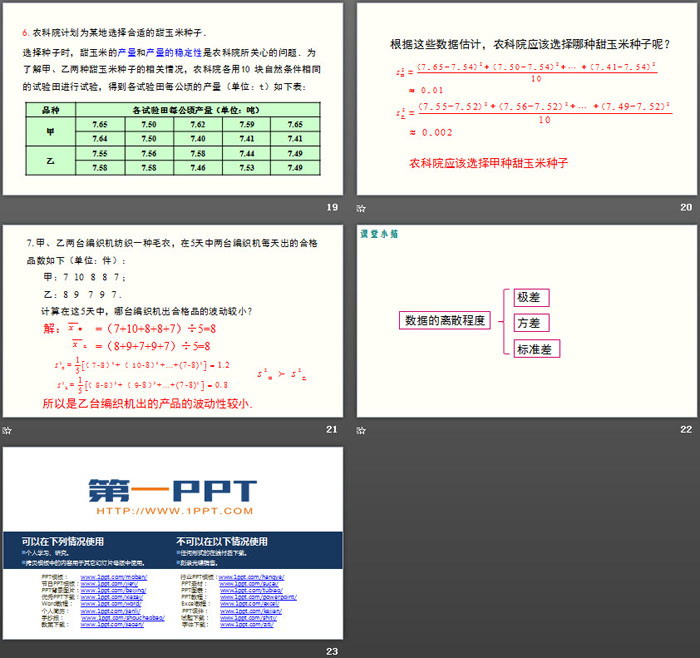
Dispersion degree of data PPT, the third part: practice in class
1. For two classes (1) and (2) of eighth grade students with the same number of students, in the same mathematics unit test, the class average score and variance are as follows: Then the class with more stable scores is ( )
A. Class A B. Class B
C. The results of both classes are equally stable D. Unable to determine
2. In the calculation formula of sample variance, the number 10 represents ________ and the number 20 represents ______.
Dispersion degree of data PPT, part 4 content: Class summary
Very poor
variance
standard deviation
Keywords: Free download of Beijing Normal University edition eighth-grade mathematics PPT courseware for volume 1, data discreteness PPT download, data analysis PPT download, .PPT format;
For more information about the "Data Analysis and Dispersion Degree of Data" PPT courseware, please click on the Data Analysis PPT and Data Dispersion Degree PPT tab.
"The Dispersion Degree of Data" Data Analysis PPT Teaching Courseware:
"The Dispersion Degree of Data" data analysis PPT teaching courseware, 14 pages in total. Part One: Knowledge Points Basic Knowledge Point 1 Range and Variance 1. The range of a set of data 15-20-1 is (C) A.5 B.6 C.7 D.8 2. A, B, C The four players, Ding and Ding each...
"Dispersion Degree of Data" Data Analysis PPT Download (Lesson 2):
"The Dispersion Degree of Data" Data Analysis PPT Download (Lesson 2), 12 pages in total. Part One: Type Analysis, Type, Comprehensive Application of Variance and Average 1. [2016 Inner Mongolia] A shooting team selects one person from two athletes A and B to participate in the national...
"The Dispersion Degree of Data" Data Analysis PPT Download (Lesson 1):
"The Dispersion Degree of Data" Data Analysis PPT Download (Lesson 1), 32 pages in total. Part One: Understanding New Knowledge Knowledge Points Very Poor In real life, in addition to caring about the central tendency of data, people often also pay attention to the degree of dispersion of data, that is, their relative...
File Info
Update Time: 2024-07-04
This template belongs to Mathematics courseware Beijing Normal University Edition Eighth Grade Mathematics Volume 1 industry PPT template
"Dispersion Degree of Data" Data Analysis PPT Simple campus recruitment activity planning plan summary enterprise and institution recruitment publicity lecture PPT template is a general PPT template for business post competition provided by the manuscript PPT, simple campus recruitment activity planning plan summary enterprise and institution recruitment promotion Lecture PPT template, you can edit and modify the text and pictures in the source file by downloading the source file. If you want more exquisite business PPT templates, you can come to grid resource. Doug resource PPT, massive PPT template slide material download, we only make high-quality PPT templates!
Tips: If you open the template and feel that it is not suitable for all your needs, you can search for related content "Dispersion Degree of Data" Data Analysis PPT is enough.
How to use the Windows system template
Directly decompress the file and use it with office or wps
How to use the Mac system template
Directly decompress the file and use it Office or wps can be used
Related reading
For more detailed PPT-related tutorials and font tutorials, you can view: Click to see
How to create a high-quality technological sense PPT? 4 ways to share the bottom of the box
Notice
Do not download in WeChat, Zhihu, QQ, built-in browsers, please use mobile browsers to download! If you are a mobile phone user, please download it on your computer!
1. The manuscript PPT is only for study and reference, please delete it 24 hours after downloading.
2. If the resource involves your legitimate rights and interests, delete it immediately.
3. Contact information: service@daogebangong.com
"Dispersion Degree of Data" Data Analysis PPT, due to usage restrictions, it is only for personal study and reference use. For commercial use, please go to the relevant official website for authorization.
(Personal non-commercial use refers to the use of this font to complete the display of personal works, including but not limited to the design of personal papers, resumes, etc.)
Preview
Related Search: