Western Normal University Edition First Grade Mathematics Volume 1
Beijing Normal University Edition Seventh Grade Mathematics Volume 1
People's Education Press First Grade Mathematics Volume 1
People's Education Press Third Grade Mathematics Volume 1
People's Education Press Second Grade Mathematics Volume 1
Hebei Education Edition Third Grade Mathematics Volume 1
Beijing Normal University Edition Seventh Grade Mathematics Volume 2
Beijing Normal University Edition Fifth Grade Mathematics Volume 1
Qingdao Edition Seventh Grade Mathematics Volume 1
Beijing Normal University Edition Eighth Grade Mathematics Volume 1
Hebei Education Edition Seventh Grade Mathematics Volume 2
People's Education High School Mathematics Edition B Compulsory Course 2
Qingdao Edition Seventh Grade Mathematics Volume 2
Jiangsu Education Edition Fourth Grade Mathematics Volume 1
People's Education Press First Grade Mathematics Volume 2
Beijing Normal University Edition Fifth Grade Mathematics Volume 2

| Category | Format | Size |
|---|---|---|
| Jiangsu Education Edition Fourth Grade Mathematics Volume 1 | pptx | 6 MB |

"Bar Chart" Statistics and Possibility PPT Courseware
2024-09-30
Copyright statement: This material is compiled and released by the user of Daoge Resources. The copyright belongs to the author. For commercial use, please contact the copyright owner. If there is any infringement, please contact the webmaster to remove the resource.
Download Points: 0.00
Free Download
Upgrade VIP
Favorite
Views: 4523 / Downloads: 661
Description
"Bar Chart" Statistics and Possibility PPT Courseware
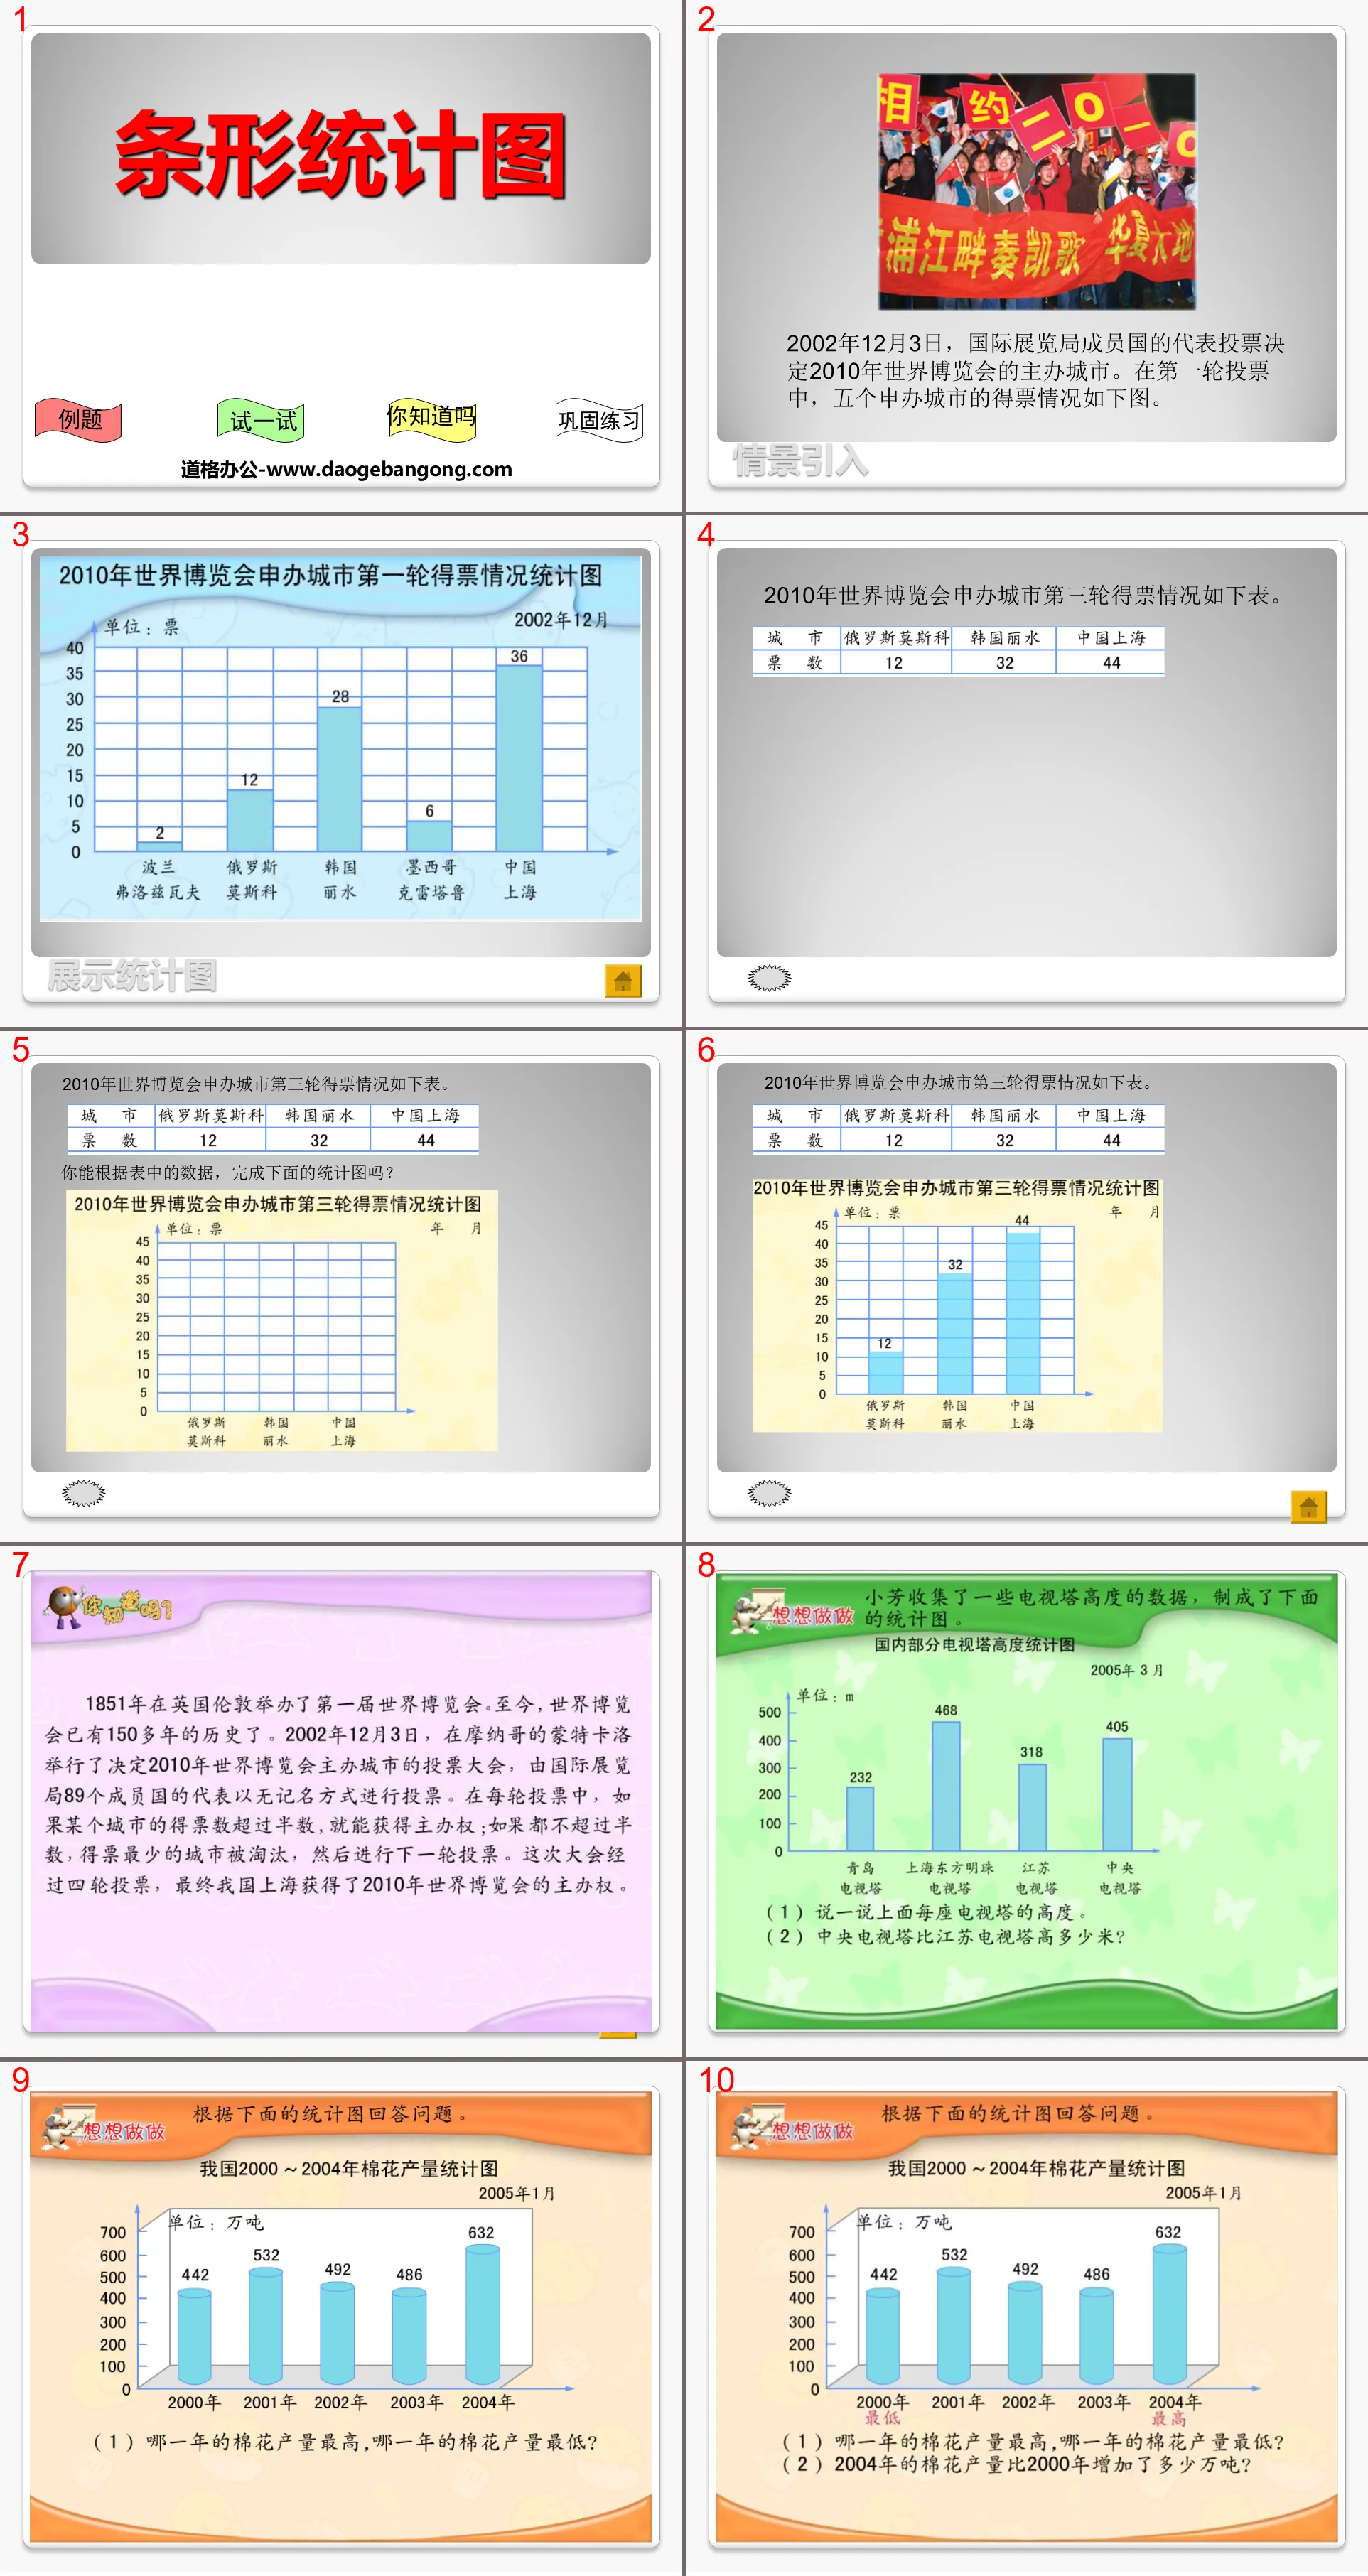
On December 3, 2002, representatives of the member countries of the Bureau International des Expositions voted to decide the host city of the 2010 World Expo. In the first round of voting, the votes obtained by the five bid cities are as follows.
The third round of votes received by the cities bidding to host the 2010 World Expo is as follows.
Can you complete the following statistical chart based on the data in the table?
The courseware contains tables and statistical graphs of various types of data. You can learn relevant knowledge points about bar graphs based on the data in the tables. It is a good courseware for primary school mathematics teaching.
Keywords: bar chart courseware, Jiangsu Education Edition fourth-grade mathematics PPT courseware download, fourth-grade mathematics slide courseware download, bar chart PPT courseware download, .PPT format;
For more information about the "Bar Chart Statistics and Possibility" PPT courseware, please click the Bar Chart PPT Statistics and Possibility PPT tab.
"Complex Bar Chart" Data Representation and Analysis PPT Teaching Courseware:
"Complex Bar Chart" Data Representation and Analysis PPT Teaching Courseware Part One: Learning Objectives 1. Through the pitching game, understand the compound bar chart and understand the characteristics of the compound bar chart. 2. Able to obtain as much information as possible from statistical charts and experience...
"Complex Bar Chart" Data Representation and Analysis PPT Download:
"Complex Bar Statistical Chart" Data Representation and Analysis PPT Download Part One Content: Scenario Introduction In physical education class, the teacher organized students to conduct shooting training, but the students encountered difficulties at the beginning of the practice. Some students shot with one hand. , some students use their hands...
"Complex Bar Chart" Data Representation and Analysis PPT:
"Complex Bar Chart" Data Representation and Analysis PPT Part One: Learning Objectives 1. Understand the compound bar chart and understand the characteristics of the compound bar chart. (Key points) 2. Be able to use the information in the compound bar chart to solve problems, and be able to draw complex...
File Info
Update Time: 2024-09-30
This template belongs to Mathematics courseware Jiangsu Education Edition Fourth Grade Mathematics Volume 1 industry PPT template
"Bar Chart" Statistics and Possibility PPT Courseware Simple campus recruitment activity planning plan summary enterprise and institution recruitment publicity lecture PPT template is a general PPT template for business post competition provided by the manuscript PPT, simple campus recruitment activity planning plan summary enterprise and institution recruitment promotion Lecture PPT template, you can edit and modify the text and pictures in the source file by downloading the source file. If you want more exquisite business PPT templates, you can come to grid resource. Doug resource PPT, massive PPT template slide material download, we only make high-quality PPT templates!
Tips: If you open the template and feel that it is not suitable for all your needs, you can search for related content "Bar Chart" Statistics and Possibility PPT Courseware is enough.
How to use the Windows system template
Directly decompress the file and use it with office or wps
How to use the Mac system template
Directly decompress the file and use it Office or wps can be used
Related reading
For more detailed PPT-related tutorials and font tutorials, you can view: Click to see
How to create a high-quality technological sense PPT? 4 ways to share the bottom of the box
Notice
Do not download in WeChat, Zhihu, QQ, built-in browsers, please use mobile browsers to download! If you are a mobile phone user, please download it on your computer!
1. The manuscript PPT is only for study and reference, please delete it 24 hours after downloading.
2. If the resource involves your legitimate rights and interests, delete it immediately.
3. Contact information: service@daogebangong.com
"Bar Chart" Statistics and Possibility PPT Courseware, due to usage restrictions, it is only for personal study and reference use. For commercial use, please go to the relevant official website for authorization.
(Personal non-commercial use refers to the use of this font to complete the display of personal works, including but not limited to the design of personal papers, resumes, etc.)
Preview
Related Search:
"Bar Chart" Statistics and Possibility PPT Courseware
2024-09-30
Copyright statement: This material is compiled and released by the user of Daoge Resources. The copyright belongs to the author. For commercial use, please contact the copyright owner. If there is any infringement, please contact the webmaster to remove the resource.
Download Points: 0.00
Free Download
Upgrade VIP
Favorite
Views: 4523 / Downloads: 661


