Western Normal University Edition First Grade Mathematics Volume 1
Beijing Normal University Edition Seventh Grade Mathematics Volume 1
People's Education Press First Grade Mathematics Volume 1
People's Education Press Third Grade Mathematics Volume 1
People's Education Press Second Grade Mathematics Volume 1
Beijing Normal University Edition Seventh Grade Mathematics Volume 2
Beijing Normal University Edition Fifth Grade Mathematics Volume 1
Qingdao Edition Seventh Grade Mathematics Volume 1
Hebei Education Edition Third Grade Mathematics Volume 1
Beijing Normal University Edition Eighth Grade Mathematics Volume 1
Hebei Education Edition Seventh Grade Mathematics Volume 2
People's Education High School Mathematics Edition B Compulsory Course 2
Beijing Normal University Edition Fifth Grade Mathematics Volume 2
Jiangsu Education Edition Fourth Grade Mathematics Volume 1
Hebei Education Edition Fourth Grade Mathematics Volume 2
Qingdao Edition Seventh Grade Mathematics Volume 2

| Category | Format | Size |
|---|---|---|
| People's Education Press Seventh Grade Mathematics Volume 2 | pptx | 6 MB |

"Histogram" data collection, organization and description PPT download
2024-10-05
Copyright statement: This material is compiled and released by the user of Daoge Resources. The copyright belongs to the author. For commercial use, please contact the copyright owner. If there is any infringement, please contact the webmaster to remove the resource.
Download Points: 0.00
Free Download
Upgrade VIP
Favorite
Views: 4914 / Downloads: 469
Description
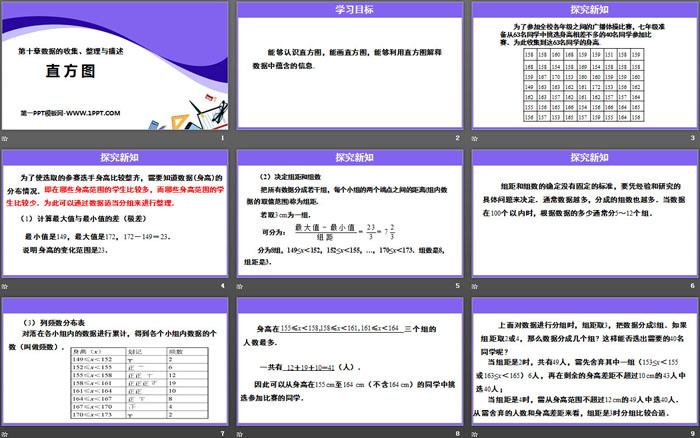
"Histogram" data collection, organization and description PPT download
Part One: Learning Objectives
Be able to recognize histograms, draw histograms, and use histograms to interpret the information contained in the data.
Histogram PPT, part 2: exploring new knowledge
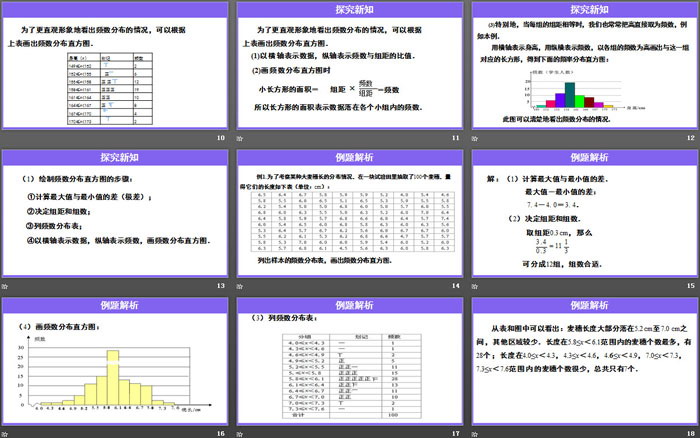
In order to participate in the radio gymnastics competition between all grades in the school, the seventh grade students are going to select 40 students of similar heights from 63 students to participate in the competition. For this purpose, the heights of these 63 students were collected.
(1) Calculate the difference between the maximum value and the minimum value (range)
The minimum value is 149, the maximum value is 172, 172-149=23.
Explain that the range of height changes is 23.
(2) Determine the group distance and number of groups
Divide all data into several groups, and the distance between the two endpoints of each group (the value range of the data within the group) is called the group distance.
If we take 3 cm as a group.
Divided into 8 groups, 149≤x<152, 152≤x<155,…, 170≤x<173. The number of groups is 8 and the distance between groups is 3.
There is no fixed standard for determining the group distance and number of groups. It must be determined based on experience and specific research problems. Usually the more data there is, the more groups it is divided into. When the data is less than 100, it is usually divided into 5 to 12 groups according to the amount of data.
Histogram PPT, the third part: analysis of examples
Example 1. In order to examine the distribution of ear length of a certain type of barley, 100 ears of wheat were sampled from an experimental field, and their lengths were measured as shown in the following table (unit: cm):
List the frequency distribution table of the sample and draw the frequency distribution histogram.
Solution: (1) Calculate the difference between the maximum value and the minimum value.
Difference between maximum value and minimum value:
7.4-4.0=3.4.
(2) Determine the group distance and number of groups.
Taking the group distance to be 0.3 cm, then
Can be divided into 12 groups, the number of groups is appropriate.
Histogram PPT, Part 4: Classroom Exercises
1. In the frequency distribution table, the sum of the frequencies of each group ( ).
A. Less than the sum of the data B. equal to the sum of the data
C. Greater than the sum of data D. Can not be sure
2. In order to draw a frequency distribution histogram of a set of data, we must first calculate the set of
The range of data changes. The range of data changes refers to the ( ) of the data.
A. maximum value b. minimum value
C. The difference between the maximum value and the minimum value D. Number of data
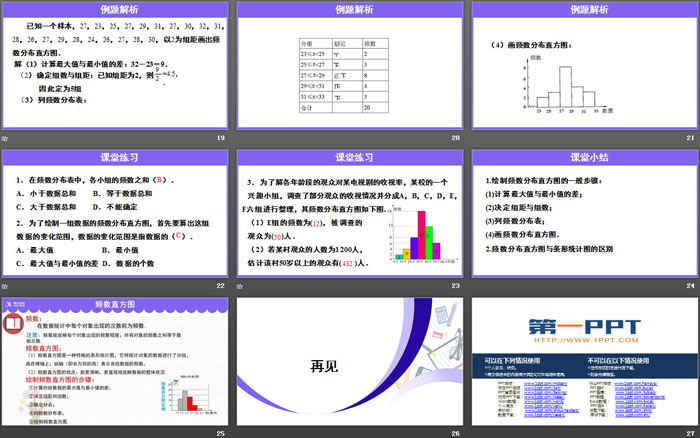
3. In order to understand the ratings of a certain TV series among viewers of various age groups, a student from a certain school
The interest group investigated the viewing status of some viewers and divided them into six groups: A, B, C, D, E, and F. The frequency distribution histogram is as shown below.
(1) The frequency of group E is ( ), and the number of viewers surveyed is ( ).
(2) If the number of spectators in a village is 1,200, it is estimated that there are ( ) spectators over 50 years old in the village.
Histogram PPT, Part 5: Class Summary
1. General steps for drawing a frequency distribution histogram:
(1) Calculate the difference between the maximum value and the minimum value;
(2) Determine the group distance and number of groups;
(3) Column frequency distribution table;
(4) Draw a frequency distribution histogram.
2. The difference between frequency distribution histogram and bar chart
Keywords: free download of PPT courseware for mathematics in the second volume of the seventh grade of the People's Education Press, download of histogram PPT, download of data collection, organization and description PPT, .PPT format;
For more information about the PPT courseware "Collection, Organization and Description of Data Histogram", please click the "Collection, Organization and Description of Data PPT Histogram PPT" tab.
"Histogram" data collection, organization and description PPT free courseware:
"Histogram" Data Collection, Arrangement and Description PPT Free Courseware Part One Content: New Knowledge Analysis We have learned methods of describing data such as bar charts, line charts, and fan charts. Here is another statistical chart commonly used to describe data. Histogram. Question for..
"Histogram" data collection, organization and description PPT courseware download:
"Histogram" Data Collection, Arrangement and Description PPT Courseware Download Part One Content: Learning Objectives: Master the basic steps of using frequency distribution histograms to describe data distribution; (Key Points) Be able to use simple frequency distribution histograms to explain the characteristics contained in the data information,..
"Histogram" data collection, organization and description PPT teaching courseware:
"Histogram" data collection, arrangement and description PPT teaching courseware Part 1: Review Do you still remember the characteristics of each statistical chart? Bar charts can clearly show the specific number of each item. Line charts can clearly reflect things.
File Info
Update Time: 2024-10-05
This template belongs to Mathematics courseware People's Education Press Seventh Grade Mathematics Volume 2 industry PPT template
"Histogram" data collection, organization and description PPT download Simple campus recruitment activity planning plan summary enterprise and institution recruitment publicity lecture PPT template is a general PPT template for business post competition provided by the manuscript PPT, simple campus recruitment activity planning plan summary enterprise and institution recruitment promotion Lecture PPT template, you can edit and modify the text and pictures in the source file by downloading the source file. If you want more exquisite business PPT templates, you can come to grid resource. Doug resource PPT, massive PPT template slide material download, we only make high-quality PPT templates!
Tips: If you open the template and feel that it is not suitable for all your needs, you can search for related content "Histogram" data collection, organization and description PPT download is enough.
How to use the Windows system template
Directly decompress the file and use it with office or wps
How to use the Mac system template
Directly decompress the file and use it Office or wps can be used
Related reading
For more detailed PPT-related tutorials and font tutorials, you can view: Click to see
How to create a high-quality technological sense PPT? 4 ways to share the bottom of the box
Notice
Do not download in WeChat, Zhihu, QQ, built-in browsers, please use mobile browsers to download! If you are a mobile phone user, please download it on your computer!
1. The manuscript PPT is only for study and reference, please delete it 24 hours after downloading.
2. If the resource involves your legitimate rights and interests, delete it immediately.
3. Contact information: service@daogebangong.com
"Histogram" data collection, organization and description PPT download, due to usage restrictions, it is only for personal study and reference use. For commercial use, please go to the relevant official website for authorization.
(Personal non-commercial use refers to the use of this font to complete the display of personal works, including but not limited to the design of personal papers, resumes, etc.)
Preview
Related Search:
"Histogram" data collection, organization and description PPT download
2024-10-05
Copyright statement: This material is compiled and released by the user of Daoge Resources. The copyright belongs to the author. For commercial use, please contact the copyright owner. If there is any infringement, please contact the webmaster to remove the resource.
Download Points: 0.00
Free Download
Upgrade VIP
Favorite
Views: 4914 / Downloads: 469


