Western Normal University Edition First Grade Mathematics Volume 1
Beijing Normal University Edition Seventh Grade Mathematics Volume 1
People's Education Press First Grade Mathematics Volume 1
People's Education Press Second Grade Mathematics Volume 1
Beijing Normal University Edition Seventh Grade Mathematics Volume 2
People's Education Press Third Grade Mathematics Volume 1
Beijing Normal University Edition Eighth Grade Mathematics Volume 1
Qingdao Edition Seventh Grade Mathematics Volume 1
Beijing Normal University Edition Fifth Grade Mathematics Volume 1
Hebei Education Edition Third Grade Mathematics Volume 1
Hebei Education Edition Seventh Grade Mathematics Volume 2
People's Education Press First Grade Mathematics Volume 2
People's Education High School Mathematics Edition B Compulsory Course 2
Qingdao Edition Seventh Grade Mathematics Volume 2
Beijing Normal University Edition Fifth Grade Mathematics Volume 2
Hebei Education Edition Fourth Grade Mathematics Volume 2

| Category | Format | Size |
|---|---|---|
| Hebei Education Edition Ninth Grade Mathematics Volume 2 | pptx | 6 MB |

"Estimating Probability Using Frequency" PPT download
2024-11-22
Copyright statement: This material is compiled and released by the user of Daoge Resources. The copyright belongs to the author. For commercial use, please contact the copyright owner. If there is any infringement, please contact the webmaster to remove the resource.
Download Points: 0.00
Free Download
Upgrade VIP
Favorite
Views: 5089 / Downloads: 395
Description
"Estimating Probability Using Frequency" PPT download
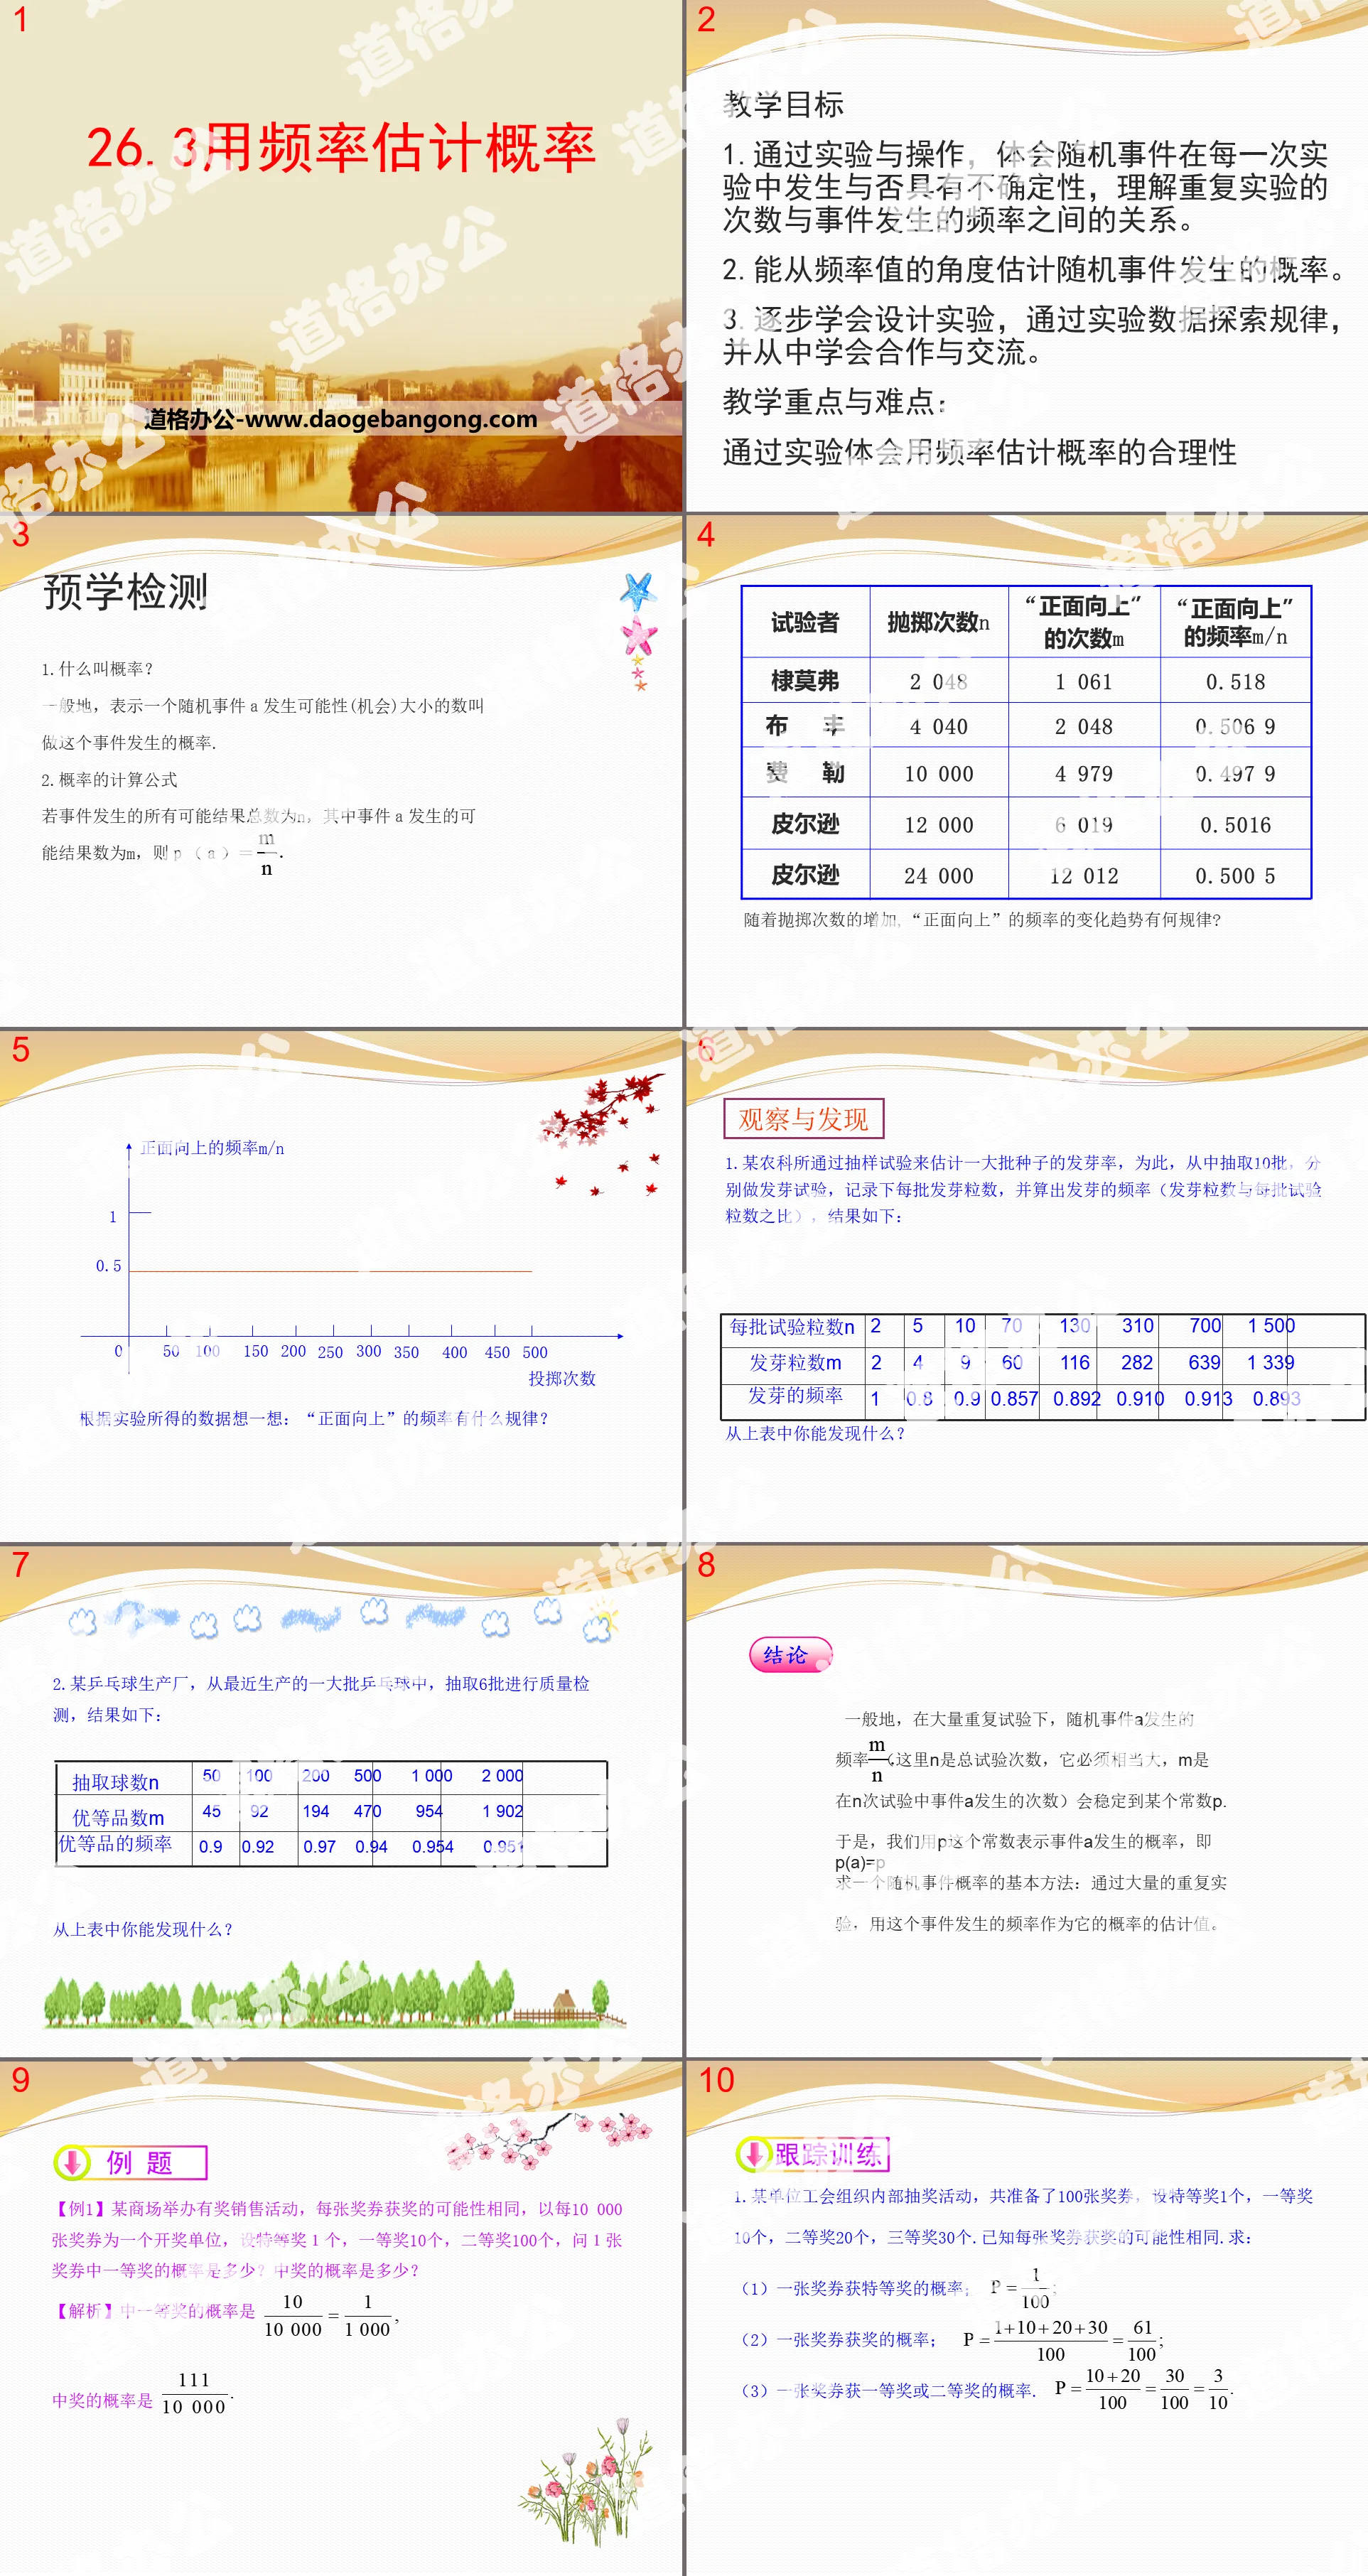
Part One: Teaching Objectives
1. Through experiments and operations, understand the uncertainty of whether random events will occur in each experiment, and understand the relationship between the number of repeated experiments and the frequency of events.
2. Able to estimate the probability of random events from the perspective of frequency values.
3. Gradually learn to design experiments, explore patterns through experimental data, and learn to cooperate and communicate.
Teaching focus and difficulties:
Experience the rationality of using frequency to estimate probability through experiments
pre-study test
1. What is probability?
Generally speaking, the number that represents the likelihood (chance) of a random event A is called the probability of the event.
2. Calculation formula of probability
If the total number of all possible outcomes of an event is n, and the number of possible outcomes of event A is m, then P(A)=m/n
Using frequency to estimate probability PPT, part 2: observation and discovery
1. An agricultural science institute estimated the germination rate of a large number of seeds through sampling tests. To this end, 10 batches were selected, and germination tests were conducted respectively. The number of germination grains in each batch was recorded, and the frequency of germination (the number of germination grains and the number of germination grains per seed) was calculated. The ratio of the number of particles in the batch test), the results are as follows:
What can you find from the table above?
2. A table tennis production factory selected 6 batches of recently produced table tennis balls for quality inspection. The results are as follows:
What can you find from the table above?
in conclusion
Generally, under a large number of repeated experiments, the frequency of occurrence of random event A m/n (where n is the total number of trials, which must be quite large, and m is the number of times event A occurs in n trials) will stabilize to a certain constant. p.
Therefore, we use the constant p to represent the probability of event A happening, that is, P(A)=p
The basic method to find the probability of a random event: through a large number of repeated experiments, use the frequency of the event as an estimate of its probability.
Using frequency to estimate probability PPT, part three: analysis of examples
[Example 1] A shopping mall holds a sales event with prizes. Each lottery ticket has the same possibility of winning. Taking every 10,000 lottery tickets as a lottery unit, there are 1 special prize, 10 first prizes, and 100 second prizes. What is the probability of winning the first prize with 1 lottery ticket? What is the probability of winning?
[Analysis] The probability of winning the first prize is 10/10000=1/1000
The probability of winning is 111/1000
[Example 2] The life table, also known as the death table, is the main basis for calculating life insurance premium rates. The picture on the right is a partial excerpt from the China Life Insurance Experience Life Table (2006-2009) released by the People's Bank of China in June 2010. Estimate the following probabilities according to the table (retain 4 significant figures for the results).
Using frequency to estimate probability PPT, part 4: in-class training
1. (Chenzhou High School Entrance Examination) The toy store run by Xiaoying’s mother once received a box of 3,000 plastic balls in black and white. In order to estimate how many balls of each color there were, she mixed the balls in the box. After mixing, she randomly picked out a ball and noted the color, then put it back into the box. After repeating the above process many times, she found that the frequency of black balls fluctuated around 0.7. Based on this, she could estimate that the number of black balls was approximately Is.
Answer: 2 100
2. (Qingdao High School Entrance Examination) There are 10 red balls and several yellow balls in a pocket. Under the premise that counting the balls is not allowed, in order to estimate the number of yellow balls in the pocket, Xiao Ming adopts the following method: first take out 10 balls from the pocket each time, and find the number of red balls among them and 10 Ratio, then put the ball back into the pocket and shake it well. Repeat the above process 20 times. The average ratio of the number of red balls to 10 is 0.4. Based on the above data, it is estimated that there are approximately ____ yellow balls in the pocket.
Answer: 15
3. In a small town of 100,000 people, 2,000 people were randomly surveyed, and 250 of them watched the morning news on CCTV. Ask a random person in the town, what is the approximate probability that he watches the morning news? Approximately how many people in this town watch the morning news on CCTV?
[Analysis] According to the meaning of probability, it can be considered that the probability is approximately equal to
250/2 000=0.125.
The town has about 100 000 × 0.125 = 12 500 (people)
Watch the morning news on CCTV.
Using frequency to estimate probability PPT, part 5: summary improvement
Through the study of this class, we need to master:
1. Use the conditions and methods of frequency estimation probability and apply the above content to solve some practical problems.
2. On the surface, every observation of a random phenomenon is accidental, but if you observe a random phenomenon multiple times, you can immediately find that there are inevitable laws among a large number of accidents.
Keywords: Free download of Hebei Education Edition mathematics PPT courseware for the second volume of the ninth grade, using frequency to estimate probability PPT download, .PPT format;
For more information about the PPT courseware "Estimating Probability Using Frequency", please click the Estimating Probability Using Frequency ppt tag.
"Estimating Probability Using Frequency" PPT courseware download:
"Using Frequency to Estimate Probability" PPT courseware download Part 1: Learning objectives: Through experiments, statistics and other activities, be able to use experimental methods to estimate the probability of some complex random events. New Lesson Introduction The following events are certain events: ( ) A. Throw one...
"Estimating Probability Using Frequency" PPT courseware:
Contents of the first part of the PPT courseware "Using Frequency to Estimate Probability": Do it (1) Toss an even coin 400 times. Every 50 times, record the number of heads and tails. After summarizing the data, complete the following table : (2) Based on the data in the above table, draw a polyline in the graph..
"Estimating Probability Using Frequency" PPT:
"Using Frequency to Estimate Probability" PPT Part One Content: Knowledge Review Questions (choose one of the two questions): 1. Throw a die, the probability that the number on the upward side is 6 is_. Equally possible events. Various outcomes are equally likely to occur. The results of an experiment are finite..
File Info
Update Time: 2024-11-22
This template belongs to Mathematics courseware Hebei Education Edition Ninth Grade Mathematics Volume 2 industry PPT template
"Estimating Probability Using Frequency" PPT download Simple campus recruitment activity planning plan summary enterprise and institution recruitment publicity lecture PPT template is a general PPT template for business post competition provided by the manuscript PPT, simple campus recruitment activity planning plan summary enterprise and institution recruitment promotion Lecture PPT template, you can edit and modify the text and pictures in the source file by downloading the source file. If you want more exquisite business PPT templates, you can come to grid resource. Doug resource PPT, massive PPT template slide material download, we only make high-quality PPT templates!
Tips: If you open the template and feel that it is not suitable for all your needs, you can search for related content "Estimating Probability Using Frequency" PPT download is enough.
How to use the Windows system template
Directly decompress the file and use it with office or wps
How to use the Mac system template
Directly decompress the file and use it Office or wps can be used
Related reading
For more detailed PPT-related tutorials and font tutorials, you can view: Click to see
How to create a high-quality technological sense PPT? 4 ways to share the bottom of the box
Notice
Do not download in WeChat, Zhihu, QQ, built-in browsers, please use mobile browsers to download! If you are a mobile phone user, please download it on your computer!
1. The manuscript PPT is only for study and reference, please delete it 24 hours after downloading.
2. If the resource involves your legitimate rights and interests, delete it immediately.
3. Contact information: service@daogebangong.com
"Estimating Probability Using Frequency" PPT download, due to usage restrictions, it is only for personal study and reference use. For commercial use, please go to the relevant official website for authorization.
(Personal non-commercial use refers to the use of this font to complete the display of personal works, including but not limited to the design of personal papers, resumes, etc.)
Preview
Related Search:
"Estimating Probability Using Frequency" PPT download
2024-11-22
Copyright statement: This material is compiled and released by the user of Daoge Resources. The copyright belongs to the author. For commercial use, please contact the copyright owner. If there is any infringement, please contact the webmaster to remove the resource.
Download Points: 0.00
Free Download
Upgrade VIP
Favorite
Views: 5089 / Downloads: 395


