
| Category | Format | Size |
|---|---|---|
| Beijing Normal University Edition Fifth Grade Mathematics Volume 2 | pptx | 6 MB |

"Compound Line Statistical Schema" data analysis and organization PPT courseware
Description
"Compound Line Statistical Schema" data analysis and organization PPT courseware
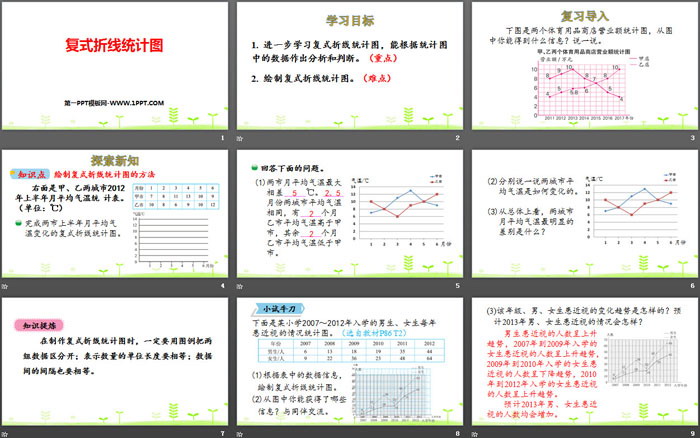
Part One: Learning Objectives
1. Further study the compound line statistical chart and be able to make analysis and judgment based on the data in the statistical chart. (emphasis)
2. Draw a compound line statistical chart. (difficulty)
Polyline statistical diagram PPT, the second part: exploring new knowledge
Knowledge Points: Methods of Drawing Compound Line Statistical Charts
On the right is a statistical table of monthly average temperatures in cities A and B in the first half of 2012. (Unit: ℃)
Completion of the compound line statistical chart of monthly average temperature changes in the two cities in the first half of the year.
Answer the questions below.
(1)The maximum monthly average temperature difference between the two cities is _____℃. The average temperatures of the two cities are the same in _____ months. In _____ months, the average temperature of City B is higher than that of City A. In the remaining _____ months, the average temperature of City B is lower than that of City A.
(2) Let’s talk about how the average temperature of the two cities changes.
(3) Overall, what is the most obvious difference in the monthly average temperatures between the two cities?
Knowledge refining
When making a compound line chart, legends must be used to separate the two sets of data; the lengths of the units representing quantities must be equal; and the intervals between data must also be equal.
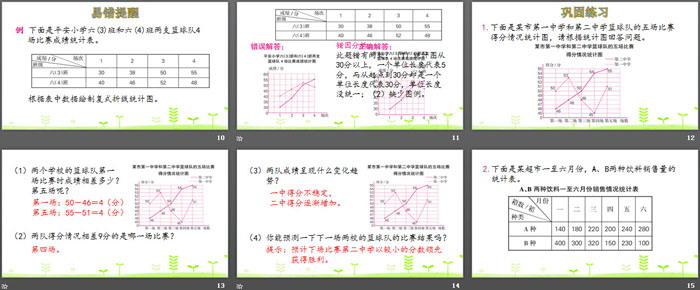
Polyline statistical diagram PPT, the third part: consolidation practice
1. The following is a statistical chart of the scores of the basketball teams of the No. 1 Middle School and the No. 2 Middle School in a certain city in five games. Please answer the questions based on the statistical chart.
(1) What is the difference in the scores of the basketball teams from the two schools in the first game? What about Game 5?
Game 1: 50-46=4 (points)
Game 5: 55-51=4 (points)
(2) In which game was the score difference between the two teams 9 points?
Game 4.
(3) What is the trend of changes in the results of the two teams?
The score in the first center is unstable,
The score in the second center gradually increased.
(4) Can you predict the result of the next basketball team game between the two schools?
Tip: The second middle school is expected to win the next game with a smaller lead.
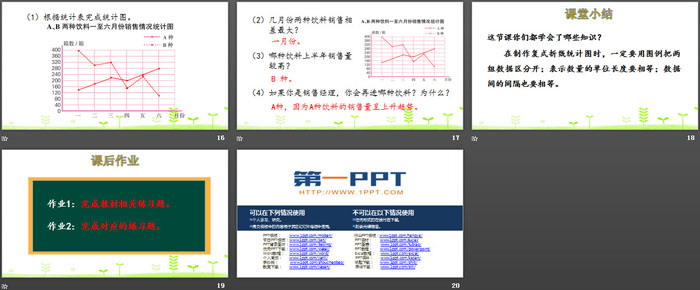
Polyline statistical diagram PPT, part 4 content: Class summary
What knowledge have you learned in this class?
When making a compound line chart, legends must be used to separate the two sets of data; the lengths of the units representing quantities must be equal; and the intervals between data must also be equal.
Polyline statistical diagram PPT, part 5: homework
Assignment 1: Complete the exercises related to the textbook.
Assignment 2: Complete the corresponding exercises.
Keywords: Free download of Beijing Normal University Edition fifth grade mathematics PPT courseware for volume 2, polyline statistical diagram PPT download, data analysis and organization PPT download, .PPT format;
For more information about the PPT courseware "Data Analysis and Sorting Compound Line Statistical Chart", please click the Data Analysis and Sorting PPT Complex Polyline Statistical Chart PPT tab.
"Compound Line Statistical Schema" data analysis and organization PPT download:
Analysis and arrangement of data in "Compound Polyline Statistical Chart" PPT download Part One: Learning Objectives 1. Through the study of the highest temperatures in the north and south, understand the compound polyline statistical chart and understand the characteristics of the compound polyline statistical chart. 2. Get as much as possible from the statistical chart..
Analysis and organization of data in "Polyline Statistical Schema" PPT:
"Compound Line Statistical Chart" Data Analysis and Organization PPT Part One Content: Review and Import Earlier we studied the compound bar chart. Think about the characteristics of the compound bar chart? If we want to express the temperature change in a certain place within a year What situation should we draw...
File Info
Update Time: 2024-07-29
This template belongs to Mathematics courseware Beijing Normal University Edition Fifth Grade Mathematics Volume 2 industry PPT template
"Compound Line Statistical Schema" data analysis and organization PPT courseware Simple campus recruitment activity planning plan summary enterprise and institution recruitment publicity lecture PPT template is a general PPT template for business post competition provided by the manuscript PPT, simple campus recruitment activity planning plan summary enterprise and institution recruitment promotion Lecture PPT template, you can edit and modify the text and pictures in the source file by downloading the source file. If you want more exquisite business PPT templates, you can come to grid resource. Doug resource PPT, massive PPT template slide material download, we only make high-quality PPT templates!
Tips: If you open the template and feel that it is not suitable for all your needs, you can search for related content "Compound Line Statistical Schema" data analysis and organization PPT courseware is enough.
How to use the Windows system template
Directly decompress the file and use it with office or wps
How to use the Mac system template
Directly decompress the file and use it Office or wps can be used
Related reading
For more detailed PPT-related tutorials and font tutorials, you can view: Click to see
How to create a high-quality technological sense PPT? 4 ways to share the bottom of the box
Notice
Do not download in WeChat, Zhihu, QQ, built-in browsers, please use mobile browsers to download! If you are a mobile phone user, please download it on your computer!
1. The manuscript PPT is only for study and reference, please delete it 24 hours after downloading.
2. If the resource involves your legitimate rights and interests, delete it immediately.
3. Contact information: service@daogebangong.com
"Compound Line Statistical Schema" data analysis and organization PPT courseware, due to usage restrictions, it is only for personal study and reference use. For commercial use, please go to the relevant official website for authorization.
(Personal non-commercial use refers to the use of this font to complete the display of personal works, including but not limited to the design of personal papers, resumes, etc.)
Preview
Related Search: