Western Normal University Edition First Grade Mathematics Volume 1
Beijing Normal University Edition Seventh Grade Mathematics Volume 1
People's Education Press First Grade Mathematics Volume 1
People's Education Press Third Grade Mathematics Volume 1
People's Education Press Second Grade Mathematics Volume 1
Beijing Normal University Edition Seventh Grade Mathematics Volume 2
Beijing Normal University Edition Fifth Grade Mathematics Volume 1
Qingdao Edition Seventh Grade Mathematics Volume 1
Hebei Education Edition Third Grade Mathematics Volume 1
Beijing Normal University Edition Eighth Grade Mathematics Volume 1
People's Education High School Mathematics Edition B Compulsory Course 2
Hebei Education Edition Seventh Grade Mathematics Volume 2
Beijing Normal University Edition Fifth Grade Mathematics Volume 2
Hebei Education Edition Fourth Grade Mathematics Volume 2
Qingdao Edition Seventh Grade Mathematics Volume 2
Jiangsu Education Edition Fourth Grade Mathematics Volume 1

| Category | Format | Size |
|---|---|---|
| Beijing Normal University Edition Seventh Grade Mathematics Volume 1 | pptx | 6 MB |

"Representation of Data" Collection and Organization of Data PPT Download (Lesson 2)
2024-10-07
Copyright statement: This material is compiled and released by the user of Daoge Resources. The copyright belongs to the author. For commercial use, please contact the copyright owner. If there is any infringement, please contact the webmaster to remove the resource.
Download Points: 0.00
Free Download
Upgrade VIP
Favorite
Views: 1892 / Downloads: 795
Description
"Representation of Data" Collection and Organization of Data PPT Download (Lesson 2)
Part One Content: Basic Knowledge Key Points
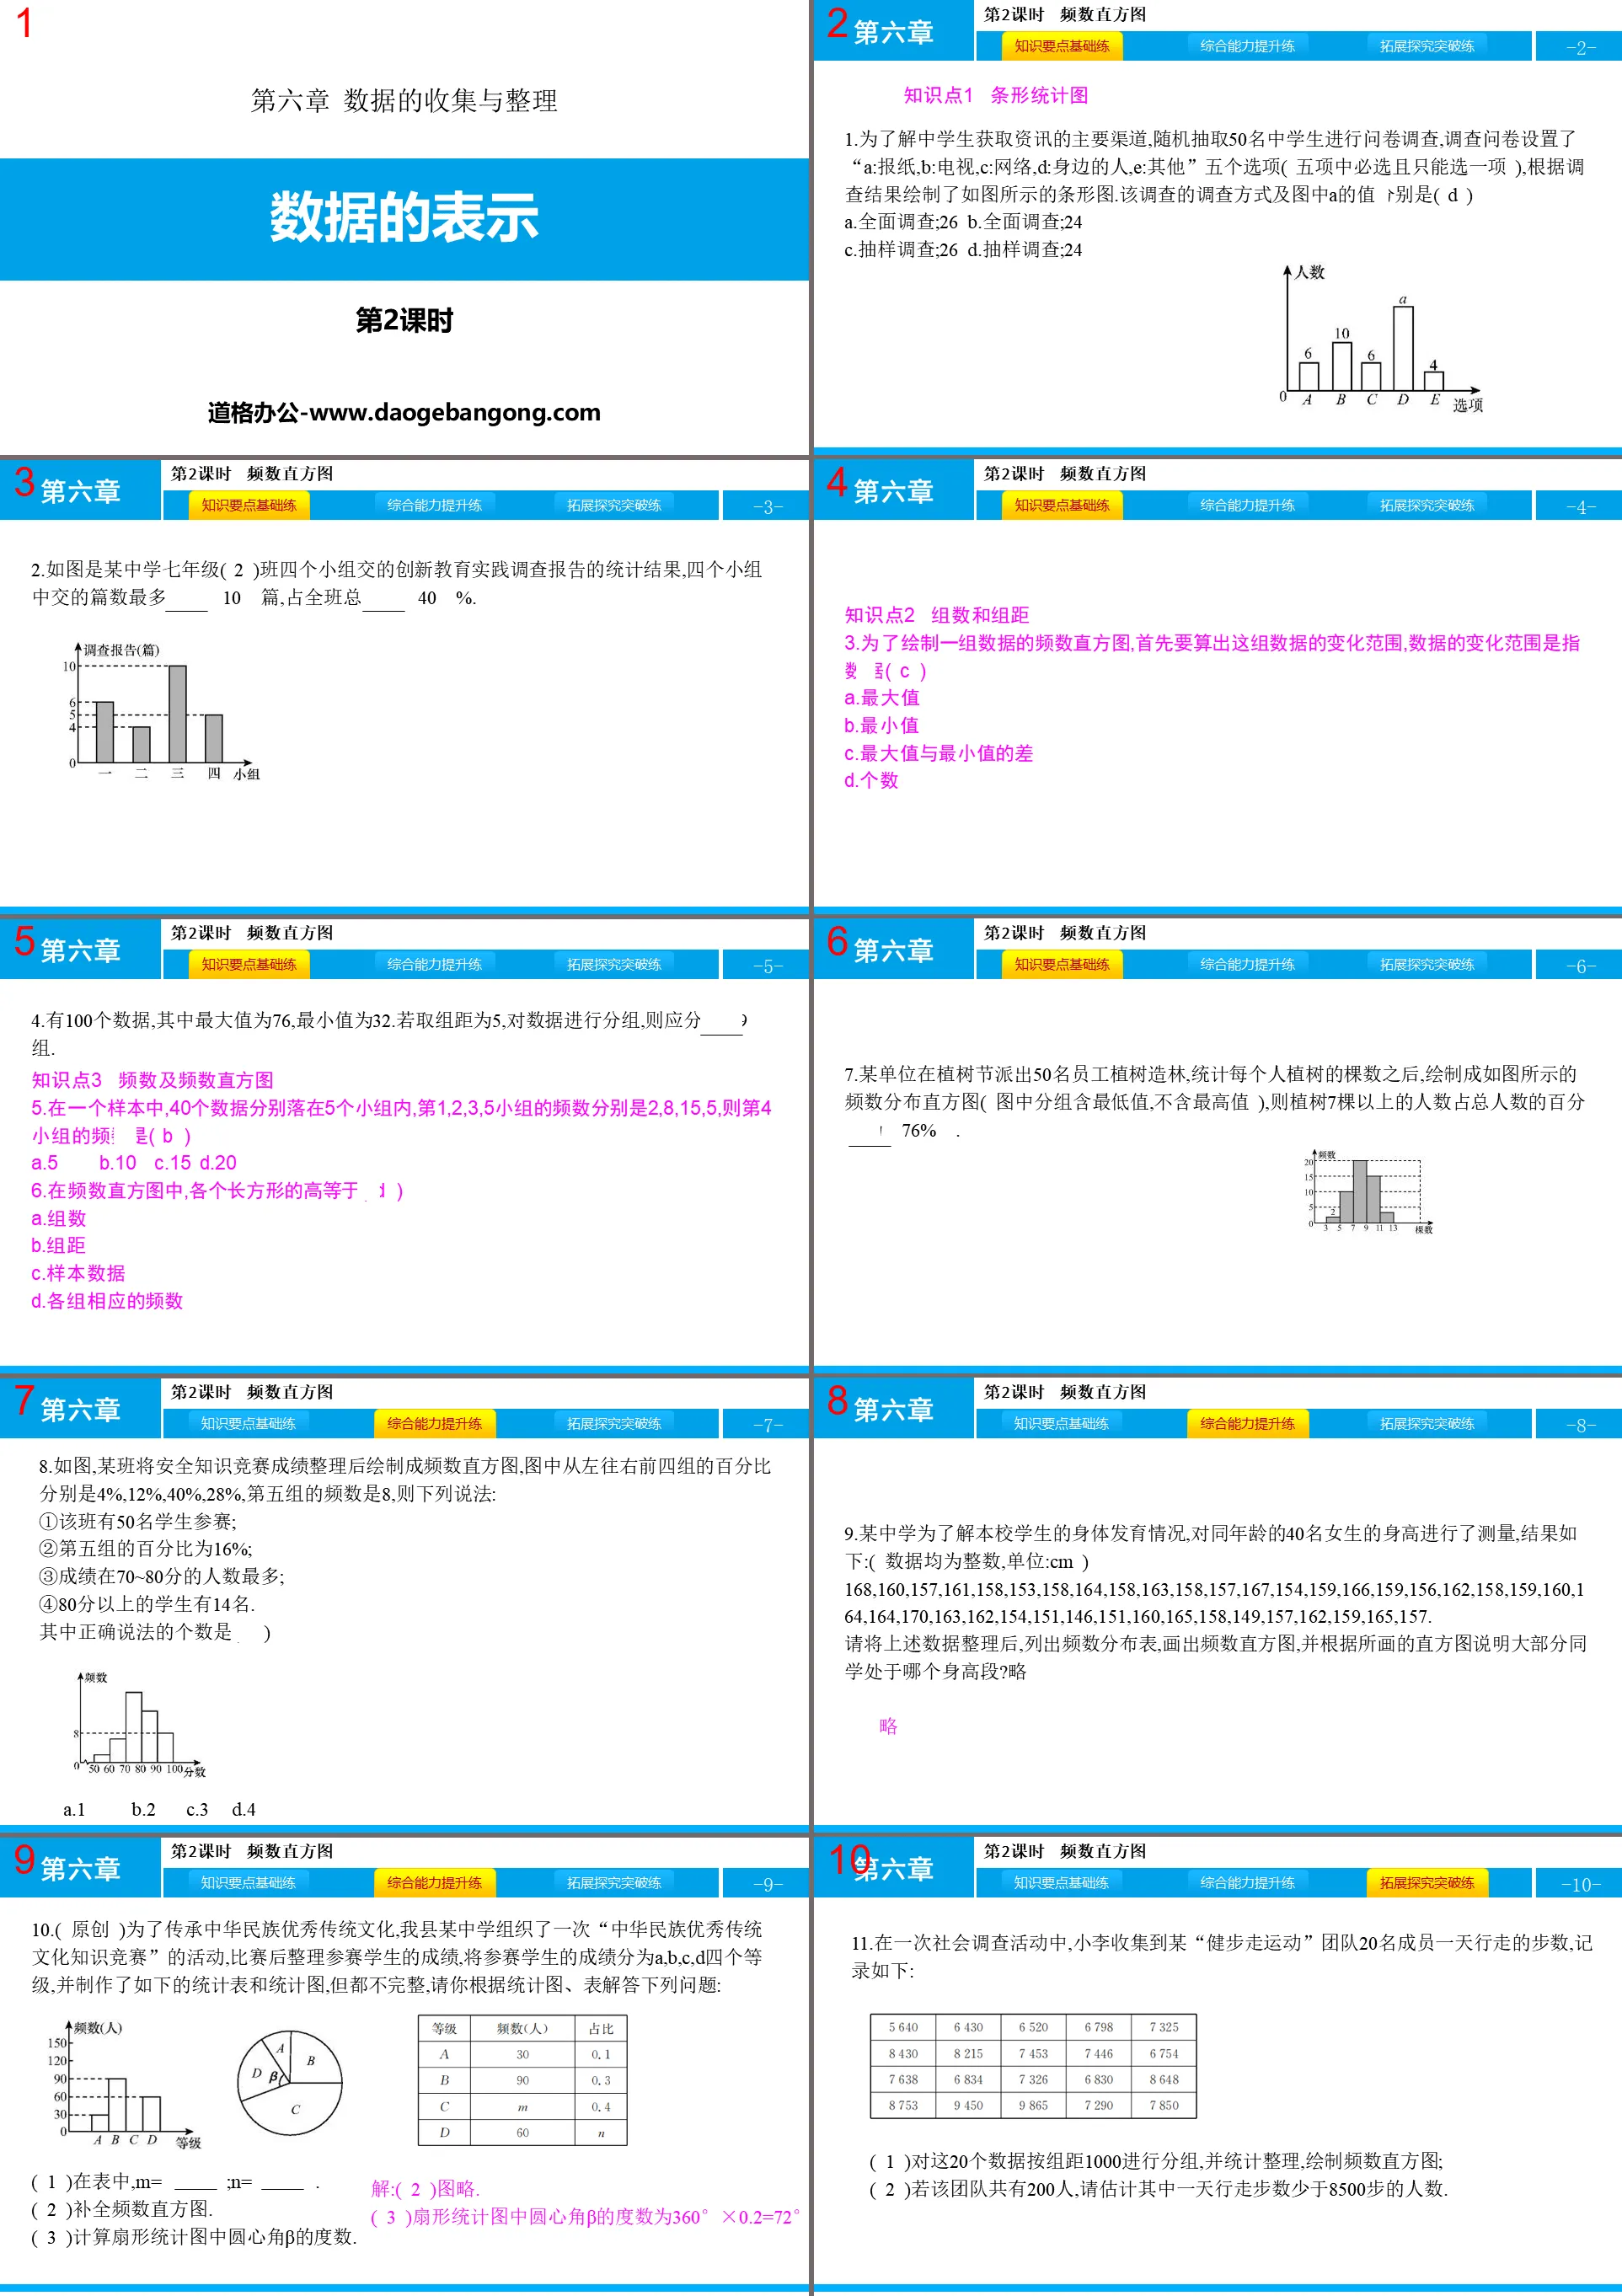
Knowledge Point 1 Bar Chart
1. In order to understand the main channels through which middle school students obtain information, 50 middle school students were randomly selected for a questionnaire survey. The questionnaire set up five options: "A: Newspaper, B: TV, C: Internet, D: People around you, E: Others". (You must choose one of the five items and you can only choose one). Based on the survey results, a bar chart as shown in the figure is drawn. The survey method and the value of a in the chart are (D)
A.Comprehensive investigation;26 B.Comprehensive investigation;24
C. Sampling survey; 26 D. Sampling survey; 24
2. The picture shows the statistical results of innovative education practice survey reports submitted by four groups in the seventh grade class (2) of a middle school. Among the four groups, the largest number of submissions was 10, accounting for 40% of the total number of the class.
Knowledge point 2: Number of groups and distance between groups
3. In order to draw a frequency histogram of a set of data, we must first calculate the variation range of this set of data. The variation range of the data refers to the data (C)
A. Maximum value
B. Minimum value
C. The difference between the maximum value and the minimum value
D.Number
4. There are 100 data, the maximum value is 76, and the minimum value is 32. If the group distance is 5 and the data is grouped, it should be divided into 9 groups.
Knowledge point 3 Frequency and frequency histogram
5. In a sample, 40 data fall into 5 groups respectively. The frequencies of groups 1, 2, 3, and 5 are 2, 8, 15, and 5 respectively. Then the frequency of group 4 is (B)
A.5 B.10 C.15 D.20
6. In the frequency histogram, the height of each rectangle is equal to (D)
A.Number of groups
B. Group distance
C.Sample data
D. The corresponding frequency of each group
Data representation PPT, part 2: improvement of comprehensive capabilities
8. As shown in the figure, a certain class organized the safety knowledge competition results and drew them into a frequency histogram. The percentages of the first four groups from left to right in the figure are 4%, 12%, 40%, and 28% respectively. The frequency of the fifth group is 8, then the following statement:
① There are 50 students participating in this class;
②The percentage of the fifth group is 16%;
③The largest number of people have scores between 70 and 80 points;
④There are 14 students with scores of 80 or above.
9. In order to understand the physical development of its students, a middle school measured the height of 40 girls of the same age. The results are as follows: (the data are all integers, unit: cm)
168,160,157,161,158,153,158,164,158,163,158,157,167,154,159,1 66,159,156,162,158,159,160,164,164,170,163,162,154,151,146,151 ,160,165,158,149,157,162,159,165,157.
After sorting the above data, please list the frequency distribution table, draw the frequency histogram, and use the drawn histogram to explain which height range most students are in? Omitted.
10. (Original) In order to inherit the excellent traditional culture of the Chinese nation, a middle school in our county organized a "Knowledge Competition on the Excellent Traditional Culture of the Chinese Nation". After the competition, the scores of the participating students were sorted and divided into A and B. , C and D four levels, and the following statistical tables and charts have been produced, but they are not complete. Please answer the following questions based on the statistical charts and tables:
(1) In the table, m= 120; n= 0.2.
(2) Complete the frequency histogram.
(3) Calculate the degree of the central angle β in the sector chart.
Data representation PPT, the third part: Expansion, exploration and breakthrough
11. In a social survey activity, Xiao Li collected the number of steps taken by 20 members of a "walking sports" team in a day. The records are as follows:
(1) Group these 20 data into groups with a group interval of 1000, sort them statistically, and draw a frequency histogram;
(2) If there are 200 people in the team, please estimate the number of people who walk less than 8,500 steps a day.
Solution: (1) ① Determine the maximum and minimum values of the given data: the minimum value in the above data is 5640, and the maximum value is 9865;
②Group the data appropriately: the difference between the maximum value and the minimum value is 9865-5640=4225, and the group interval is 1000, 4225÷1000=4.225. You can consider dividing it into 5 groups;
③ Count the number of times data appears in each group:
Keywords: Free download of Beijing Normal University Edition seventh-grade mathematics PPT courseware, first volume, data representation PPT download, data collection and organization PPT download, .PPT format;
For more information about the PPT courseware "Data Collection and Organizing Data Representation", please click the Data Collection and Organizing PPT Data Representation PPT tab.
"Representation of Data" Data collection and organization PPT download (Lesson 1):
"Representation of Data" Data collection and arrangement PPT download (Lesson 1) Part 1: Knowledge points Basic knowledge point 1 Application of statistical tables 1. The statistics of the number of people entering and exiting the Zhuzhou Exhibition Hall during four time periods on a certain day are as follows: The time period when the number of people in the museum changes the most...
"Representation of Data" Data Collection and Organization PPT Courseware (Lesson 2):
"Representation of Data" PPT courseware for collecting and organizing data (Lesson 2) Part 1: Learning objectives 1. Clarify the steps of making a frequency histogram, and be able to draw a frequency histogram. (Difficulty) 2. Be able to draw frequency histograms from frequency distribution tables and Obtain relevant information from the frequency histogram and make...
"Representation of Data" Data Collection and Organization PPT Courseware (Lesson 1):
"Representation of Data" Data Collection and Organization PPT Courseware (Lesson 1) Part One: Learning Objectives 1. Understand the characteristics of fan charts and be able to obtain useful information from fan charts. (Key Points) 2. Be able to follow the Steps to create a sector chart Draw a sector...
File Info
Update Time: 2024-10-07
This template belongs to Mathematics courseware Beijing Normal University Edition Seventh Grade Mathematics Volume 1 industry PPT template
"Representation of Data" Collection and Organization of Data PPT Download (Lesson 2) Simple campus recruitment activity planning plan summary enterprise and institution recruitment publicity lecture PPT template is a general PPT template for business post competition provided by the manuscript PPT, simple campus recruitment activity planning plan summary enterprise and institution recruitment promotion Lecture PPT template, you can edit and modify the text and pictures in the source file by downloading the source file. If you want more exquisite business PPT templates, you can come to grid resource. Doug resource PPT, massive PPT template slide material download, we only make high-quality PPT templates!
Tips: If you open the template and feel that it is not suitable for all your needs, you can search for related content "Representation of Data" Collection and Organization of Data PPT Download (Lesson 2) is enough.
How to use the Windows system template
Directly decompress the file and use it with office or wps
How to use the Mac system template
Directly decompress the file and use it Office or wps can be used
Related reading
For more detailed PPT-related tutorials and font tutorials, you can view: Click to see
How to create a high-quality technological sense PPT? 4 ways to share the bottom of the box
Notice
Do not download in WeChat, Zhihu, QQ, built-in browsers, please use mobile browsers to download! If you are a mobile phone user, please download it on your computer!
1. The manuscript PPT is only for study and reference, please delete it 24 hours after downloading.
2. If the resource involves your legitimate rights and interests, delete it immediately.
3. Contact information: service@daogebangong.com
"Representation of Data" Collection and Organization of Data PPT Download (Lesson 2), due to usage restrictions, it is only for personal study and reference use. For commercial use, please go to the relevant official website for authorization.
(Personal non-commercial use refers to the use of this font to complete the display of personal works, including but not limited to the design of personal papers, resumes, etc.)
Preview
Related Search:
"Representation of Data" Collection and Organization of Data PPT Download (Lesson 2)
2024-10-07
Copyright statement: This material is compiled and released by the user of Daoge Resources. The copyright belongs to the author. For commercial use, please contact the copyright owner. If there is any infringement, please contact the webmaster to remove the resource.
Download Points: 0.00
Free Download
Upgrade VIP
Favorite
Views: 1892 / Downloads: 795


