| Category | Format | Size |
|---|---|---|
| Beijing Normal University Edition Seventh Grade Mathematics Volume 1 | pptx | 6 MB |

"Representation of Data" Data Collection and Organization PPT Courseware (Lesson 2)
Description
"Representation of Data" Data Collection and Organization PPT Courseware (Lesson 2)
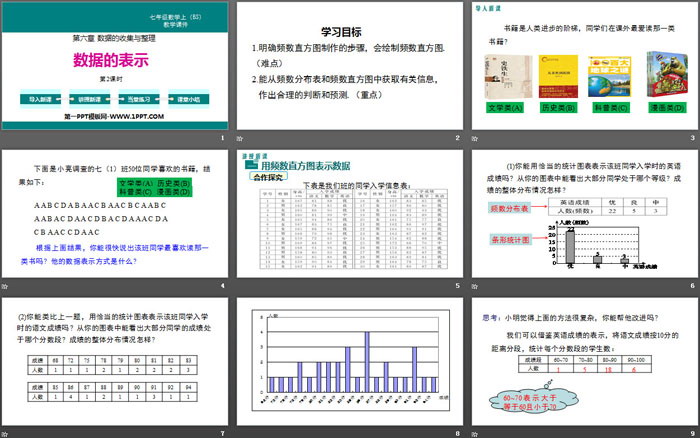
Part One: Learning Objectives
1. Understand the steps of making a frequency histogram and be able to draw a frequency histogram. (Difficulty)
2. Able to obtain relevant information from frequency distribution tables and frequency histograms and make reasonable judgments and predictions. (Key points)
Data Representation PPT, Part 2 Content: Teaching New Lessons
Represent data using frequency histograms
collaborative inquiry
(1) Can you use appropriate statistical charts to represent the English scores of the students in this class when they entered school? From your chart, can you tell which level most students are at? What is the overall distribution of grades?
(2) By analogy with the previous question, can you use appropriate statistical charts to represent the Chinese scores of the students in this class when they entered school? From your chart, can you tell which score range most students fall into? What is the overall distribution of grades?
Thinking: Xiao Ming thinks the above method is very complicated. Can you help him improve it?
Discuss
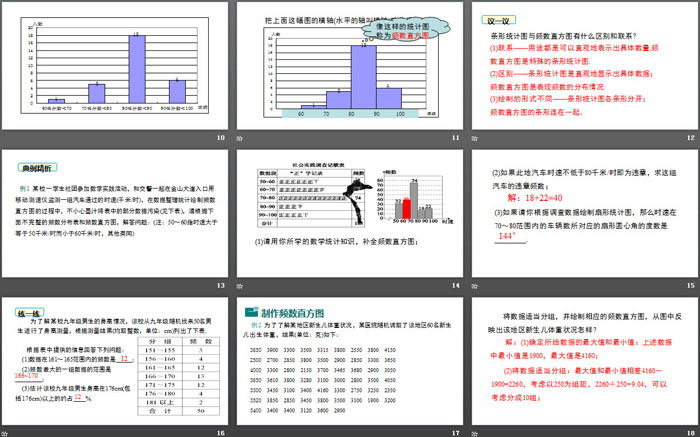
What are the differences and connections between bar graphs and frequency histograms?
(1) Connection - the purpose is to visually represent specific quantities. The frequency histogram is a special bar chart.
(2) Difference - a bar chart visually displays specific data; a frequency histogram shows the distribution of frequencies.
(3) The drawing forms are different - the bars of the bar chart are separated; the bars of the frequency histogram are connected together.
Analysis of classic examples
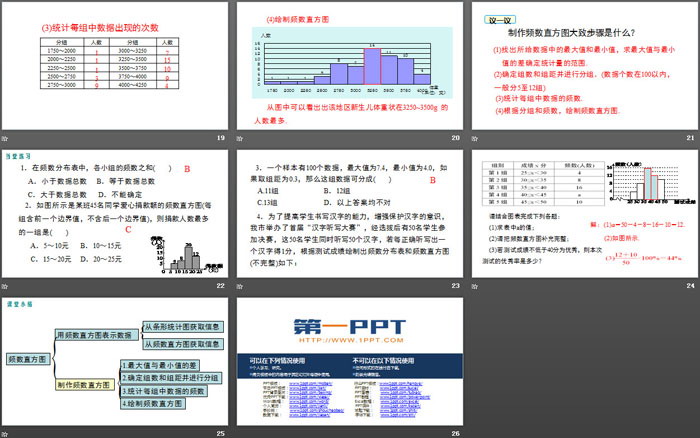
Example 1 A student club from a certain school participated in a mathematics practice activity and used a mobile speedometer to monitor the speed (km/h) of a group of cars passing by at the entrance of Jinshan Avenue with the traffic police. During the process of data compilation and statistical drawing of frequency histograms, Be careful of ink contaminating some of the data in the table (see the table below). Please answer the questions based on the incomplete frequency distribution table and frequency histogram below: (Note: 50 to 60 means the speed is greater than or equal to 50 kilometers per hour and less than 60 kilometers per hour. meters/hour, other similar)
(1) Please use the mathematical statistics knowledge you have learned to complete the frequency histogram;
(2) If the speed of a car here is not less than 80 kilometers per hour, it is a violation. Find the violation frequency of this group of cars;
(3) If you are asked to draw a sector statistical chart based on the survey data, then the degree of the sector central angle corresponding to the number of vehicles with speeds in the range of 70 to 80 km/h is _________.
Data representation PPT, the third part: practice in class
1. In the frequency distribution table, the sum of the frequencies of each group ()
A. Less than the total number of data B. equal to the total number of data
C. Greater than the total number of data D. Can not be sure
2. As shown in the figure is a frequency histogram of the donation amount of 45 students in a certain class (each group includes the previous boundary value, but does not include the latter boundary value), then the group with the largest number of donations is ()
A. 5 to 10 yuan B. 10-15 yuan
C. 15-20 yuan D. 20-25 yuan
3. A sample has 100 data, the maximum value is 7.4, and the minimum value is 4.0. If the group distance is 0.3, then this group of data can be divided into ()
A.11 Group B. 12 groups
C.13 group D. None of the above answers are correct
Data Representation PPT, Part 4: Class Summary
Represent data using frequency histograms
Get information from bar chart
Get information from frequency histogram
Make a frequency histogram
1. The difference between the maximum value and the minimum value
2. Determine the number and spacing of groups and group them
3. Count the frequency of data in each group
4. Draw a frequency histogram
Keywords: Free download of Beijing Normal University Edition seventh-grade mathematics PPT courseware, first volume, data representation PPT download, data collection and organization PPT download, .PPT format;
For more information about the PPT courseware "Data Collection and Organizing Data Representation", please click the Data Collection and Organizing PPT Data Representation PPT tab.
"Representation of Data" Data collection and organization PPT download (Lesson 2):
"Representation of Data" Data collection and arrangement PPT download (Lesson 2) Part 1: Knowledge points Basic knowledge point 1 Bar chart 1. To understand the main channels through which middle school students obtain information, 50 middle school students were randomly selected for a questionnaire survey The questionnaire is set up A..
"Representation of Data" Data collection and organization PPT download (Lesson 1):
"Representation of Data" Data collection and arrangement PPT download (Lesson 1) Part 1: Knowledge points Basic knowledge point 1 Application of statistical tables 1. The statistics of the number of people entering and exiting the Zhuzhou Exhibition Hall during four time periods on a certain day are as follows: The time period when the number of people in the museum changes the most...
"Representation of Data" Data Collection and Organization PPT Courseware (Lesson 1):
"Representation of Data" Data Collection and Organization PPT Courseware (Lesson 1) Part One: Learning Objectives 1. Understand the characteristics of fan charts and be able to obtain useful information from fan charts. (Key Points) 2. Be able to follow the Steps to create a sector chart Draw a sector...
File Info
Update Time: 2024-07-12
This template belongs to Mathematics courseware Beijing Normal University Edition Seventh Grade Mathematics Volume 1 industry PPT template
"Representation of Data" Data Collection and Organization PPT Courseware (Lesson 2) Simple campus recruitment activity planning plan summary enterprise and institution recruitment publicity lecture PPT template is a general PPT template for business post competition provided by the manuscript PPT, simple campus recruitment activity planning plan summary enterprise and institution recruitment promotion Lecture PPT template, you can edit and modify the text and pictures in the source file by downloading the source file. If you want more exquisite business PPT templates, you can come to grid resource. Doug resource PPT, massive PPT template slide material download, we only make high-quality PPT templates!
Tips: If you open the template and feel that it is not suitable for all your needs, you can search for related content "Representation of Data" Data Collection and Organization PPT Courseware (Lesson 2) is enough.
How to use the Windows system template
Directly decompress the file and use it with office or wps
How to use the Mac system template
Directly decompress the file and use it Office or wps can be used
Related reading
For more detailed PPT-related tutorials and font tutorials, you can view: Click to see
How to create a high-quality technological sense PPT? 4 ways to share the bottom of the box
Notice
Do not download in WeChat, Zhihu, QQ, built-in browsers, please use mobile browsers to download! If you are a mobile phone user, please download it on your computer!
1. The manuscript PPT is only for study and reference, please delete it 24 hours after downloading.
2. If the resource involves your legitimate rights and interests, delete it immediately.
3. Contact information: service@daogebangong.com
"Representation of Data" Data Collection and Organization PPT Courseware (Lesson 2), due to usage restrictions, it is only for personal study and reference use. For commercial use, please go to the relevant official website for authorization.
(Personal non-commercial use refers to the use of this font to complete the display of personal works, including but not limited to the design of personal papers, resumes, etc.)
Preview
Related Search: