Western Normal University Edition First Grade Mathematics Volume 1
Beijing Normal University Edition Seventh Grade Mathematics Volume 1
People's Education Press First Grade Mathematics Volume 1
People's Education Press Third Grade Mathematics Volume 1
People's Education Press Second Grade Mathematics Volume 1
Beijing Normal University Edition Seventh Grade Mathematics Volume 2
Beijing Normal University Edition Fifth Grade Mathematics Volume 1
Qingdao Edition Seventh Grade Mathematics Volume 1
Hebei Education Edition Third Grade Mathematics Volume 1
Beijing Normal University Edition Eighth Grade Mathematics Volume 1
Hebei Education Edition Seventh Grade Mathematics Volume 2
People's Education High School Mathematics Edition B Compulsory Course 2
Beijing Normal University Edition Fifth Grade Mathematics Volume 2
Hebei Education Edition Fourth Grade Mathematics Volume 2
Qingdao Edition Seventh Grade Mathematics Volume 2
Jiangsu Education Edition Fourth Grade Mathematics Volume 1

| Category | Format | Size |
|---|---|---|
| Beijing Normal University Edition Seventh Grade Mathematics Volume 1 | pptx | 6 MB |

"Representation of Data" Collection and Organization of Data PPT Download (Lesson 1)
2024-10-05
Copyright statement: This material is compiled and released by the user of Daoge Resources. The copyright belongs to the author. For commercial use, please contact the copyright owner. If there is any infringement, please contact the webmaster to remove the resource.
Download Points: 0.00
Free Download
Upgrade VIP
Favorite
Views: 2606 / Downloads: 837
Description
"Representation of Data" Collection and Organization of Data PPT Download (Lesson 1)
Part One Content: Basic Knowledge Key Points
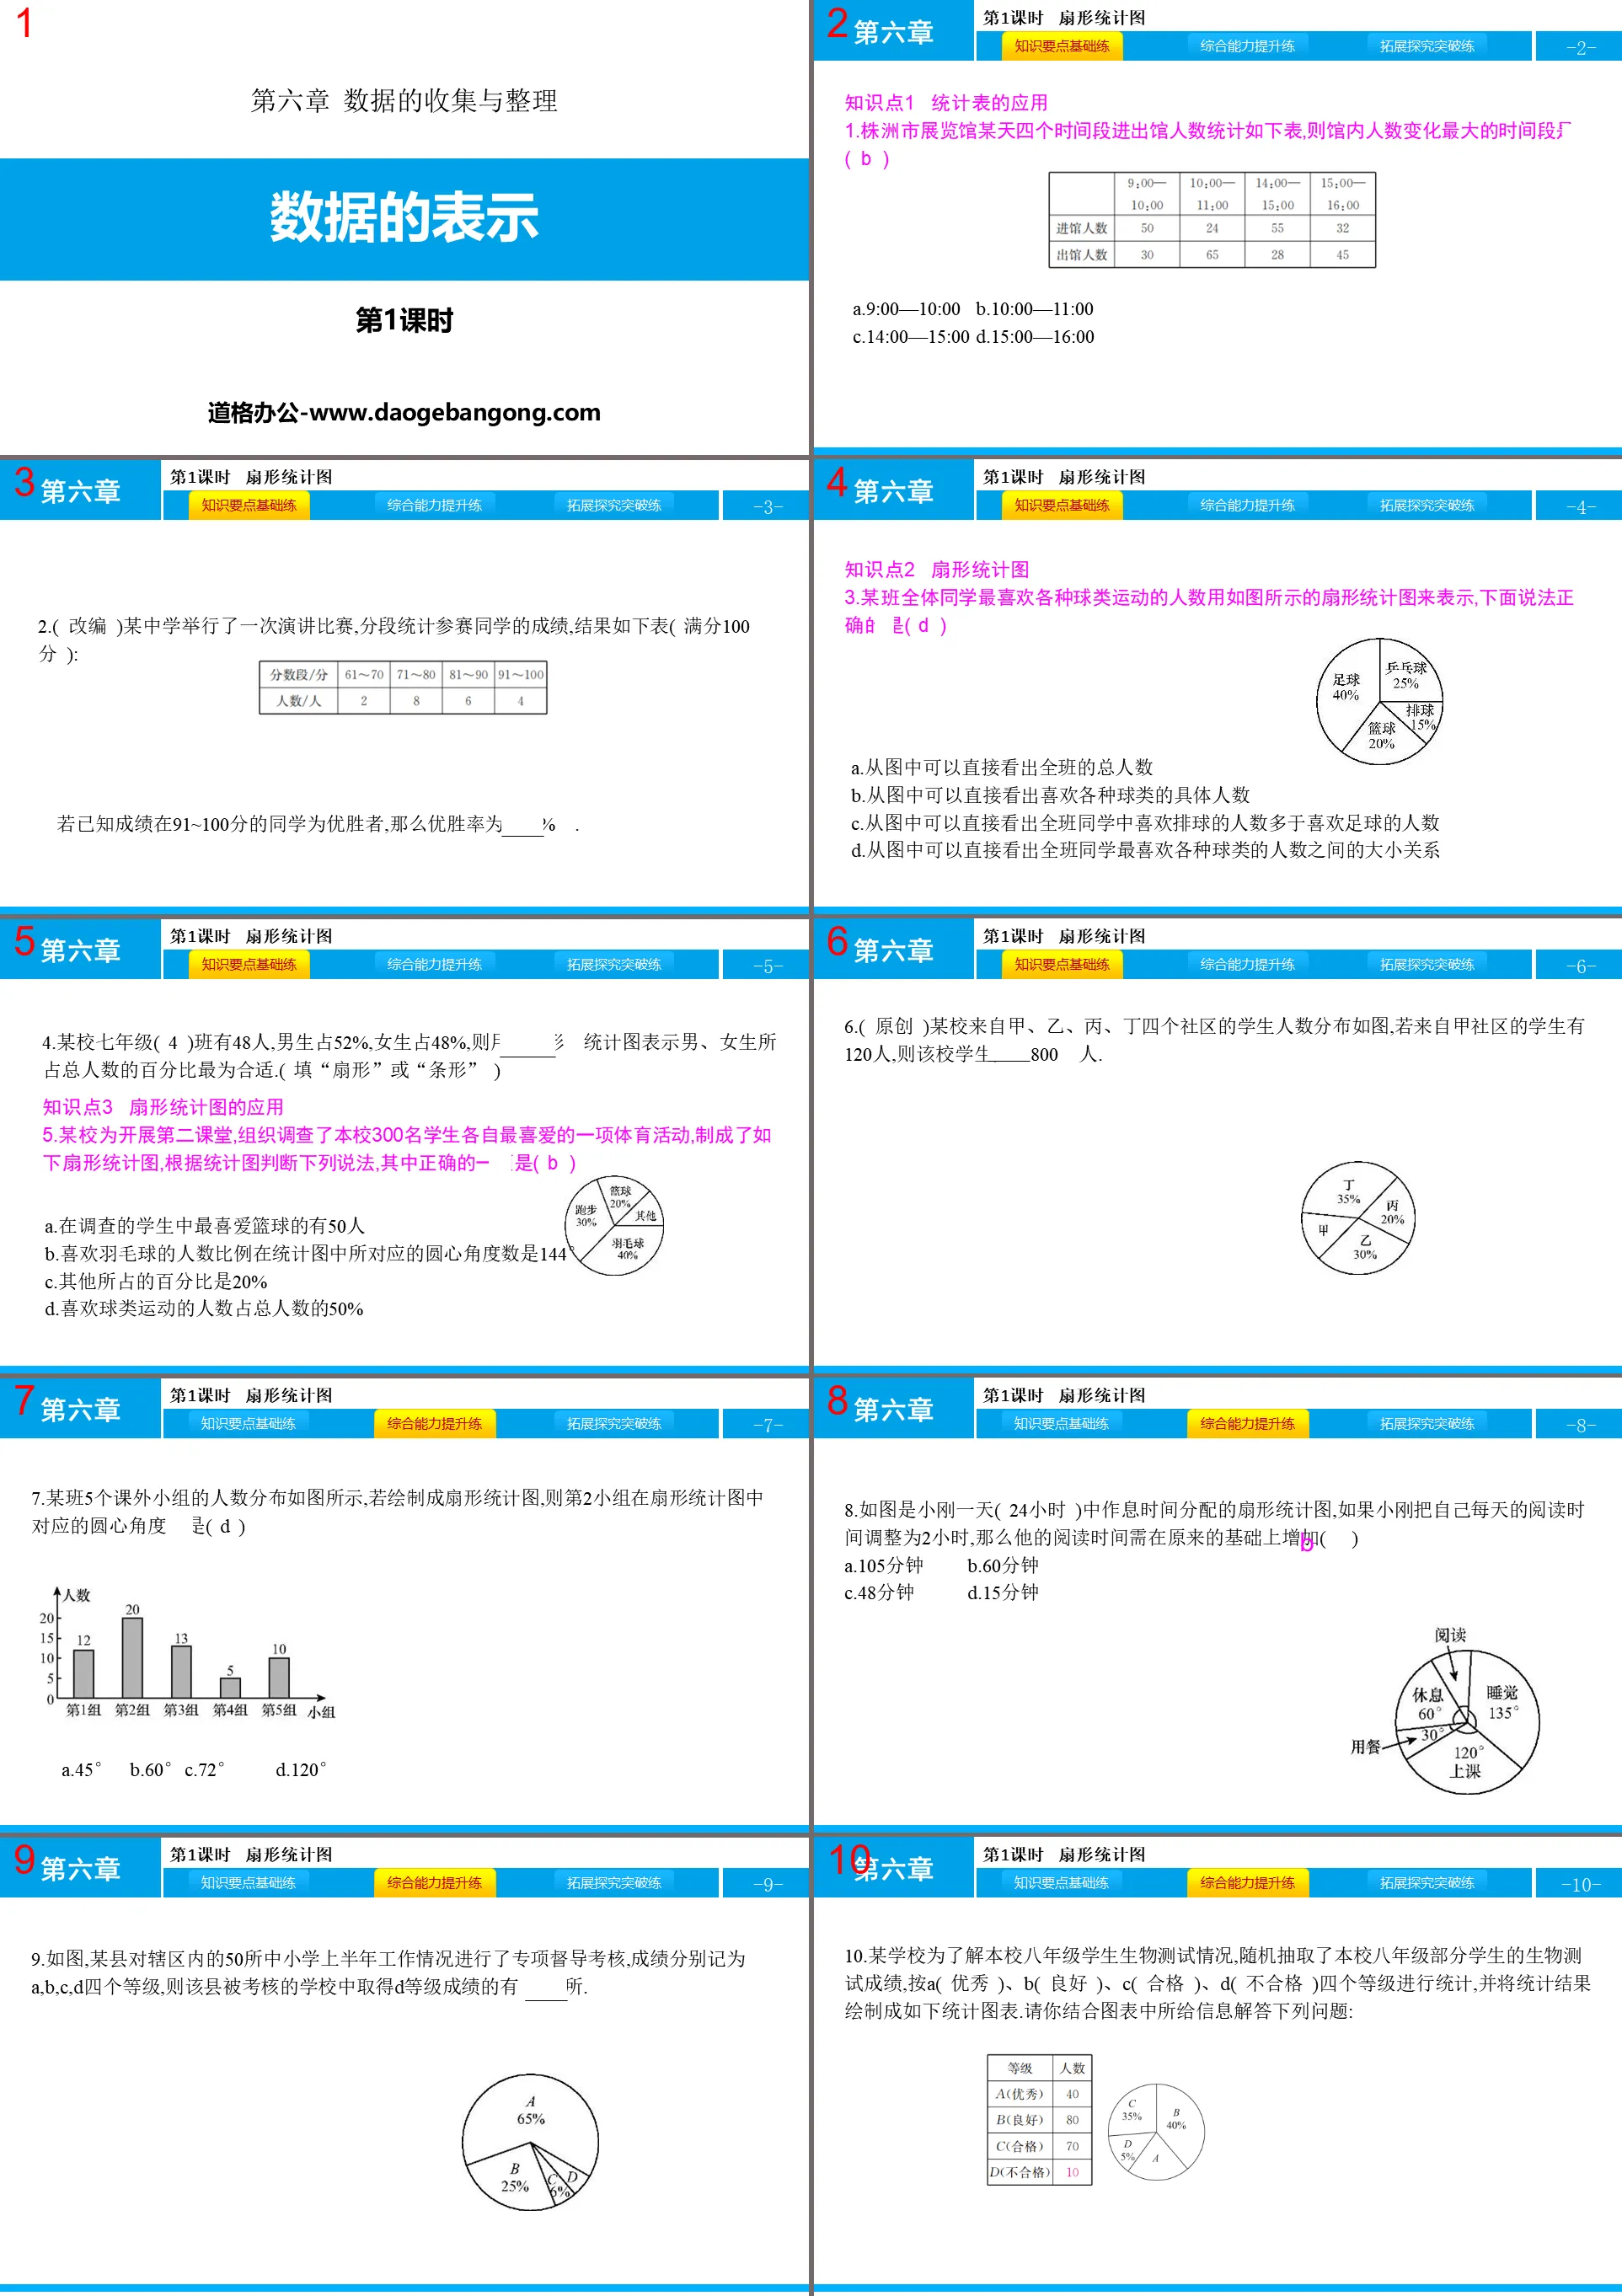
Knowledge point 1 Application of statistical tables
1. The statistics of the number of people entering and exiting the Zhuzhou Exhibition Hall during four time periods on a certain day are as follows. The time period with the largest change in the number of people in the museum is (B)
A.9:00—10:00 B.10:00—11:00
C.14:00—15:00 D.15:00—16:00
2. (Adapted) A middle school held a speech contest, and the scores of the participating students were calculated by segment. The results are as follows (out of 100 points):
If it is known that students with scores between 91 and 100 are winners, then the winning rate is 20%.
Knowledge Point 2 Fan Chart
3. The number of students in a certain class who likes various ball sports the most is represented by the fan-shaped statistical chart as shown in the figure. The following statement is correct (D)
A. You can directly see the total number of people in the class from the picture.
B. From the picture, you can directly see the specific number of people who like various ball games.
C. It can be directly seen from the picture that more students in the class like volleyball than football
D. From the picture, we can directly see the relationship between the number of students in the class who like various ball games the most.
Data representation PPT, part 2: improvement of comprehensive capabilities
7. The population distribution of 5 extracurricular groups in a certain class is as shown in the figure. If drawn into a fan chart, the corresponding center angle of the second group in the fan chart is (D)
A.45° B.60° C.72° D.120°
8. The picture below is a fan chart showing the distribution of Xiaogang’s work and rest time in a day (24 hours). If Xiaogang adjusts his daily reading time to 2 hours, then his reading time needs to be increased on the original basis ( )
A.105 minutes B.60 minutes
C.48 minutes D.15 minutes
9. As shown in the figure, a county conducted a special supervision and assessment on the work of 50 primary and secondary schools in the first half of the year. The results were recorded as four grades: A, B, C, and D. Then the schools in the county that were assessed obtained D There are 2 schools with grade-level results.
10. In order to understand the biology test situation of the eighth grade students in the school, a school randomly selected the biology test scores of some eighth grade students in the school and divided them into four categories: A (excellent), B (good), C (passed), and D (failed). Make statistics based on the level and draw the statistical results into the following statistical chart. Please answer the following questions based on the information given in the chart:
Data representation PPT, the third part: Expansion, exploration and breakthrough
12. A certain city actively carries out the "Sunshine into Campus" activity. Students in each school insist on exercising for one hour every day. Based on the actual situation, a certain school decided to mainly carry out four activities: "A: table tennis, B: basketball, C: running, D: skipping rope". Sports. In order to understand which event students like the most, some students were randomly selected for a survey, and the survey results were drawn into a bar graph as shown in the figure. Please answer the following questions based on the information in the figure:
(1) The percentage of people in the sample who like Project B the most is 20%;
(2) Can this statistical chart be represented by a fan chart? If so, please draw a fan chart.
Keywords: Free download of Beijing Normal University Edition seventh-grade mathematics PPT courseware, first volume, data representation PPT download, data collection and organization PPT download, .PPT format;
For more information about the PPT courseware "Data Collection and Organizing Data Representation", please click the Data Collection and Organizing PPT Data Representation PPT tab.
"Representation of Data" Data collection and organization PPT download (Lesson 2):
"Representation of Data" Data collection and arrangement PPT download (Lesson 2) Part 1: Knowledge points Basic knowledge point 1 Bar chart 1. To understand the main channels through which middle school students obtain information, 50 middle school students were randomly selected for a questionnaire survey The questionnaire is set up A..
"Representation of Data" Data Collection and Organization PPT Courseware (Lesson 2):
"Representation of Data" PPT courseware for collecting and organizing data (Lesson 2) Part 1: Learning objectives 1. Clarify the steps of making a frequency histogram, and be able to draw a frequency histogram. (Difficulty) 2. Be able to draw frequency histograms from frequency distribution tables and Obtain relevant information from the frequency histogram and make...
"Representation of Data" Data Collection and Organization PPT Courseware (Lesson 1):
"Representation of Data" Data Collection and Organization PPT Courseware (Lesson 1) Part One: Learning Objectives 1. Understand the characteristics of fan charts and be able to obtain useful information from fan charts. (Key Points) 2. Be able to follow the Steps to create a sector chart Draw a sector...
File Info
Update Time: 2024-10-05
This template belongs to Mathematics courseware Beijing Normal University Edition Seventh Grade Mathematics Volume 1 industry PPT template
"Representation of Data" Collection and Organization of Data PPT Download (Lesson 1) Simple campus recruitment activity planning plan summary enterprise and institution recruitment publicity lecture PPT template is a general PPT template for business post competition provided by the manuscript PPT, simple campus recruitment activity planning plan summary enterprise and institution recruitment promotion Lecture PPT template, you can edit and modify the text and pictures in the source file by downloading the source file. If you want more exquisite business PPT templates, you can come to grid resource. Doug resource PPT, massive PPT template slide material download, we only make high-quality PPT templates!
Tips: If you open the template and feel that it is not suitable for all your needs, you can search for related content "Representation of Data" Collection and Organization of Data PPT Download (Lesson 1) is enough.
How to use the Windows system template
Directly decompress the file and use it with office or wps
How to use the Mac system template
Directly decompress the file and use it Office or wps can be used
Related reading
For more detailed PPT-related tutorials and font tutorials, you can view: Click to see
How to create a high-quality technological sense PPT? 4 ways to share the bottom of the box
Notice
Do not download in WeChat, Zhihu, QQ, built-in browsers, please use mobile browsers to download! If you are a mobile phone user, please download it on your computer!
1. The manuscript PPT is only for study and reference, please delete it 24 hours after downloading.
2. If the resource involves your legitimate rights and interests, delete it immediately.
3. Contact information: service@daogebangong.com
"Representation of Data" Collection and Organization of Data PPT Download (Lesson 1), due to usage restrictions, it is only for personal study and reference use. For commercial use, please go to the relevant official website for authorization.
(Personal non-commercial use refers to the use of this font to complete the display of personal works, including but not limited to the design of personal papers, resumes, etc.)
Preview
Related Search:
"Representation of Data" Collection and Organization of Data PPT Download (Lesson 1)
2024-10-05
Copyright statement: This material is compiled and released by the user of Daoge Resources. The copyright belongs to the author. For commercial use, please contact the copyright owner. If there is any infringement, please contact the webmaster to remove the resource.
Download Points: 0.00
Free Download
Upgrade VIP
Favorite
Views: 2606 / Downloads: 837


