Western Normal University Edition First Grade Mathematics Volume 1
Beijing Normal University Edition Seventh Grade Mathematics Volume 1
People's Education Press First Grade Mathematics Volume 1
People's Education Press Third Grade Mathematics Volume 1
People's Education Press Second Grade Mathematics Volume 1
Beijing Normal University Edition Seventh Grade Mathematics Volume 2
Hebei Education Edition Third Grade Mathematics Volume 1
Beijing Normal University Edition Fifth Grade Mathematics Volume 1
Qingdao Edition Seventh Grade Mathematics Volume 1
Beijing Normal University Edition Eighth Grade Mathematics Volume 1
Hebei Education Edition Seventh Grade Mathematics Volume 2
People's Education High School Mathematics Edition B Compulsory Course 2
Qingdao Edition Seventh Grade Mathematics Volume 2
People's Education Press First Grade Mathematics Volume 2
Beijing Normal University Edition Fifth Grade Mathematics Volume 2
Jiangsu Education Edition Fourth Grade Mathematics Volume 1
| Category | Format | Size |
|---|---|---|
| People's Education Press Fourth Grade Mathematics Volume 2 | pptx | 6 MB |

"Complex Bar Chart" Average and Bar Chart PPT Download
2024-10-01
Copyright statement: This material is compiled and released by the user of Daoge Resources. The copyright belongs to the author. For commercial use, please contact the copyright owner. If there is any infringement, please contact the webmaster to remove the resource.
Download Points: 0.00
Free Download
Upgrade VIP
Favorite
Views: 3057 / Downloads: 187
Description
"Complex Bar Chart" Average and Bar Chart PPT Download
Part One: Introduction to the topic
1. Students, we learned about bar charts earlier. Think about what parts of a bar chart include? What should we pay attention to when drawing bar charts? What are the characteristics of bar charts?
1. Combine the following statistical tables into one statistical table
2. Can you draw statistical charts based on the data in the statistical table?
New knowledge on teaching
Give it a try: Merge two single-entry statistics tables into one compound-entry statistics table
Compound bar chart PPT, part 2: knowledge sorting
Knowledge point 1: Retest bar chart
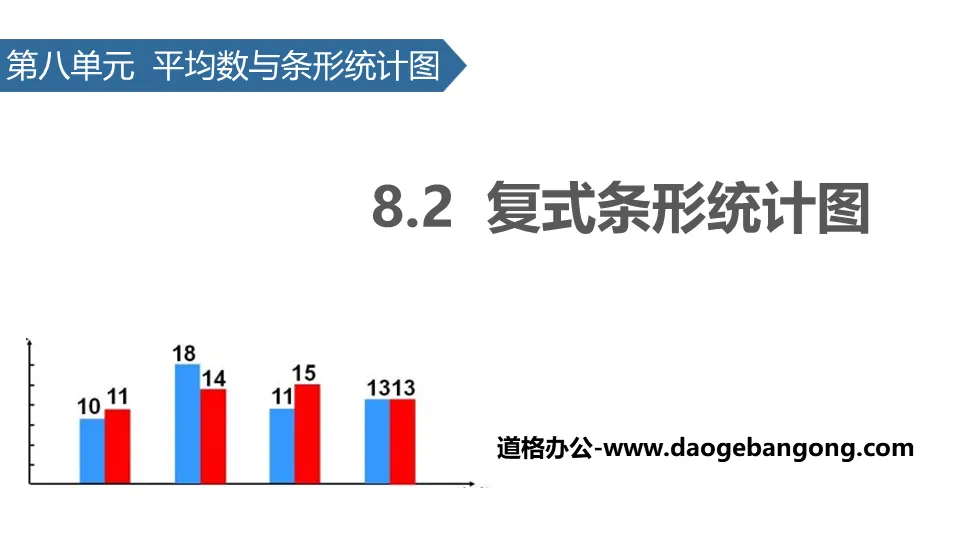
A compound bar chart uses one unit length to represent a quantity, and draws straight bars of different lengths according to the quantity. Different straight bars are used for different things, and then these straight bars are arranged in a certain order. It's easy to see the magnitude of both from a compound bar chart.
[Method Summary] When counting two things at the same time, a compound bar chart can be drawn.
Knowledge point 2: Characteristics of compound bar charts
Characteristics of compound bar charts: The lengths of different types of bars are used to represent different quantities. The number of quantities can be clearly seen through the compound bar chart, making it easy to compare the quantities of two sets of data.
[Example] The picture below is a statistical chart of the output value of the first and second workshops of a furniture factory. It can be seen from the figure that the output value of the furniture factory's ( ) workshop is always higher than that of the ( ) workshop. In ( ) year, the output value of the first workshop and the second workshop has the largest difference. In the five years, the total output value of the first workshop is ( ), which is higher than that of the second workshop. There are few workshops ( ).
[Method Summary] This question mainly tests how to obtain information from a compound bar chart, and then analyze and calculate based on the information.
Compound bar chart PPT, Part 3: Classroom exercises
2. (1) The level with the largest number of people is ( ).
A.Excellent B.Good C.Pass
(2) Class 3, Grade 4 ( ).
A. There are more boys B. There are more girls C. There are equal numbers of boys and girls
3. The weight of a fourth grade student in a primary school is as follows:
(1) One unit length on the horizontal axis represents ( ) people.
(2) There are ( ) students who weigh more than 35 kilograms, and there are ( ) students who weigh less than 25 kilograms (excluding 25 kilograms).
(3) There are ( ) boys and ( ) girls in the fourth grade of this elementary school.
(4) There are ( ) people in the fourth grade of this primary school.
Compound bar chart PPT, part 4 content: homework
1. Fill in the blanks.
(1) Bar chart can be divided into ( ) statistical chart and ( ) statistical chart according to the statistical content.
(2) In addition to the vertical and horizontal axes and the straight bars representing the data, a complete compound bar chart also needs to write ( ), ( ) and ( ).
(3) ① Please write the name of the statistical chart on the "——" above.
②One unit length on the vertical axis in the figure represents ( ) people.
③The straight bars in ( ) in the picture represent boys, and the straight bars in ( ) represent girls.
④The toy that boys like the most is ( ), and the toy that boys like least is ( ).
⑤The toy that girls like the most is ( ), and the toy that girls dislike the most is ( ).
⑥The number of people who like ( ) toy is the least, and the number of people who like ( ) toy and ( ) toy are the same.
⑦There are ( ) people in the fourth grade of Huayuan Primary School.
⑧The information you also found is ( ).
2. Multiple choice questions
(1) One unit length on the vertical axis of a bar chart represents quantity ( )
A.1 B.100 C. Not fixed
(2) The compound bar chart can count the data of ( ) items.
A.1 B.2 C.Countless
(3) The sports that fourth grade students like are as shown in the table on the right.
This statistical table can be made into a ( ) statistical chart.
A.Single bar B.Complex bar C.Straight bar
Keywords: Free download of PPT courseware for mathematics in the second volume of the fourth grade of the People's Education Press, download of compound bar chart PPT, download of average and bar chart PPT, .PPT format;
For more information about the PPT courseware "Complex Bar Chart Average and Bar Chart", please click the Compound Bar Chart PPT Average and Bar Chart PPT tab.
"Complex Bar Chart" Data Representation and Analysis PPT Teaching Courseware:
"Complex Bar Chart" Data Representation and Analysis PPT Teaching Courseware Part One: Learning Objectives 1. Through the pitching game, understand the compound bar chart and understand the characteristics of the compound bar chart. 2. Able to obtain as much information as possible from statistical charts and experience...
"Complex Bar Chart" Data Representation and Analysis PPT Download:
"Complex Bar Statistical Chart" Data Representation and Analysis PPT Download Part One Content: Scenario Introduction In physical education class, the teacher organized students to conduct shooting training, but the students encountered difficulties at the beginning of the practice. Some students shot with one hand. , some students use their hands...
"Complex Bar Chart" Data Representation and Analysis PPT:
"Complex Bar Chart" Data Representation and Analysis PPT Part One: Learning Objectives 1. Understand the compound bar chart and understand the characteristics of the compound bar chart. (Key points) 2. Be able to use the information in the compound bar chart to solve problems, and be able to draw complex...
File Info
Update Time: 2024-10-01
This template belongs to Mathematics courseware People's Education Press Fourth Grade Mathematics Volume 2 industry PPT template
"Complex Bar Chart" Average and Bar Chart PPT Download Simple campus recruitment activity planning plan summary enterprise and institution recruitment publicity lecture PPT template is a general PPT template for business post competition provided by the manuscript PPT, simple campus recruitment activity planning plan summary enterprise and institution recruitment promotion Lecture PPT template, you can edit and modify the text and pictures in the source file by downloading the source file. If you want more exquisite business PPT templates, you can come to grid resource. Doug resource PPT, massive PPT template slide material download, we only make high-quality PPT templates!
Tips: If you open the template and feel that it is not suitable for all your needs, you can search for related content "Complex Bar Chart" Average and Bar Chart PPT Download is enough.
How to use the Windows system template
Directly decompress the file and use it with office or wps
How to use the Mac system template
Directly decompress the file and use it Office or wps can be used
Related reading
For more detailed PPT-related tutorials and font tutorials, you can view: Click to see
How to create a high-quality technological sense PPT? 4 ways to share the bottom of the box
Notice
Do not download in WeChat, Zhihu, QQ, built-in browsers, please use mobile browsers to download! If you are a mobile phone user, please download it on your computer!
1. The manuscript PPT is only for study and reference, please delete it 24 hours after downloading.
2. If the resource involves your legitimate rights and interests, delete it immediately.
3. Contact information: service@daogebangong.com
"Complex Bar Chart" Average and Bar Chart PPT Download, due to usage restrictions, it is only for personal study and reference use. For commercial use, please go to the relevant official website for authorization.
(Personal non-commercial use refers to the use of this font to complete the display of personal works, including but not limited to the design of personal papers, resumes, etc.)
Preview

Related Search:
"Complex Bar Chart" Average and Bar Chart PPT Download
2024-10-01
Copyright statement: This material is compiled and released by the user of Daoge Resources. The copyright belongs to the author. For commercial use, please contact the copyright owner. If there is any infringement, please contact the webmaster to remove the resource.
Download Points: 0.00
Free Download
Upgrade VIP
Favorite
Views: 3057 / Downloads: 187


