Western Normal University Edition First Grade Mathematics Volume 1
Beijing Normal University Edition Seventh Grade Mathematics Volume 1
People's Education Press First Grade Mathematics Volume 1
People's Education Press Third Grade Mathematics Volume 1
People's Education Press Second Grade Mathematics Volume 1
Beijing Normal University Edition Seventh Grade Mathematics Volume 2
Beijing Normal University Edition Fifth Grade Mathematics Volume 1
Hebei Education Edition Third Grade Mathematics Volume 1
Qingdao Edition Seventh Grade Mathematics Volume 1
Beijing Normal University Edition Eighth Grade Mathematics Volume 1
Hebei Education Edition Seventh Grade Mathematics Volume 2
People's Education High School Mathematics Edition B Compulsory Course 2
Qingdao Edition Seventh Grade Mathematics Volume 2
Hebei Education Edition Fourth Grade Mathematics Volume 2
Beijing Normal University Edition Fifth Grade Mathematics Volume 2
Jiangsu Education Edition Fourth Grade Mathematics Volume 1

| Category | Format | Size |
|---|---|---|
| People's Education Press Fourth Grade Mathematics Volume 2 | pptx | 6 MB |

"Average" Average and Bar Chart PPT Teaching Courseware (Lesson 1)
2024-10-01
Copyright statement: This material is compiled and released by the user of Daoge Resources. The copyright belongs to the author. For commercial use, please contact the copyright owner. If there is any infringement, please contact the webmaster to remove the resource.
Download Points: 0.00
Free Download
Upgrade VIP
Favorite
Views: 1227 / Downloads: 257
Description
"Average" Average and Bar Chart PPT Teaching Courseware (Lesson 1)
Part One: Learning Objectives
1. Understand the meaning of average and initially learn the simple method of calculating average.
2. Students experience the process of using average knowledge to solve simple life problems, accumulate methods of analyzing and processing data, and develop statistical concepts. Initial understanding of mathematical ideas such as "shifting more to compensate for less" and "correspondence".
3. Feel the application value of averages in life and experience the fun of learning mathematics to solve practical problems.
[Key Points] Understand the meaning of average and master the method of finding average.
[Difficulty] Understand the meaning of the average by using the method of "shifting more to make up for less".
Average PPT, part 2: exploration of new knowledge
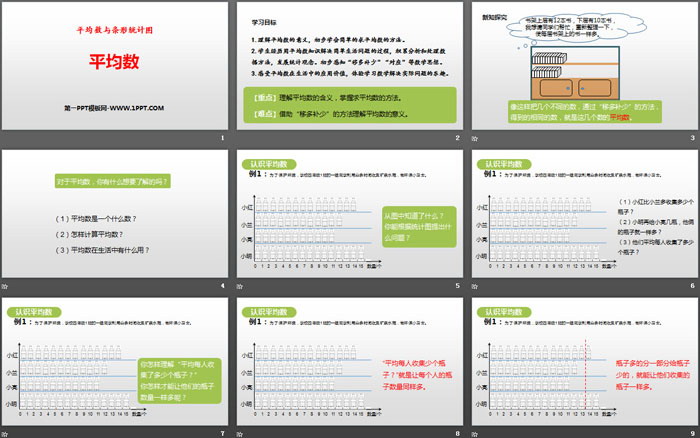
There are 12 books on the upper shelf and 10 books on the lower shelf. I would like to ask my classmates to help me rearrange them so that there are the same number of books on each shelf.
Taking several different numbers like this and using the method of "shifting more and filling in less", the same number obtained is the average of these numbers.
What do you want to know about averages?
(1) What is the average number?
(2) How to calculate the average?
(3) What is the use of averages in life?
Know the average
Example 1: In order to protect the environment, a group of students from Class 1, Grade 4 of the school, used their spare time to collect mineral water bottles and serve as environmental protection guards.
What do you know from the picture?
What questions can you ask based on the statistical graph?
(1) How many more bottles does Xiao Hong collect than Xiao Lan?
(2) If Xiao Ming gives Xiao Liang a few more bottles, will they both have the same number of bottles?
(3) How many bottles did each of them collect on average?
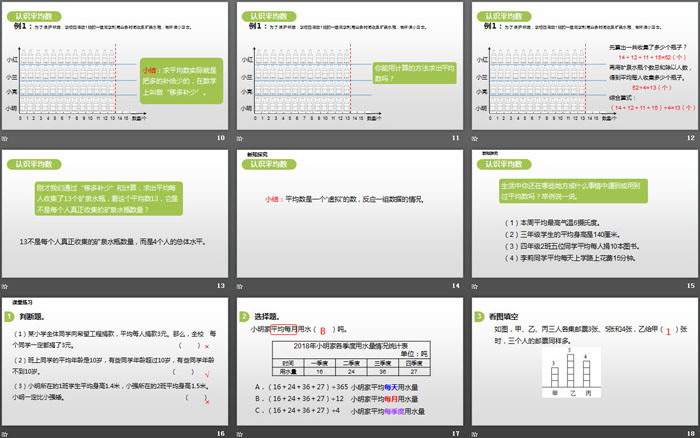
What do you understand by "how many bottles does each person collect on average?"
How do you get them to have the same number of bottles?
Have you ever encountered or used averages in other places or things in your life? Give an example.
(1) The average maximum temperature this week is 6 degrees Celsius.
(2) The average height of third grade students is 140 centimeters.
(3) Five students from Class 2 of Grade 4 donated an average of 10 books each.
(4) Li Li spends an average of 15 minutes on her way to school every day.
Average PPT, Part 3: Classroom Exercises
1. True or false question.
(1) All students in a certain primary school donated to Project Hope, with an average donation of 3 yuan per person. Then, every student in the school must have donated 3 yuan. ( )
(2) The average age of the students in the class is 10 years old, some students are over 10 years old, and some students are under 10 years old. ( )
(3) The average height of Xiao Ming’s Class 1 students is 1.4 meters, and the average height of Xiao Qiang’s Class 2 students is 1.5 meters. Xiao Ming must be shorter than Xiao Qiang. ( )
2. Multiple choice questions.
On average, Xiao Ming’s household uses ( ) tons of water per month.
A. (16+24+36+27)÷365
B. (16+24+36+27)÷12
C. (16+24+36+27)÷4
Average PPT, Part 4: Class Summary
1. The average can reflect the situation of a set of data.
2. You can use the method of "moving more to make up for less" to find the average.
3. You can find the average by dividing the total number by the number of copies.
Average PPT, Part 5: Classwork
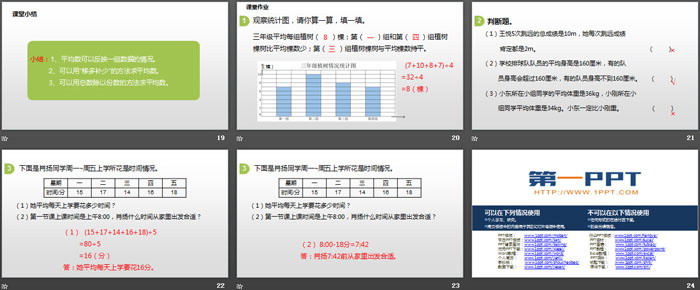
1. Observe the statistical chart, please do the calculations and fill them in.
The average number of trees planted by each group in the third grade was ( ) trees; the number of trees planted by groups ( ) and ( ) was less than the average; the number of trees planted by group ( ) was the same as the average.
(7+10+8+7)÷4
=32÷4
=8(tree)
2. True or false questions.
(1) Wang Yue’s total score in the five long jumps is 10m. Her long jump score must be 2m each time. ( )
(2) The average height of the school volleyball team members is 160 centimeters, some players are more than 160 centimeters tall, and some players are less than 160 centimeters tall. ( )
(3) The average weight of Xiaodong’s group is 36kg, and the average weight of Xiaogang’s group is 34kg. Xiaodong must be heavier than Xiaogang. ( )
Keywords: Free download of PPT courseware for mathematics in the second volume of the fourth grade of the People's Education Press, download of average PPT, download of average and bar chart PPT, .PPT format;
For more information about the "Average Average and Bar Chart" PPT courseware, please click the Average PPT Average and Bar Chart PPT tab.
"Average" data analysis PPT teaching courseware:
"Average" data analysis PPT teaching courseware, 15 pages in total. Part One: Knowledge Points Basic Knowledge Point 1 Arithmetic mean 1. The average of a column of numbers 4,5,6,4,4,7, x is 5, then the value of x is (B) A.4 B.5 C.6 D.7 2. (Original) A set of known...
"Average" data analysis PPT download (Lesson 2):
"Average" data analysis PPT download (Lesson 2), 15 pages in total. Part 1: Calculation of type weighted average of numbers 1. 1,500 fish of a certain species were stocked in the fish pond of Lao Wang's family. After a few years, they were going to be salvaged and sold. In order to estimate the number of fish in the fish pond...
"Average" data analysis PPT download (Lesson 1):
"Average" data analysis PPT download (Lesson 1), 24 pages in total. The first part of the content: Learning objectives Arithmetic mean Weighted average (weight expressed in proportion or percentage) ... ... ... Average PPT, the second part of the content: Understanding new knowledge Knowledge points...
File Info
Update Time: 2024-10-01
This template belongs to Mathematics courseware People's Education Press Fourth Grade Mathematics Volume 2 industry PPT template
"Average" Average and Bar Chart PPT Teaching Courseware (Lesson 1) Simple campus recruitment activity planning plan summary enterprise and institution recruitment publicity lecture PPT template is a general PPT template for business post competition provided by the manuscript PPT, simple campus recruitment activity planning plan summary enterprise and institution recruitment promotion Lecture PPT template, you can edit and modify the text and pictures in the source file by downloading the source file. If you want more exquisite business PPT templates, you can come to grid resource. Doug resource PPT, massive PPT template slide material download, we only make high-quality PPT templates!
Tips: If you open the template and feel that it is not suitable for all your needs, you can search for related content "Average" Average and Bar Chart PPT Teaching Courseware (Lesson 1) is enough.
How to use the Windows system template
Directly decompress the file and use it with office or wps
How to use the Mac system template
Directly decompress the file and use it Office or wps can be used
Related reading
For more detailed PPT-related tutorials and font tutorials, you can view: Click to see
How to create a high-quality technological sense PPT? 4 ways to share the bottom of the box
Notice
Do not download in WeChat, Zhihu, QQ, built-in browsers, please use mobile browsers to download! If you are a mobile phone user, please download it on your computer!
1. The manuscript PPT is only for study and reference, please delete it 24 hours after downloading.
2. If the resource involves your legitimate rights and interests, delete it immediately.
3. Contact information: service@daogebangong.com
"Average" Average and Bar Chart PPT Teaching Courseware (Lesson 1), due to usage restrictions, it is only for personal study and reference use. For commercial use, please go to the relevant official website for authorization.
(Personal non-commercial use refers to the use of this font to complete the display of personal works, including but not limited to the design of personal papers, resumes, etc.)
Preview
Related Search:
"Average" Average and Bar Chart PPT Teaching Courseware (Lesson 1)
2024-10-01
Copyright statement: This material is compiled and released by the user of Daoge Resources. The copyright belongs to the author. For commercial use, please contact the copyright owner. If there is any infringement, please contact the webmaster to remove the resource.
Download Points: 0.00
Free Download
Upgrade VIP
Favorite
Views: 1227 / Downloads: 257


