Western Normal University Edition First Grade Mathematics Volume 1
Beijing Normal University Edition Seventh Grade Mathematics Volume 1
People's Education Press First Grade Mathematics Volume 1
People's Education Press Third Grade Mathematics Volume 1
People's Education Press Second Grade Mathematics Volume 1
Beijing Normal University Edition Seventh Grade Mathematics Volume 2
Beijing Normal University Edition Fifth Grade Mathematics Volume 1
Hebei Education Edition Third Grade Mathematics Volume 1
Qingdao Edition Seventh Grade Mathematics Volume 1
Beijing Normal University Edition Eighth Grade Mathematics Volume 1
Hebei Education Edition Seventh Grade Mathematics Volume 2
People's Education High School Mathematics Edition B Compulsory Course 2
Qingdao Edition Seventh Grade Mathematics Volume 2
Beijing Normal University Edition Fifth Grade Mathematics Volume 2
Hebei Education Edition Fourth Grade Mathematics Volume 2
Jiangsu Education Edition Fourth Grade Mathematics Volume 1

| Category | Format | Size |
|---|---|---|
| People's Education Press Fourth Grade Mathematics Volume 2 | pptx | 6 MB |

"Average" Average and bar chart PPT download
2024-10-04
Copyright statement: This material is compiled and released by the user of Daoge Resources. The copyright belongs to the author. For commercial use, please contact the copyright owner. If there is any infringement, please contact the webmaster to remove the resource.
Download Points: 0.00
Free Download
Upgrade VIP
Favorite
Views: 4436 / Downloads: 100
Description
"Average" Average and bar chart PPT download
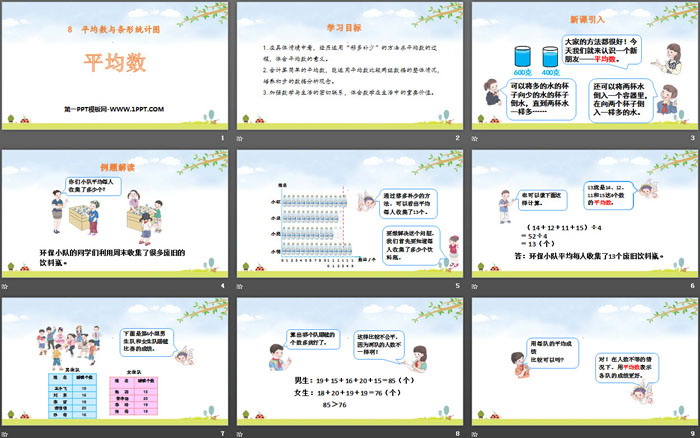
Part One: Learning Objectives
1. Look at the specific situation, experience the process of finding the average using the method of "moving more to make up for the less", and understand the meaning of the average.
2. Be able to calculate simple averages, use averages to compare the overall situation of two sets of data, and develop preliminary data analysis concepts.
3. Strengthen the close connection between mathematics and life, and realize the important value of mathematics in life.
Average PPT, part 2: introduction of new lessons
Everyone’s methods are great! Today we are going to meet a new friend - the average.
You can pour water from the cup with more water into the cup with less water until the two cups have the same amount of water...
You can also pour two cups of water into a container, and then pour the same amount of water into both cups.
Average PPT, Part 3: Interpretation of Examples
How many did your team collect per person on average?
Students from the environmental protection team collected a lot of used beverage bottles over the weekend.
By moving more to make up for the less, it can be seen that each person collected an average of 13.
To solve this problem, we first need to know how many beverage bottles each person collected.
It can also be calculated as follows.
13 is the average of the four numbers 14, 12, 11 and 15.
(14+12+11+15)÷4
=52÷4
=13(pieces)
Answer: The environmental protection team collected an average of 13 used beverage bottles per person.
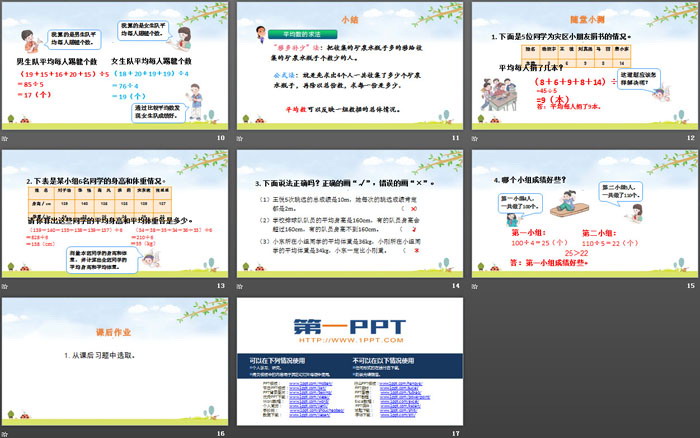
Average PPT, Part 4: Summary
How to find the average
"Move more to make up for less" method: Move the person who collected more mineral water bottles to the person who collected less mineral water bottles.
Formula method: First find out how many mineral water bottles 4 people have collected in total, and then divide by the total number of copies to find out how many bottles each one is.
The average can reflect the overall situation of a set of data.
Average PPT, Part 5: Quiz in class
1. Below is the situation of five students donating books to children in disaster areas.
How many books did each person donate on average?
(8+6+9+8+14)÷5
=45÷5
=9(this)
Answer: On average, each person donated 9 copies.
2. The following table shows the height and weight of 6 students in a certain group.
Please calculate the average height and average weight of these students.
(139+140+135+138+139+137)÷6
=828÷6
=138(cm)
Measure the height and weight of the students in this class and calculate the average height and weight of the entire class.
3. Is the following statement correct? Mark “√” for correct answers and “×” for wrong answers.
(1) Wang Yue’s total score in the five long jumps is 10m. Her long jump score must be 2m each time. ( )
(2) The average height of the school volleyball team members is 160cm, some players are over 160cm tall, and some are less than 160cm tall. ( )
(3) The average weight of the classmates in Xiaodong's group is 36kg, and the average weight of the classmates in Xiaogang's group is 34kg. Xiaodong must be heavier than Xiaogang. ( )
Average PPT, Part 6: Homework
1. Choose from the after-school exercises.
Keywords: Free download of PPT courseware for mathematics in the second volume of the fourth grade of the People's Education Press, download of average PPT, download of average and bar chart PPT, .PPT format;
For more information about the "Average Average and Bar Chart" PPT courseware, please click the Average PPT Average and Bar Chart PPT tab.
"Average" data analysis PPT teaching courseware:
"Average" data analysis PPT teaching courseware, 15 pages in total. Part One: Knowledge Points Basic Knowledge Point 1 Arithmetic mean 1. The average of a column of numbers 4,5,6,4,4,7, x is 5, then the value of x is (B) A.4 B.5 C.6 D.7 2. (Original) A set of known...
"Average" data analysis PPT download (Lesson 2):
"Average" data analysis PPT download (Lesson 2), 15 pages in total. Part 1: Calculation of type weighted average of numbers 1. 1,500 fish of a certain species were stocked in the fish pond of Lao Wang's family. After a few years, they were going to be salvaged and sold. In order to estimate the number of fish in the fish pond...
"Average" data analysis PPT download (Lesson 1):
"Average" data analysis PPT download (Lesson 1), 24 pages in total. The first part of the content: Learning objectives Arithmetic mean Weighted average (weight expressed in proportion or percentage) ... ... ... Average PPT, the second part of the content: Understanding new knowledge Knowledge points...
File Info
Update Time: 2024-10-04
This template belongs to Mathematics courseware People's Education Press Fourth Grade Mathematics Volume 2 industry PPT template
"Average" Average and bar chart PPT download Simple campus recruitment activity planning plan summary enterprise and institution recruitment publicity lecture PPT template is a general PPT template for business post competition provided by the manuscript PPT, simple campus recruitment activity planning plan summary enterprise and institution recruitment promotion Lecture PPT template, you can edit and modify the text and pictures in the source file by downloading the source file. If you want more exquisite business PPT templates, you can come to grid resource. Doug resource PPT, massive PPT template slide material download, we only make high-quality PPT templates!
Tips: If you open the template and feel that it is not suitable for all your needs, you can search for related content "Average" Average and bar chart PPT download is enough.
How to use the Windows system template
Directly decompress the file and use it with office or wps
How to use the Mac system template
Directly decompress the file and use it Office or wps can be used
Related reading
For more detailed PPT-related tutorials and font tutorials, you can view: Click to see
How to create a high-quality technological sense PPT? 4 ways to share the bottom of the box
Notice
Do not download in WeChat, Zhihu, QQ, built-in browsers, please use mobile browsers to download! If you are a mobile phone user, please download it on your computer!
1. The manuscript PPT is only for study and reference, please delete it 24 hours after downloading.
2. If the resource involves your legitimate rights and interests, delete it immediately.
3. Contact information: service@daogebangong.com
"Average" Average and bar chart PPT download, due to usage restrictions, it is only for personal study and reference use. For commercial use, please go to the relevant official website for authorization.
(Personal non-commercial use refers to the use of this font to complete the display of personal works, including but not limited to the design of personal papers, resumes, etc.)
Preview
Related Search:
"Average" Average and bar chart PPT download
2024-10-04
Copyright statement: This material is compiled and released by the user of Daoge Resources. The copyright belongs to the author. For commercial use, please contact the copyright owner. If there is any infringement, please contact the webmaster to remove the resource.
Download Points: 0.00
Free Download
Upgrade VIP
Favorite
Views: 4436 / Downloads: 100


