Western Normal University Edition First Grade Mathematics Volume 1
Beijing Normal University Edition Seventh Grade Mathematics Volume 1
People's Education Press First Grade Mathematics Volume 1
People's Education Press Third Grade Mathematics Volume 1
People's Education Press Second Grade Mathematics Volume 1
Hebei Education Edition Third Grade Mathematics Volume 1
Beijing Normal University Edition Seventh Grade Mathematics Volume 2
Beijing Normal University Edition Fifth Grade Mathematics Volume 1
Qingdao Edition Seventh Grade Mathematics Volume 1
Hebei Education Edition Seventh Grade Mathematics Volume 2
Beijing Normal University Edition Eighth Grade Mathematics Volume 1
People's Education High School Mathematics Edition B Compulsory Course 2
Jiangsu Education Edition Fourth Grade Mathematics Volume 1
People's Education Press First Grade Mathematics Volume 2
Qingdao Edition Seventh Grade Mathematics Volume 2
Beijing Normal University Edition Fifth Grade Mathematics Volume 2

| Category | Format | Size |
|---|---|---|
| Jiangsu Education Edition Sixth Grade Mathematics Volume 2 | pptx | 6 MB |

"Statistics and Possibility" general review PPT courseware
2024-09-24
Copyright statement: This material is compiled and released by the user of Daoge Resources. The copyright belongs to the author. For commercial use, please contact the copyright owner. If there is any infringement, please contact the webmaster to remove the resource.
Download Points: 0.00
Free Download
Upgrade VIP
Favorite
Views: 1614 / Downloads: 762
Description
"Statistics and Possibility" general review PPT courseware
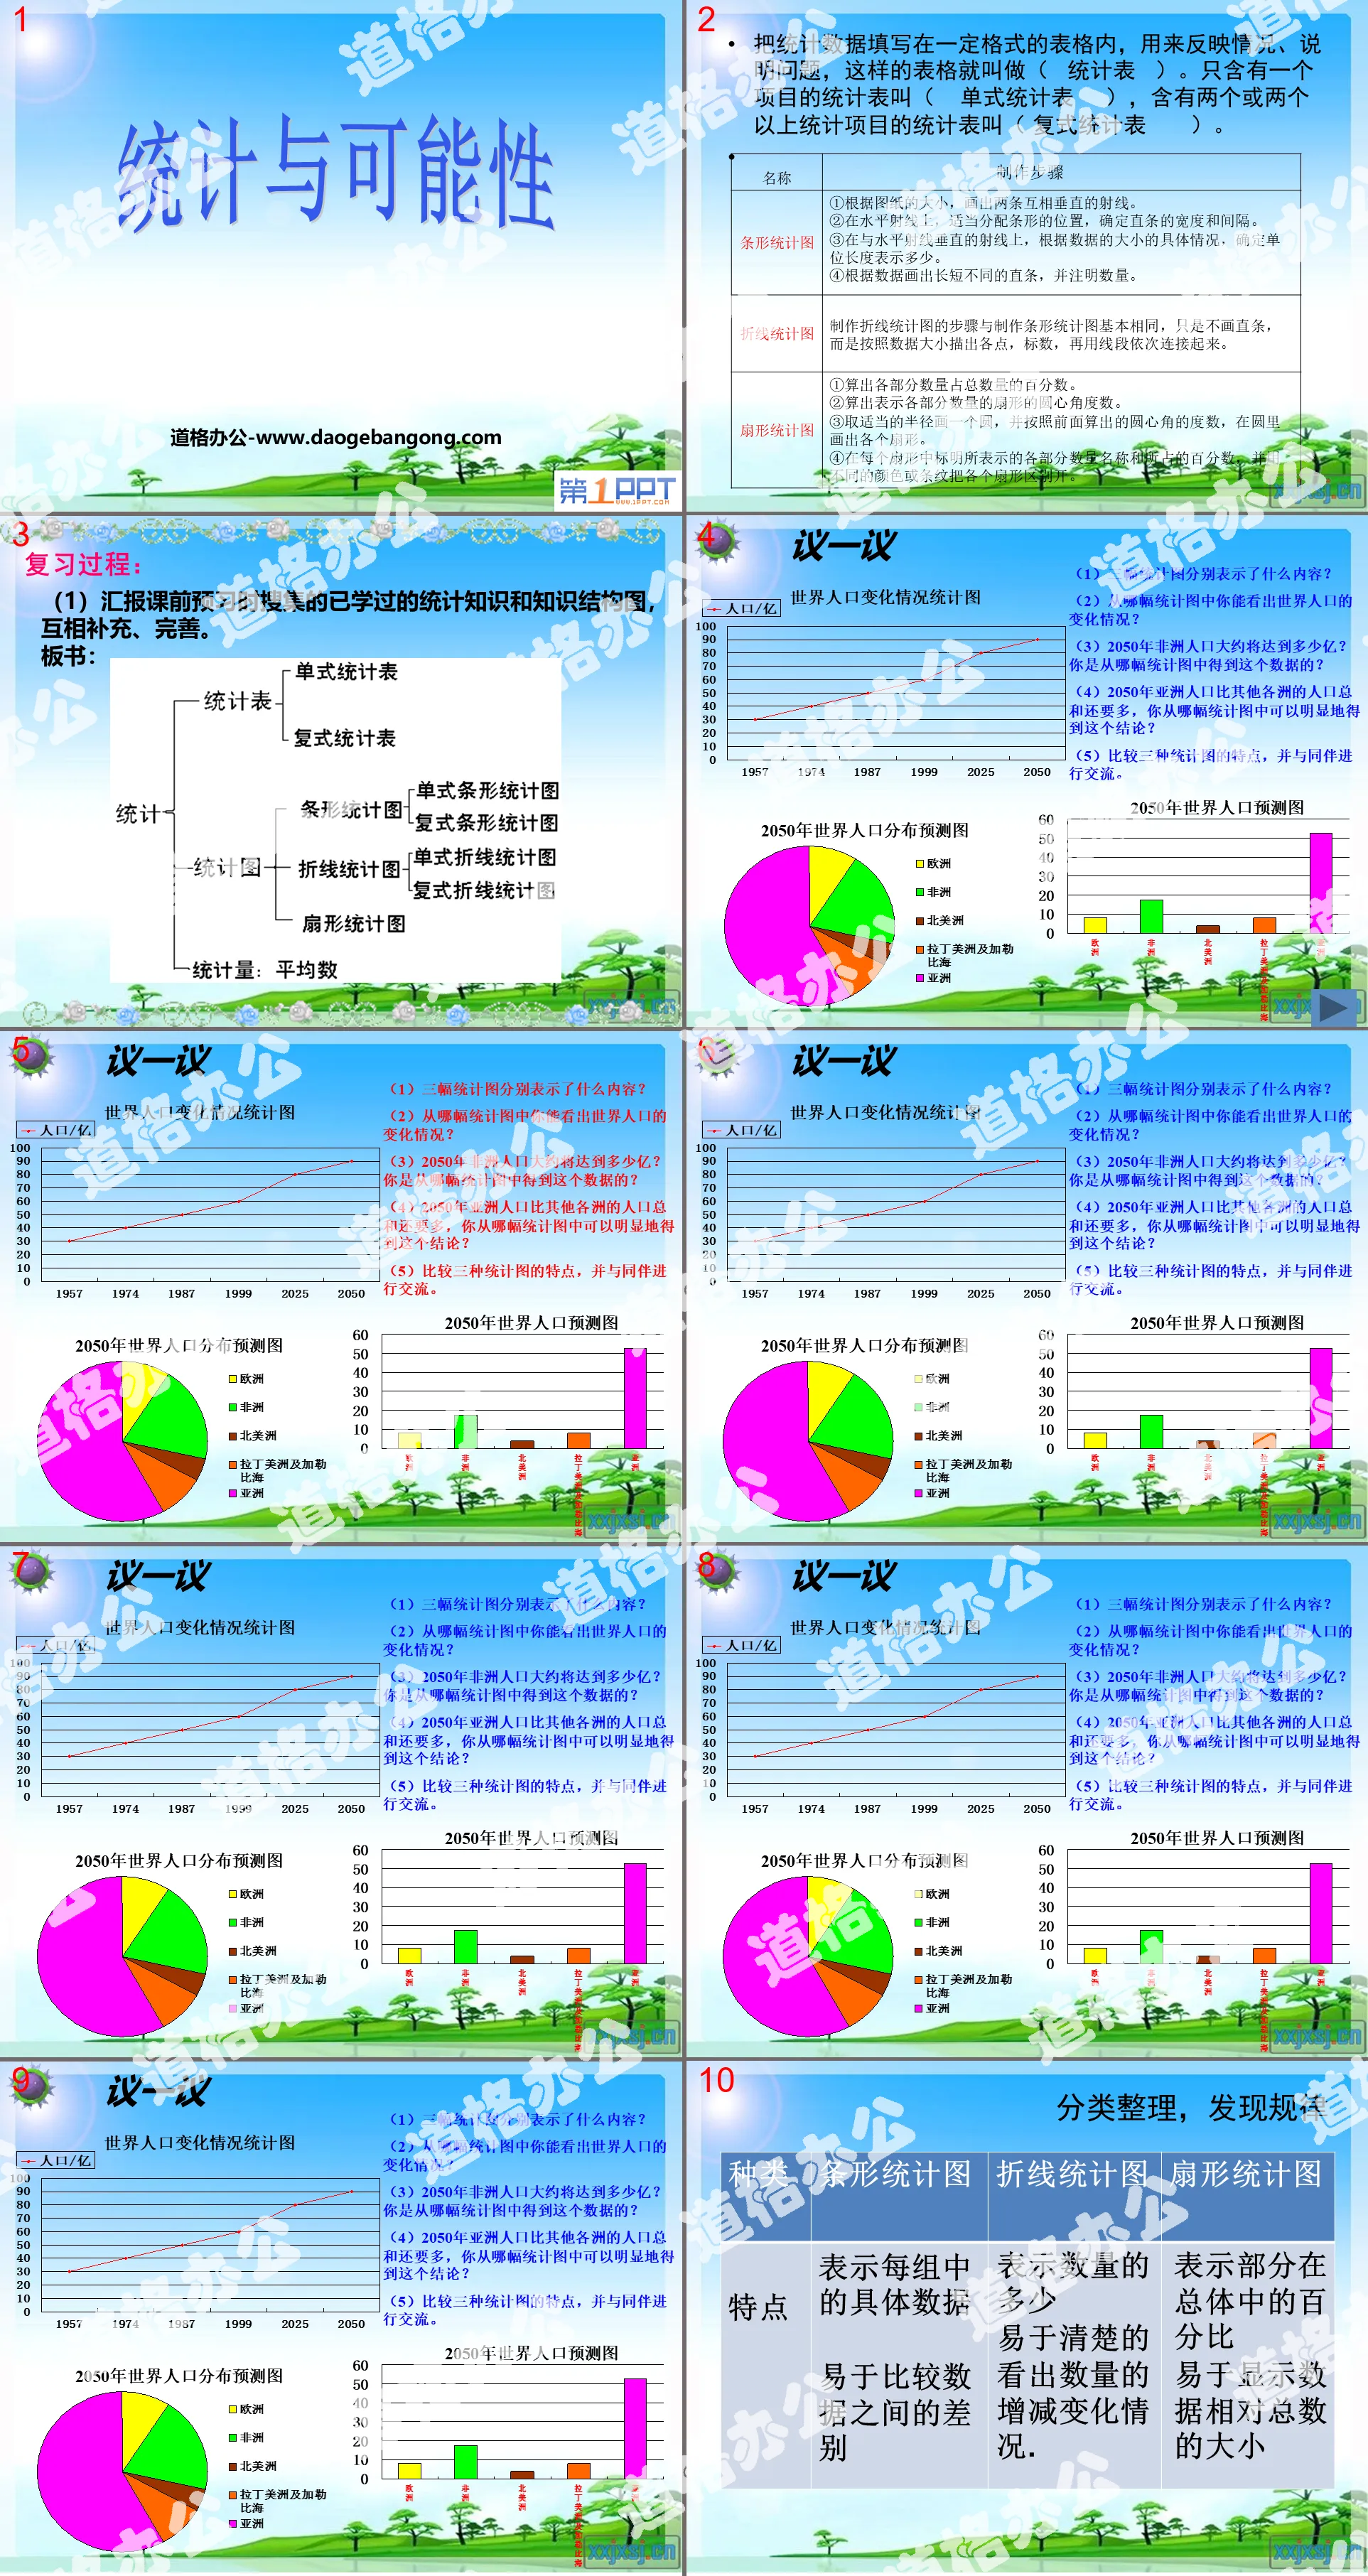
Statistical data is filled in a table of a certain format to reflect the situation and explain the problem. Such a table is called (statistical table). A statistical table containing only one item is called a (single-entry statistical table), and a statistical table containing two or more statistical items is called a (multiple-entry statistical table).
bar chart
①According to the size of the drawing, draw two mutually perpendicular rays.
② On the horizontal ray, appropriately allocate the positions of the bars and determine the width and spacing of the straight bars.
③ On the ray perpendicular to the horizontal ray, determine how much the unit length represents based on the specific conditions of the size of the data.
④Draw straight bars of different lengths based on the data and indicate the quantity.
Line chart
The steps for making a line chart are basically the same as making a bar chart, except that instead of drawing straight bars, each point is traced according to the size of the data, numbered, and then connected in sequence with line segments.
fan chart
① Calculate the percentage of the quantity of each part to the total quantity.
② Calculate the number of central angles of the sector representing the number of each part.
③Draw a circle with an appropriate radius, and draw each sector in the circle according to the central angle calculated previously.
④Indicate the quantity name and percentage of each part represented in each sector, and use different colors or stripes to distinguish each sector.
Analysis: This question is a test of mastering the characteristics of statistical charts. Answer questions based on the characteristics of each statistical chart and the relevant data reflected. It is not only necessary to discover some superficial data, but also to discover deeper information from the data.
1. Based on the above statistical table, what information did you get?
(1) From the statistical table, we can see the number of men and women in Class 61 and the number of students in the whole class.
(2) From the fan chart, we can know the percentage of the number of boys and girls in Class 61 to the whole class.
(3) The bar chart shows the favorite sports of boys and girls in Class 61. Among them, more boys like football than girls, more girls like skipping than boys, and as many boys and girls like table tennis...
(4) The broken line statistical chart shows the changes in the number of students in Class 61 who are satisfied with their overall performance in each grade. Among them, in Grade 6, the number of students who are most satisfied with their overall performance is the largest.
(5) From the statistical table, we can see that there are 4 more boys than girls. From the bar chart, we can see that this is a horizontal bar chart. There are 9 more boys than girls who like football. The number of girls who like skipping is 3 times that of boys. …
2. In addition to collecting data through questionnaires, what other means can be used to collect data? Determine the method of investigation: field surveys, measurements, questionnaires, or collecting information from various media
3. What are the main steps in doing a statistical work?
Keywords: Jiangsu Educational Education Edition Primary School Mathematics Volume 2 General Review Courseware PPT, Statistics and Possibility Courseware PPT, Jiangsu Educational Education Edition Sixth Grade Mathematics Volume 2 PPT Courseware Download, Sixth Grade Mathematics Slide Courseware Download, Jiangsu Educational Education Edition Primary School Mathematics Volume 2 Summary Review PPT courseware download, Statistics and Possibility PPT courseware download, .PPT format
For more information about the PPT courseware "Statistics and Possibility ppt Jiangsu Education Edition Primary School Mathematics Volume 2 General Review", please click the "Statistics and Possibility ppt Jiangsu Education Edition Primary School Mathematics Volume 2 General Review ppt" tag.
"Fairness of Game Rules" Statistics and Possibilities PPT Courseware 2:
"Fairness of Game Rules" PPT Courseware 2 Ball Touching Game Game Rules: Touch a ball at random each time and put it back after touching it, a total of 20 times. If the red ball is touched more often, the girl wins; if the yellow ball is touched more often, the boy wins. Activity requirements: During the process of touching the ball...
"Fairness of Game Rules" Statistics and Possibilities PPT courseware:
"Fairness of Game Rules" PPT courseware teaching objectives In this lesson we are mainly going to learn about the fairness of games. Students must do the following: 1. Understand some common game rules in life and be able to judge whether this rule is fair. . 2. Be able to use yourself..
"Bar Chart" Statistics and Possibility PPT Courseware 2:
"Bar Chart" PPT Courseware 2 Teaching Objectives: Students must know that statistical charts are used to express the relationship between quantities. They are more vivid and concrete, and are convenient for analyzing research problems. Students must learn to independently organize data to make simple summary graph. Exchange picture reading information..
File Info
Update Time: 2024-09-24
This template belongs to Mathematics courseware Jiangsu Education Edition Sixth Grade Mathematics Volume 2 industry PPT template
"Statistics and Possibility" general review PPT courseware Simple campus recruitment activity planning plan summary enterprise and institution recruitment publicity lecture PPT template is a general PPT template for business post competition provided by the manuscript PPT, simple campus recruitment activity planning plan summary enterprise and institution recruitment promotion Lecture PPT template, you can edit and modify the text and pictures in the source file by downloading the source file. If you want more exquisite business PPT templates, you can come to grid resource. Doug resource PPT, massive PPT template slide material download, we only make high-quality PPT templates!
Tips: If you open the template and feel that it is not suitable for all your needs, you can search for related content "Statistics and Possibility" general review PPT courseware is enough.
How to use the Windows system template
Directly decompress the file and use it with office or wps
How to use the Mac system template
Directly decompress the file and use it Office or wps can be used
Related reading
For more detailed PPT-related tutorials and font tutorials, you can view: Click to see
How to create a high-quality technological sense PPT? 4 ways to share the bottom of the box
Notice
Do not download in WeChat, Zhihu, QQ, built-in browsers, please use mobile browsers to download! If you are a mobile phone user, please download it on your computer!
1. The manuscript PPT is only for study and reference, please delete it 24 hours after downloading.
2. If the resource involves your legitimate rights and interests, delete it immediately.
3. Contact information: service@daogebangong.com
"Statistics and Possibility" general review PPT courseware, due to usage restrictions, it is only for personal study and reference use. For commercial use, please go to the relevant official website for authorization.
(Personal non-commercial use refers to the use of this font to complete the display of personal works, including but not limited to the design of personal papers, resumes, etc.)
Preview
Related Search:
"Statistics and Possibility" general review PPT courseware
2024-09-24
Copyright statement: This material is compiled and released by the user of Daoge Resources. The copyright belongs to the author. For commercial use, please contact the copyright owner. If there is any infringement, please contact the webmaster to remove the resource.
Download Points: 0.00
Free Download
Upgrade VIP
Favorite
Views: 1614 / Downloads: 762


