Western Normal University Edition First Grade Mathematics Volume 1
Beijing Normal University Edition Seventh Grade Mathematics Volume 1
People's Education Press First Grade Mathematics Volume 1
People's Education Press Second Grade Mathematics Volume 1
Beijing Normal University Edition Seventh Grade Mathematics Volume 2
People's Education Press Third Grade Mathematics Volume 1
Beijing Normal University Edition Eighth Grade Mathematics Volume 1
Qingdao Edition Seventh Grade Mathematics Volume 1
Beijing Normal University Edition Fifth Grade Mathematics Volume 1
Hebei Education Edition Third Grade Mathematics Volume 1
Hebei Education Edition Seventh Grade Mathematics Volume 2
People's Education Press First Grade Mathematics Volume 2
People's Education High School Mathematics Edition B Compulsory Course 2
Qingdao Edition Seventh Grade Mathematics Volume 2
Beijing Normal University Edition Fifth Grade Mathematics Volume 2
Hebei Education Edition Fourth Grade Mathematics Volume 2

| Category | Format | Size |
|---|---|---|
| People's Education Press Fifth Grade Mathematics Volume 2 | pptx | 6 MB |

"Compound Broken Line Statistical Chart" Broken Line Statistical Chart PPT Download
2024-11-21
Copyright statement: This material is compiled and released by the user of Daoge Resources. The copyright belongs to the author. For commercial use, please contact the copyright owner. If there is any infringement, please contact the webmaster to remove the resource.
Download Points: 0.00
Free Download
Upgrade VIP
Favorite
Views: 4161 / Downloads: 983
Description
"Compound Broken Line Statistical Chart" Broken Line Statistical Chart PPT Download
Part One: Introduction to the topic
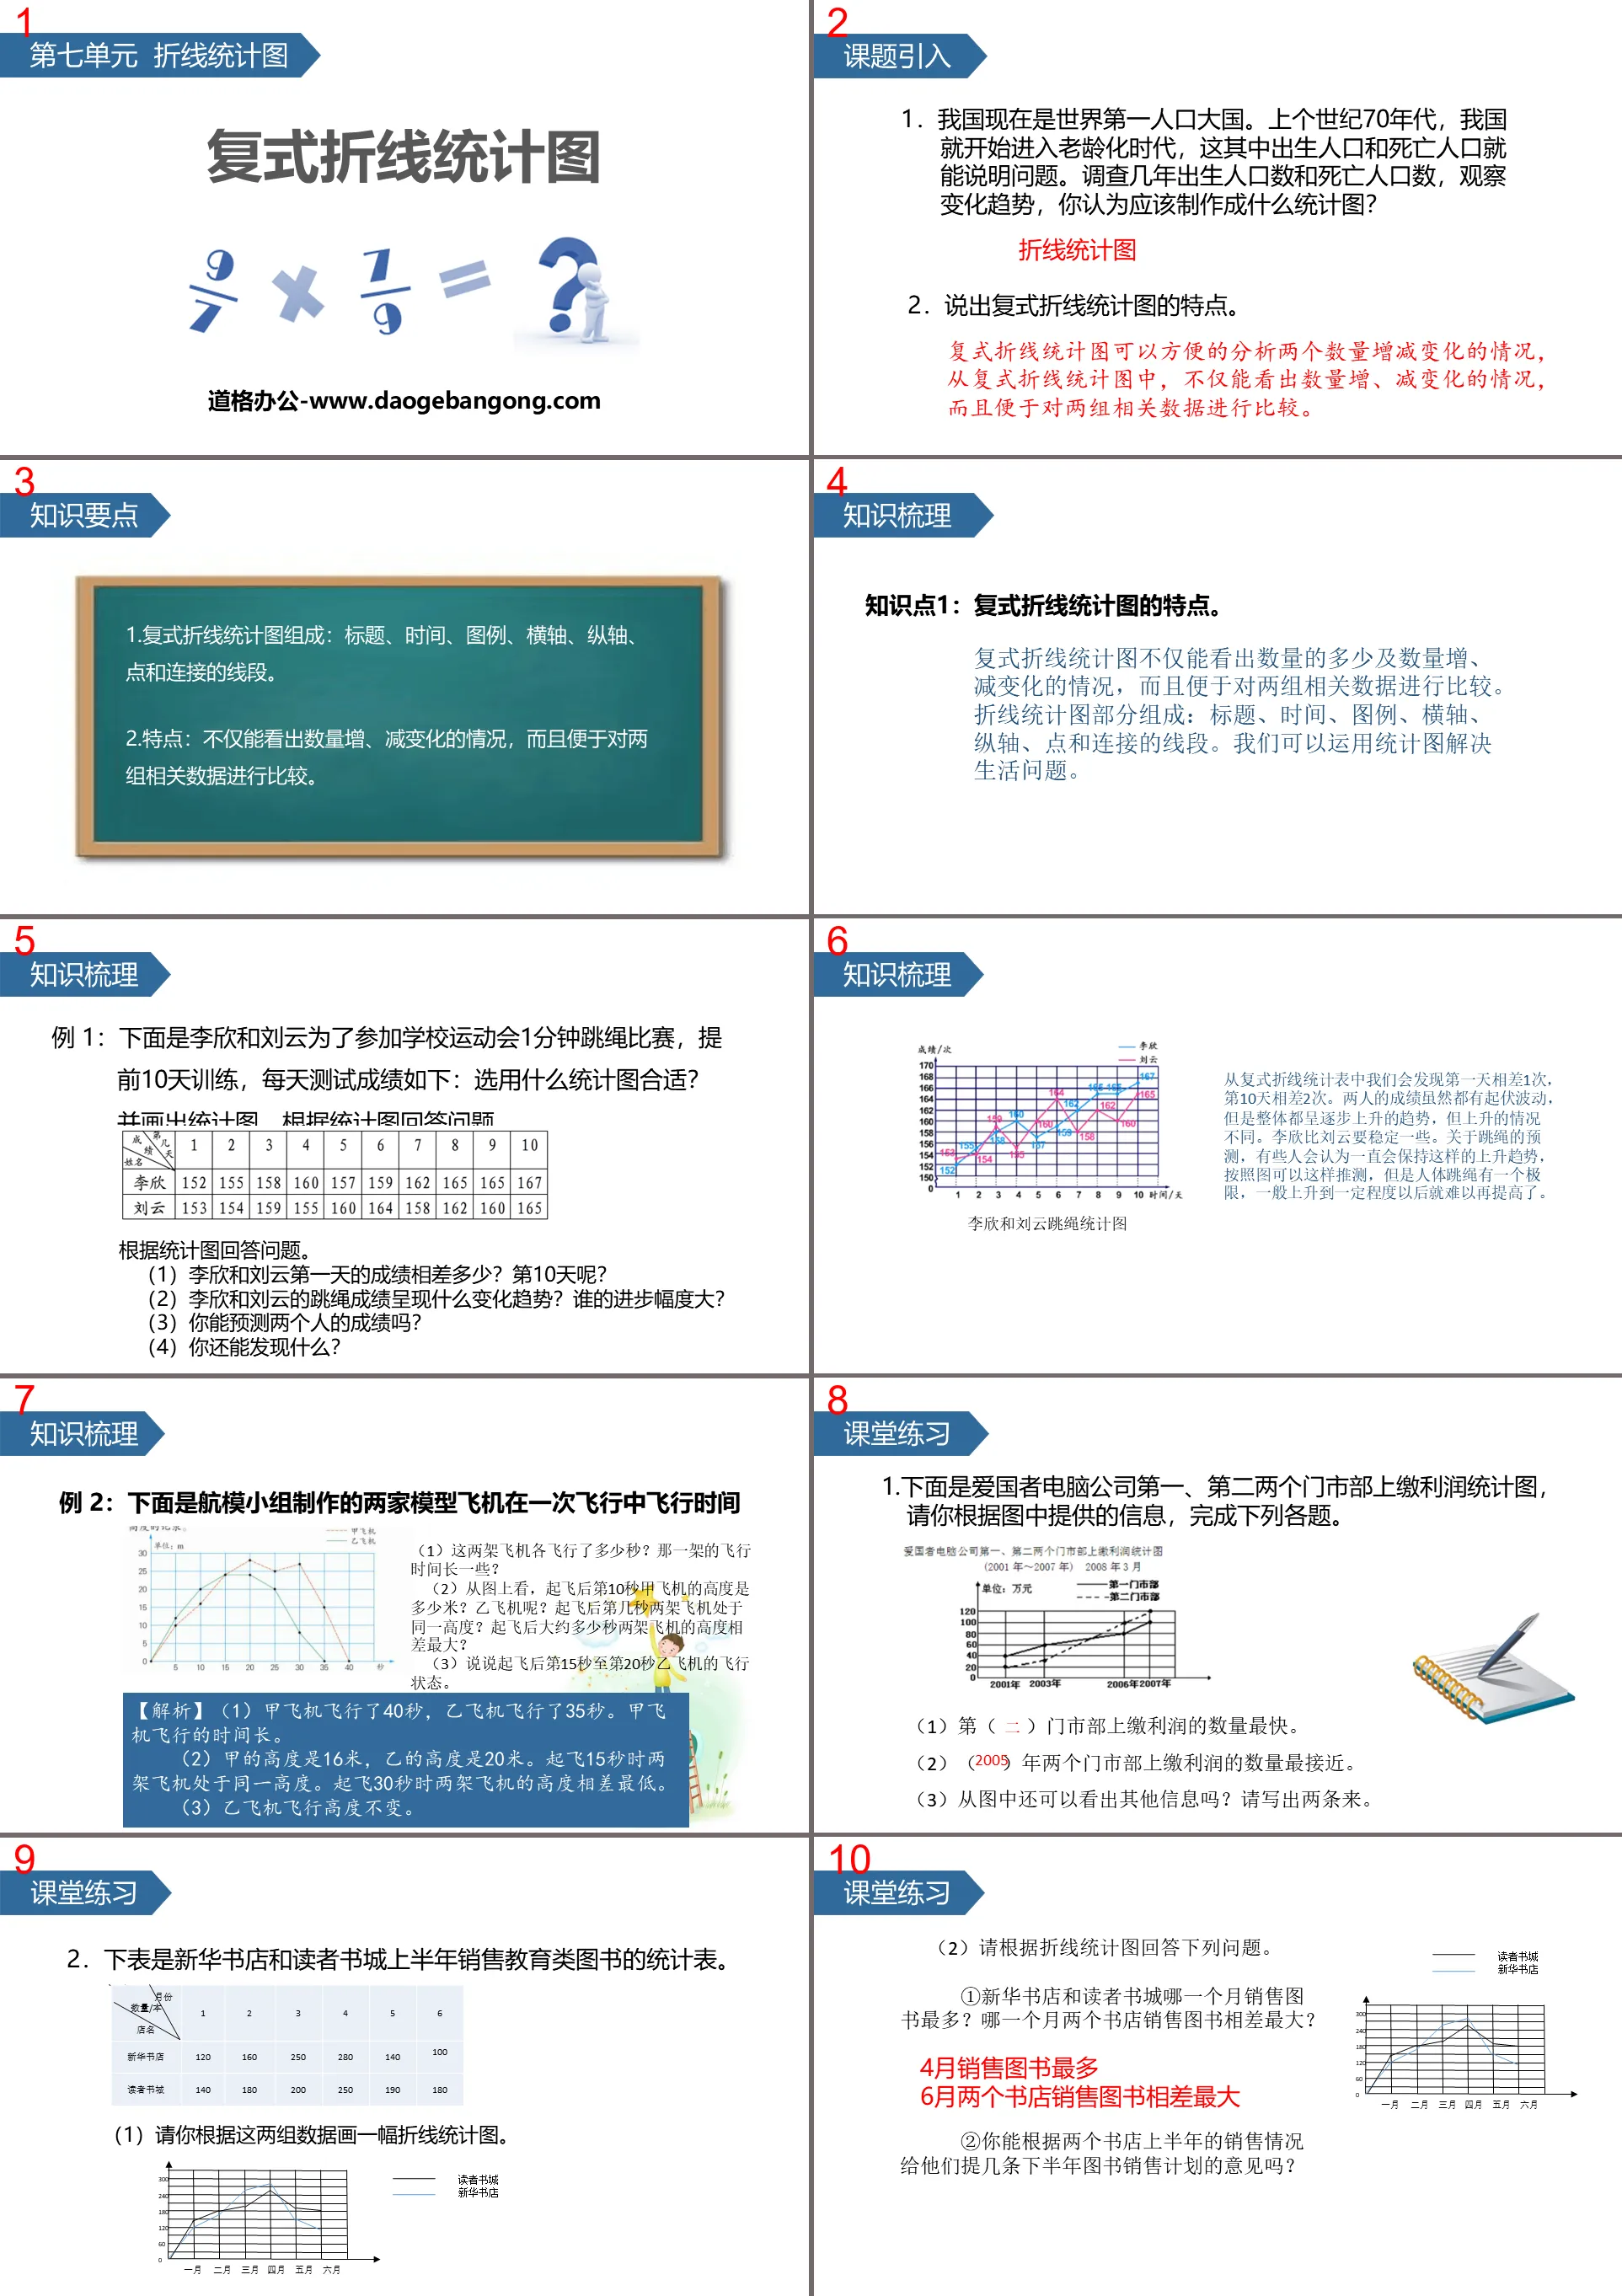
1. Our country is now the most populous country in the world. In the 1970s, our country began to enter the aging era, and the number of births and deaths can illustrate the problem. Survey the number of births and deaths over several years and observe the changing trends. What statistical chart do you think should be produced?
Line chart
2. Discuss the characteristics of compound line charts.
The compound line statistical chart can conveniently analyze the increase and decrease of two quantities. From the compound line chart, not only can the increase and decrease of the quantity be seen, but it is also convenient to compare the two sets of related data.
Compound line statistical chart PPT, the second part of the content: knowledge points
1. The compound line statistical chart consists of: title, time, legend, horizontal axis, vertical axis, points and connecting line segments.
2. Features: Not only can the increase or decrease in quantity be seen, but it is also easy to compare two sets of related data.
Compound line statistical chart PPT, the third part: knowledge sorting
Knowledge point 1: Characteristics of compound line statistical charts.
The compound line statistical chart can not only see the quantity and the increase and decrease of the quantity, but also facilitate the comparison of two sets of related data. A line chart consists of: title, time, legend, horizontal axis, vertical axis, points and connected line segments. We can use statistical graphs to solve life problems.
Example 1: The following is Li Xin and Liu Yun training 10 days in advance to participate in the 1-minute rope skipping competition at the school sports meeting. The daily test results are as follows: What statistical chart is appropriate? and draw statistical graphs. Answer the questions based on the statistical graph.
Answer the questions based on the statistical graph.
(1) What is the difference between Li Xin and Liu Yun’s scores on the first day? What about day 10?
(2) What is the changing trend of Li Xin and Liu Yun’s rope skipping results? Who has made greater progress?
(3) Can you predict the results of two people?
(4) What else can you find?
Example 2: The following are the flight time and altitude records of two model aircraft produced by the aircraft model team in one flight.
(1) How many seconds did each of the two planes fly? Which one has a longer flight time?
(2) From the picture, what is the altitude of aircraft A at 10 seconds after takeoff? What about plane B? At how many seconds after takeoff were the two planes at the same altitude? Approximately how many seconds after takeoff will the altitudes of the two planes differ the most?
(3) Talk about the flight status of aircraft B from 15 seconds to 20 seconds after takeoff.
[Analysis] (1) Plane A flew for 40 seconds, and plane B flew for 35 seconds. Plane A has a long flight time.
(2) The height of A is 16 meters and the height of B is 20 meters. The two planes were at the same altitude 15 seconds after takeoff. The altitude difference between the two aircraft was lowest 30 seconds after takeoff.
(3) The flying altitude of aircraft B remains unchanged.
Compound line statistical chart PPT, Part 4 content: Classroom exercises
1. Below is the profit statistics chart of the first and second sales departments of Patriot Computer Company. Please complete the following questions based on the information provided in the chart.
(1) The () sales department turns over the fastest amount of profits.
(2) The amount of profits turned over by the two sales departments in ( ) is the closest.
(3) Is there any other information that can be seen from the picture? Please write two.
2. The following table is the sales statistics of educational books in Xinhua Bookstore and Readers Bookstore in the first half of the year.
(1) Please draw a line statistical chart based on these two sets of data.
(2) Please answer the following questions based on the line chart.
①Which month does Xinhua Bookstore and Readers Bookstore sell the most books? Which month has the biggest difference in book sales between the two bookstores?
② Can you give the two bookstores some advice on their book sales plans for the second half of the year based on their sales in the first half of the year?
Compound line statistical chart PPT, Part 5: After-class exercises
1. It is known that the temperature at six hourly hours on a certain day in Jinan City is a statistical ____ chart drawn. The highest temperature at these six hourly hours is at ____ hour, and the lowest temperature is at ____ hour. The temperature is gradually increasing. The temperature rises from ____ hour to ____ hour and decreases from ____ hour to ____ hour.
2. The earth's water resources are becoming increasingly depleted, and water conservation is advocated all over the world. Xiao Ming drew his family's water consumption from January to June into a line chart. Then the average monthly water consumption of Xiao Ming's family in these six months is ().
A. 10 tons B. 9 tons C. 8 tons D. 7 tons
3. The following is a statistical chart collected by Wang Qiang of visits to the Longtan Lake Temple Fair and Changdian Temple Fair during the Spring Festival in 2014.
Answer the questions based on the statistical chart above.
(1) On which day did the number of people visiting the two temple fairs peak and then start to decline?
(2) Which temple fair has the fastest rising and falling number of visitors?
(3) If you want to visit the temple fair next year, which day do you think is better?
4. Look at the pictures and answer the questions:
(1) Xiaogang uses _____ points to complete the race.
(2) After Xiaogang arrived at the finish line, Xiaowen was _____ meters away from the finish line.
(3) Xiaogang’s average speed is _____ meters/min, and Xiaowen’s average speed is _____ meters/min.
(4) From the starting point to the finishing point, the person who is slow first and then fast is _____.
Keywords: free download of PPT courseware for mathematics in the second volume of the fifth grade of the People's Education Press, download of compound line statistical chart PPT, download of broken line statistical chart PPT, .PPT format;
For more information about the "Line Statistics Chart and Compound Line Statistics Chart" PPT courseware, please click the Line Statistics Chart PPT and Compound Line Statistics Chart PPT tab.
"Compound Line Statistical Chart" Line Statistical Chart PPT:
"Multiple Line Statistical Chart" Broken Line Statistical Chart PPT Part One: Exciting Introduction China has entered an aging society, especially Shanghai, which entered the aging process as early as the late 1970s. The number of births and deaths are important influencing factors...
"Complex Line Statistical Chart" PPT:
"Compound Broken Line Statistical Chart" PPT Part One: Analysis of Example Questions Example 3: From the founding of the People's Republic of China to the present, a total of six censuses have been conducted. The following is a statistical table of the results of the six censuses. (The data in the table does not include Hong Kong, Macau and Taiwan) ..
"Compound Line Statistical Chart" Line Statistical Chart PPT Courseware 3:
"Compound Line Statistical Chart" Line Statistical Chart PPT Courseware 3 What kind of statistical chart can the above statistical table be made into? What's the reason? If you want to see the changing trend of data, what kind of statistical chart is more suitable? Can you tell me how to draw it? ... ... ... In order to enhance...
File Info
Update Time: 2024-11-21
This template belongs to Mathematics courseware People's Education Press Fifth Grade Mathematics Volume 2 industry PPT template
"Compound Broken Line Statistical Chart" Broken Line Statistical Chart PPT Download Simple campus recruitment activity planning plan summary enterprise and institution recruitment publicity lecture PPT template is a general PPT template for business post competition provided by the manuscript PPT, simple campus recruitment activity planning plan summary enterprise and institution recruitment promotion Lecture PPT template, you can edit and modify the text and pictures in the source file by downloading the source file. If you want more exquisite business PPT templates, you can come to grid resource. Doug resource PPT, massive PPT template slide material download, we only make high-quality PPT templates!
Tips: If you open the template and feel that it is not suitable for all your needs, you can search for related content "Compound Broken Line Statistical Chart" Broken Line Statistical Chart PPT Download is enough.
How to use the Windows system template
Directly decompress the file and use it with office or wps
How to use the Mac system template
Directly decompress the file and use it Office or wps can be used
Related reading
For more detailed PPT-related tutorials and font tutorials, you can view: Click to see
How to create a high-quality technological sense PPT? 4 ways to share the bottom of the box
Notice
Do not download in WeChat, Zhihu, QQ, built-in browsers, please use mobile browsers to download! If you are a mobile phone user, please download it on your computer!
1. The manuscript PPT is only for study and reference, please delete it 24 hours after downloading.
2. If the resource involves your legitimate rights and interests, delete it immediately.
3. Contact information: service@daogebangong.com
"Compound Broken Line Statistical Chart" Broken Line Statistical Chart PPT Download, due to usage restrictions, it is only for personal study and reference use. For commercial use, please go to the relevant official website for authorization.
(Personal non-commercial use refers to the use of this font to complete the display of personal works, including but not limited to the design of personal papers, resumes, etc.)
Preview
Related Search:
"Compound Broken Line Statistical Chart" Broken Line Statistical Chart PPT Download
2024-11-21
Copyright statement: This material is compiled and released by the user of Daoge Resources. The copyright belongs to the author. For commercial use, please contact the copyright owner. If there is any infringement, please contact the webmaster to remove the resource.
Download Points: 0.00
Free Download
Upgrade VIP
Favorite
Views: 4161 / Downloads: 983


