| Category | Format | Size |
|---|---|---|
| People's Education Press Fifth Grade Mathematics Volume 2 | pptx | 6 MB |

"Single Line Statistical Chart" Line Statistical Chart PPT
Description
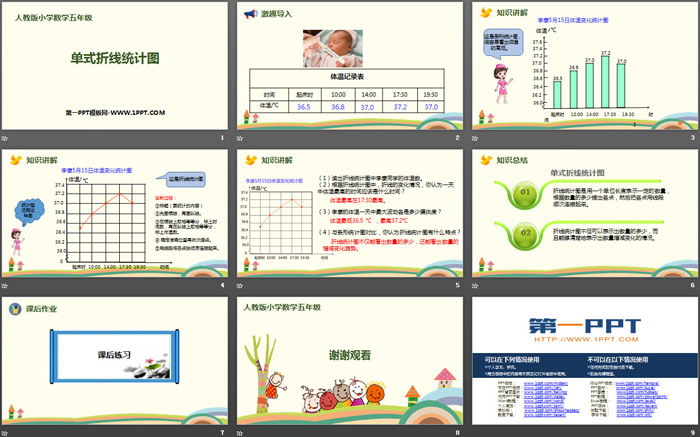
"Single Line Statistical Chart" Line Statistical Chart PPT
Part One Content: Knowledge Explanation
This is a bar chart that makes it easy to see how high or low your body temperature is.
How can statistical graphs be drawn like this?
This is a line chart
Drawing process:
①Title (content to be counted)
②Draw the horizontal axis first, then the vertical axis.
③ Take equal and equal parts on the horizontal axis and mark the time number, and then take equal and equal parts on the vertical axis and mark the body temperature number.
④ Determine the exact location and then draw points one by one.
⑤ Use line segments to connect the points in order.
Single line statistical chart PPT, the second part of the content: knowledge summary
Single line chart
01 The line statistical chart uses one unit length to represent a certain quantity. Each point is drawn according to the quantity, and then the points are connected sequentially with line segments.
02 Line statistical charts can not only show the quantity, but also clearly show the increase or decrease in quantity.
Keywords: free download of PPT courseware for mathematics in the second volume of the fifth grade of the People's Education Press, download of single line statistical chart PPT, download of broken line statistical chart PPT, .PPT format;
For more information about the "Line Statistical Chart Single Type Line Statistical Chart" PPT courseware, please click the Line Statistical Chart PPT Single Type Line Statistical Chart PPT tab.
"Understanding Special Single Line Statistical Charts" PPT:
"Understanding Special Single Line Statistical Charts" PPT Part One Content: Analysis of Example Questions Example 2: The following is a flood situation announcement and a statistical chart of water level changes of a certain river at 2 p.m. every day from August 1 to August 6. (1) What do the two horizontal dotted lines in the picture represent? Answer: Purple...
"Understanding Single Line Statistical Chart" PPT:
"Understanding Single Line Statistical Charts" PPT Part One Content: Learning Objectives 1. Understand simple line statistical charts, understand the structure of line statistical charts, understand the characteristics of line statistical charts, and be able to create simple line statistical charts in the provided tables . 2. Understand statistics and...
"Single Line Statistical Chart" Line Statistical Chart PPT Courseware 2:
"Single Line Statistical Chart" Line Statistical Chart PPT Courseware 2 Learning Objectives: 1. Understand the line statistical chart and its characteristics, and know the general method of making a line statistical chart. 2. Understand line statistical charts and be able to make simple analyses. Able to exchange ideas with peers. ..
File Info
Update Time: 2024-06-24
This template belongs to Mathematics courseware People's Education Press Fifth Grade Mathematics Volume 2 industry PPT template
"Single Line Statistical Chart" Line Statistical Chart PPT Simple campus recruitment activity planning plan summary enterprise and institution recruitment publicity lecture PPT template is a general PPT template for business post competition provided by the manuscript PPT, simple campus recruitment activity planning plan summary enterprise and institution recruitment promotion Lecture PPT template, you can edit and modify the text and pictures in the source file by downloading the source file. If you want more exquisite business PPT templates, you can come to grid resource. Doug resource PPT, massive PPT template slide material download, we only make high-quality PPT templates!
Tips: If you open the template and feel that it is not suitable for all your needs, you can search for related content "Single Line Statistical Chart" Line Statistical Chart PPT is enough.
How to use the Windows system template
Directly decompress the file and use it with office or wps
How to use the Mac system template
Directly decompress the file and use it Office or wps can be used
Related reading
For more detailed PPT-related tutorials and font tutorials, you can view: Click to see
How to create a high-quality technological sense PPT? 4 ways to share the bottom of the box
Notice
Do not download in WeChat, Zhihu, QQ, built-in browsers, please use mobile browsers to download! If you are a mobile phone user, please download it on your computer!
1. The manuscript PPT is only for study and reference, please delete it 24 hours after downloading.
2. If the resource involves your legitimate rights and interests, delete it immediately.
3. Contact information: service@daogebangong.com
"Single Line Statistical Chart" Line Statistical Chart PPT, due to usage restrictions, it is only for personal study and reference use. For commercial use, please go to the relevant official website for authorization.
(Personal non-commercial use refers to the use of this font to complete the display of personal works, including but not limited to the design of personal papers, resumes, etc.)
Preview
Related Search: