Western Normal University Edition First Grade Mathematics Volume 1
Beijing Normal University Edition Seventh Grade Mathematics Volume 1
People's Education Press First Grade Mathematics Volume 1
People's Education Press Third Grade Mathematics Volume 1
People's Education Press Second Grade Mathematics Volume 1
Hebei Education Edition Third Grade Mathematics Volume 1
Beijing Normal University Edition Seventh Grade Mathematics Volume 2
Beijing Normal University Edition Fifth Grade Mathematics Volume 1
Qingdao Edition Seventh Grade Mathematics Volume 1
Hebei Education Edition Seventh Grade Mathematics Volume 2
Beijing Normal University Edition Eighth Grade Mathematics Volume 1
People's Education High School Mathematics Edition B Compulsory Course 2
People's Education Press First Grade Mathematics Volume 2
Jiangsu Education Edition Fourth Grade Mathematics Volume 1
Qingdao Edition Seventh Grade Mathematics Volume 2
Beijing Normal University Edition Fifth Grade Mathematics Volume 2

| Category | Format | Size |
|---|---|---|
| Beijing Normal University Edition Fifth Grade Mathematics Volume 2 | pptx | 6 MB |

"Re-understanding of Averages" Data Analysis and Organization PPT
2024-10-02
Copyright statement: This material is compiled and released by the user of Daoge Resources. The copyright belongs to the author. For commercial use, please contact the copyright owner. If there is any infringement, please contact the webmaster to remove the resource.
Download Points: 0.00
Free Download
Upgrade VIP
Favorite
Views: 1092 / Downloads: 581
Description
"Re-understanding of Averages" Data Analysis and Organization PPT
Part One: Learning Objectives
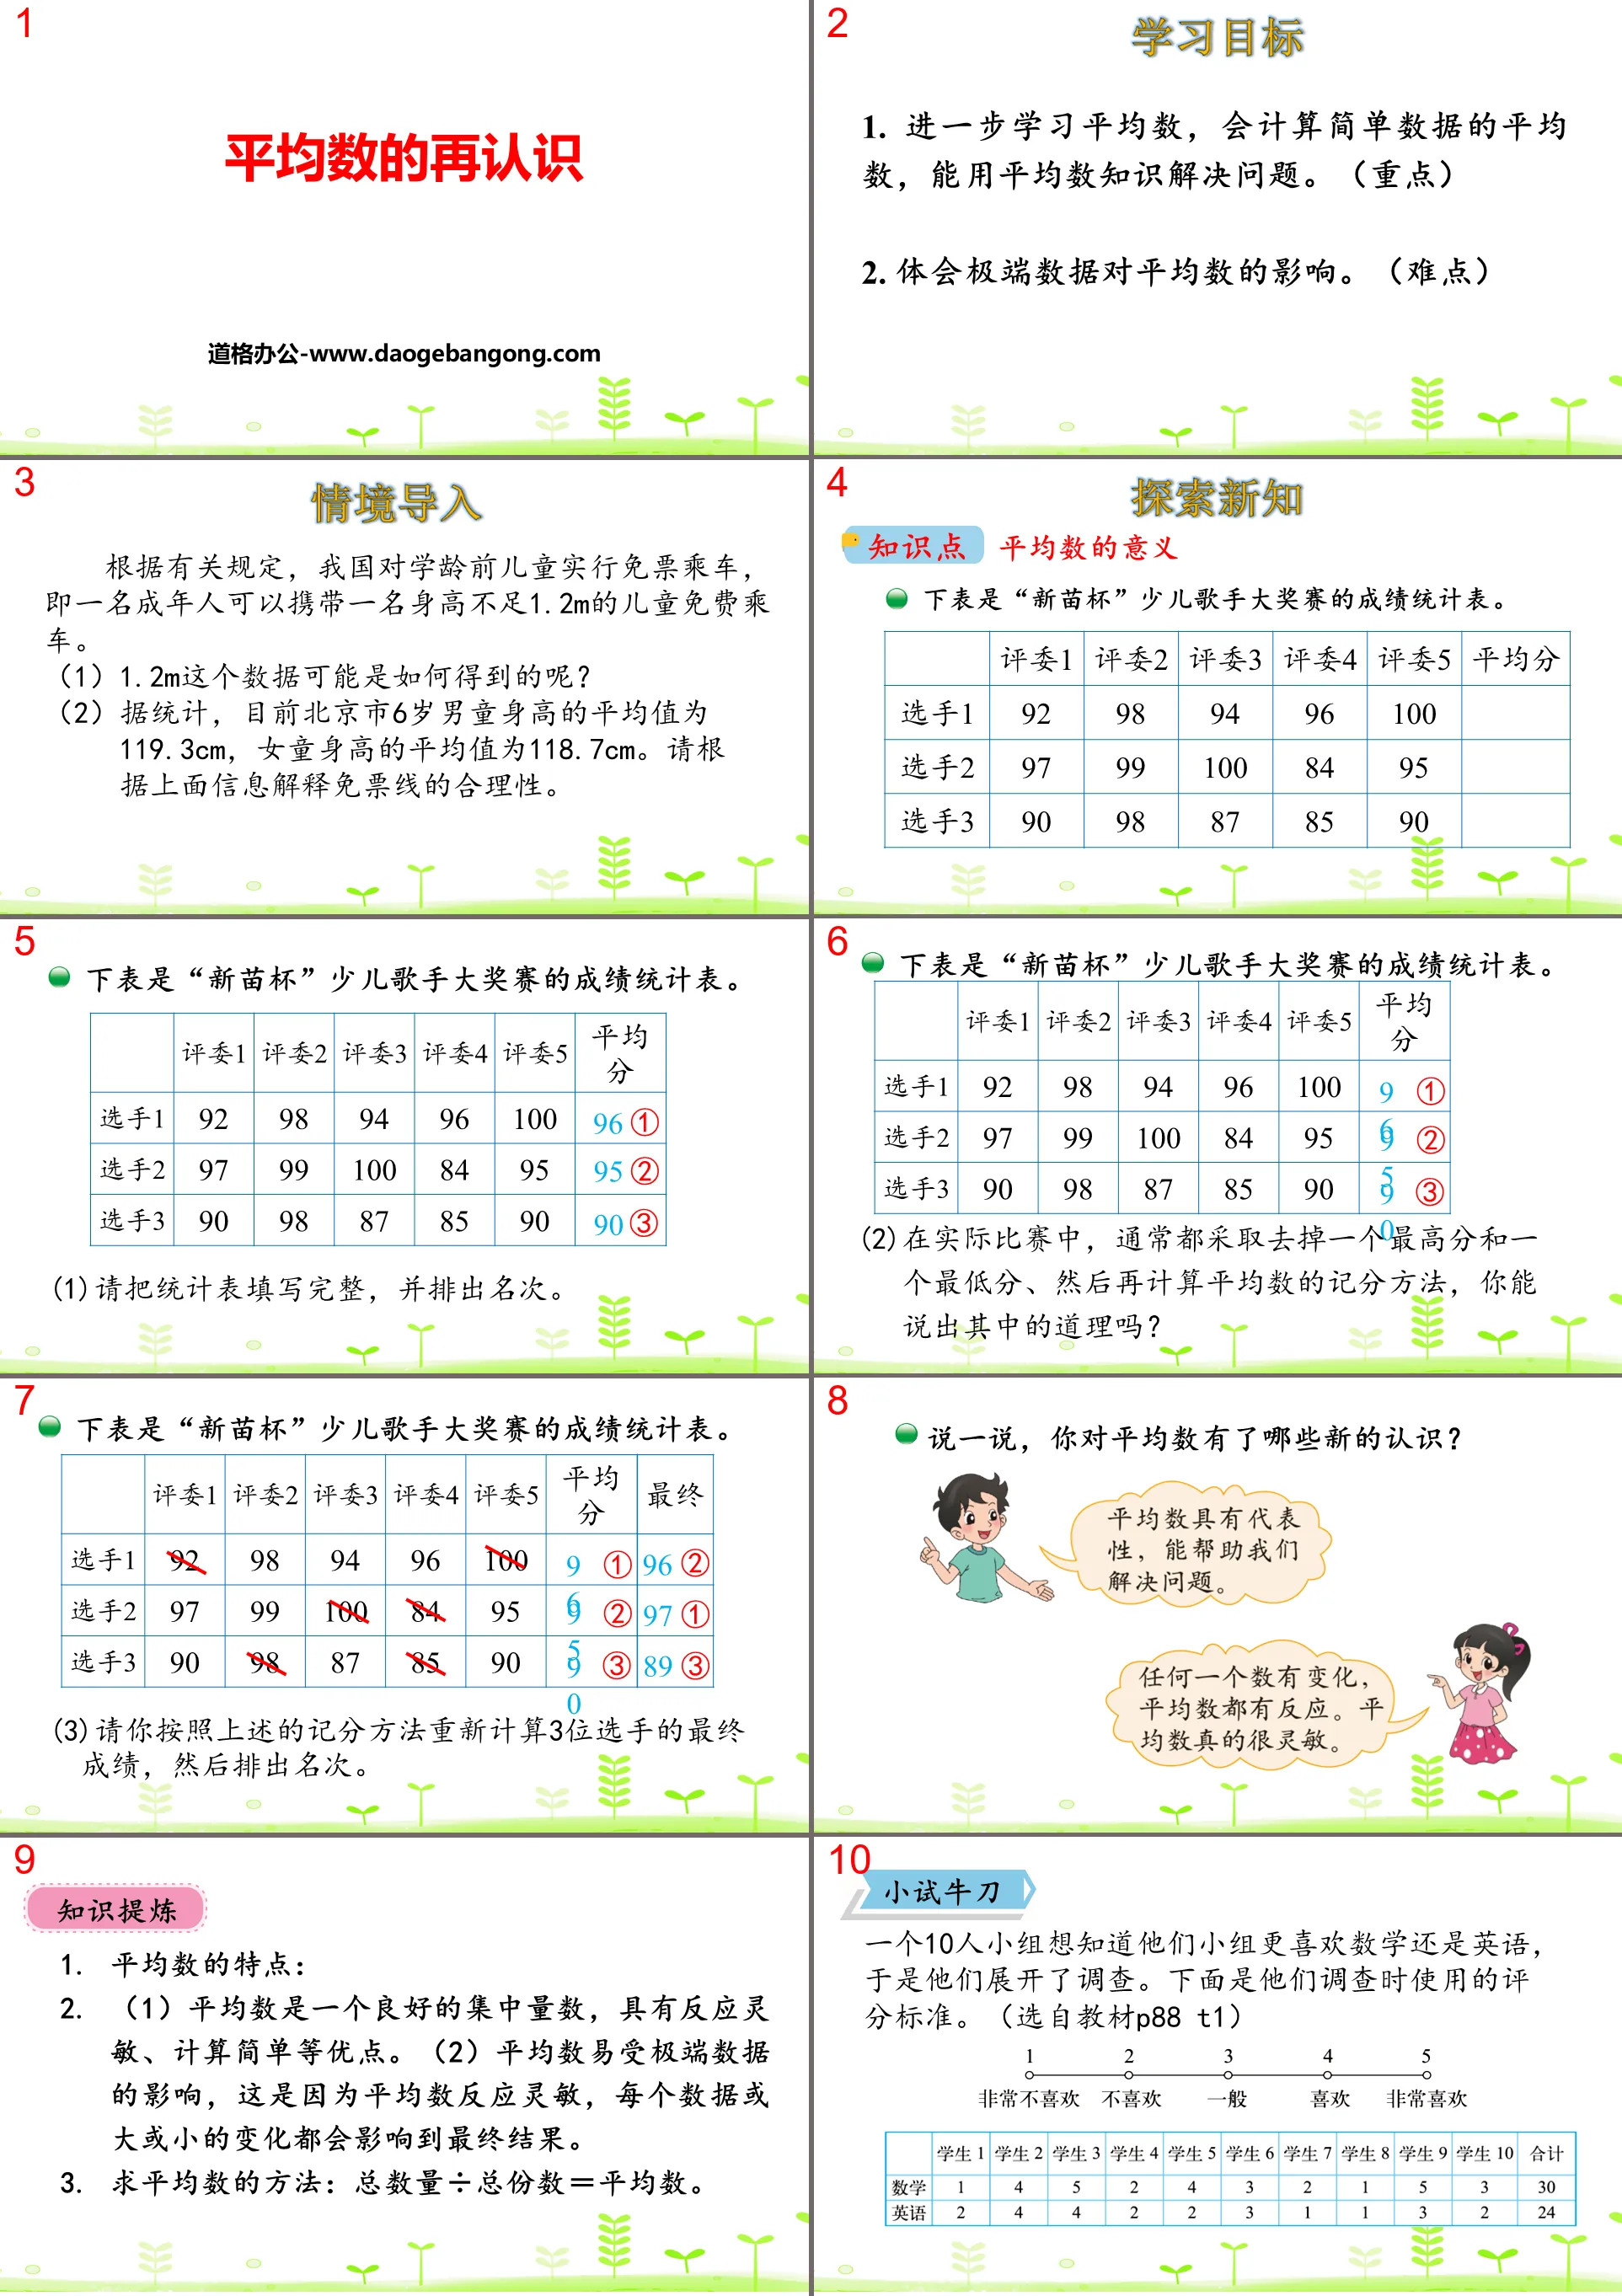
1. Further study averages, be able to calculate the average of simple data, and use average knowledge to solve problems. (emphasis)
2. Understand the impact of extreme data on averages. (difficulty)
Situation import
According to relevant regulations, my country provides free rides for preschool children, that is, an adult can bring a child with a height of less than 1.2m to ride for free.
(1) How might the data of 1.2m be obtained?
(2) According to statistics, the current average height of 6-year-old boys in Beijing is 119.3cm, and the average height of girls is 118.7cm. Please explain the rationality of the free ticket line based on the above information.
Re-understanding of averages PPT, Part 2: Exploring new knowledge
Knowledge point The meaning of average
The following table is the performance statistics of the "Xinmiao Cup" Children's Singer Grand Prix.
(1) Please fill in the statistical table completely and rank it.
(2) In actual competitions, the scoring method is usually to remove the highest score and the lowest score, and then calculate the average. Can you explain the reason?
(3) Please recalculate the final scores of the three players according to the above scoring method, and then rank them.
Knowledge refining
Characteristics of averages:
(1) The average is a good centralized quantity with the advantages of sensitive response and simple calculation. (2) The average is susceptible to the influence of extreme data. This is because the average is sensitive and every large or small change in the data will affect the final result.
How to find the average: total quantity ÷ total number of copies = average.
Re-understanding of averages PPT, part 3: Consolidation exercises
1. Basic questions Naughty investigated the age of the children playing games on the playground: 7 years old, 7 years old, 7 years old, 8 years old, 8 years old, 8 years old, 9 years old, 9 years old. (Selected from textbook P88 T2)
(1) Calculate the average age of these children.
(7+7+7+8+8+8+9+9)÷8=7.875 (years old)
(2) At this time, the teacher also joined the team of playing games. His age is 45 years old, estimate and calculate the average age of people making games at this time. Tell me about your understanding of averages.
(7+7+7+8+8+8+9+9+45)÷9=12 (years old)
2. Multiple choice questions.
(1) Xiaoli measured the temperature 6 times a day, which were 18℃, 21℃, 27℃, 28℃, 24℃, and 20℃. The average temperature on this day is ( ) ℃.
A. 20 B. 27 C. 23
(2) There are an average of 48 students in each of the three classes of fifth grade, including 45 students in class one, 51 students in class two, and ( ) students in class three.
A. 45 B. 48 C. 47
3. The "Respect the Elderly and Love the Young" team of Yangtze Primary School went to a nursing home to clean the house. The first three groups wiped an average of 30 pieces of glass each, and the last two groups wiped a total of 75 pieces of glass. How many pieces of glass did each of the five groups clean on average?
(3×30+75)÷(3+2)=33 (blocks)
Answer: Each of the five groups wiped an average of 33 pieces of glass.
Re-understanding of averages PPT, part 4: Class summary
What knowledge have you learned in this class?
The mean represents the central tendency of a set of data. To find the average, use total quantity ÷ total number of copies. The average is affected by extreme data, and changes in each data will affect the final result.
Re-understanding of averages PPT, Part 5: Homework
Assignment 1: Complete the exercises related to the textbook.
Assignment 2: Complete the corresponding exercises.
Keywords: Free download of Beijing Normal University version of fifth-grade mathematics volume 2 PPT courseware, re-understanding of averages PPT download, data analysis and organization PPT download, .PPT format;
For more information about the PPT courseware "Analysis and Organization of Data for Re-Recognition of Averages", please click on the PPT tab for "Analysis and Organization of Data for Re-Recognition of Averages".
"Re-Understanding of Averages" Data analysis and organization PPT download:
"Reunderstanding of Averages" Data Analysis and Organization PPT Download Part One: Learning Objectives 1. Combined with the problem-solving process, further understand averages and experience the practical application of averages. 2. Further accumulate methods for analyzing and processing data, and develop data...
"Re-Understanding of Averages" Data Representation and Analysis PPT Courseware:
"Re-Understanding of Averages" Data Representation and Analysis PPT Courseware According to relevant regulations, my country allows preschool children to ride free of charge, that is, an adult can bring a child with a height of less than 1.2m to ride for free. ⑴How might the data of 1.2m be obtained?
File Info
Update Time: 2024-10-02
This template belongs to Mathematics courseware Beijing Normal University Edition Fifth Grade Mathematics Volume 2 industry PPT template
"Re-understanding of Averages" Data Analysis and Organization PPT Simple campus recruitment activity planning plan summary enterprise and institution recruitment publicity lecture PPT template is a general PPT template for business post competition provided by the manuscript PPT, simple campus recruitment activity planning plan summary enterprise and institution recruitment promotion Lecture PPT template, you can edit and modify the text and pictures in the source file by downloading the source file. If you want more exquisite business PPT templates, you can come to grid resource. Doug resource PPT, massive PPT template slide material download, we only make high-quality PPT templates!
Tips: If you open the template and feel that it is not suitable for all your needs, you can search for related content "Re-understanding of Averages" Data Analysis and Organization PPT is enough.
How to use the Windows system template
Directly decompress the file and use it with office or wps
How to use the Mac system template
Directly decompress the file and use it Office or wps can be used
Related reading
For more detailed PPT-related tutorials and font tutorials, you can view: Click to see
How to create a high-quality technological sense PPT? 4 ways to share the bottom of the box
Notice
Do not download in WeChat, Zhihu, QQ, built-in browsers, please use mobile browsers to download! If you are a mobile phone user, please download it on your computer!
1. The manuscript PPT is only for study and reference, please delete it 24 hours after downloading.
2. If the resource involves your legitimate rights and interests, delete it immediately.
3. Contact information: service@daogebangong.com
"Re-understanding of Averages" Data Analysis and Organization PPT, due to usage restrictions, it is only for personal study and reference use. For commercial use, please go to the relevant official website for authorization.
(Personal non-commercial use refers to the use of this font to complete the display of personal works, including but not limited to the design of personal papers, resumes, etc.)
Preview
Related Search:
"Re-understanding of Averages" Data Analysis and Organization PPT
2024-10-02
Copyright statement: This material is compiled and released by the user of Daoge Resources. The copyright belongs to the author. For commercial use, please contact the copyright owner. If there is any infringement, please contact the webmaster to remove the resource.
Download Points: 0.00
Free Download
Upgrade VIP
Favorite
Views: 1092 / Downloads: 581


