Business Planet Edition 7th Grade Geography Volume 2
Business Planet Edition Geography for Grade 8 Volume 1
Business Planet Edition 7th Grade Geography Volume 1
People's Education Edition Geography for Seventh Grade Volume 2
Shanghai Education Edition Seventh Grade Geography Volume 1
Business Planet Edition Geography for Eighth Grade Volume 2
Hunan Education Edition High School Geography Compulsory Course I
People's Education Edition Geography for Grade 7 Volume 1
People's Education Edition Geography for Eighth Grade Volume 2
Shanghai Education Edition Geography for Sixth Graders Volume 1
Lu Ke version of high school geography compulsory course I
Hunan Education Edition High School Geography Compulsory Course II
Shanghai Education Edition Seventh Grade Geography Volume 2
Compulsory Course 1 of High School Geography in China Graphics Edition
People's Education Edition Geography for Grade 8 Volume 1
People's Education Press High School Geography Compulsory Course 1

| Category | Format | Size |
|---|---|---|
| Hunan Education Edition High School Geography Compulsory Course II | pptx | 6 MB |

"Integration of this Chapter" Population and Geographic Environment PPT Courseware
2024-10-02
Copyright statement: This material is compiled and released by the user of Daoge Resources. The copyright belongs to the author. For commercial use, please contact the copyright owner. If there is any infringement, please contact the webmaster to remove the resource.
Download Points: 0.00
Free Download
Upgrade VIP
Favorite
Views: 2696 / Downloads: 767
Description
"Integration of this Chapter" Population and Geographic Environment PPT Courseware
Part One: Deepening of Core Inductive Thinking
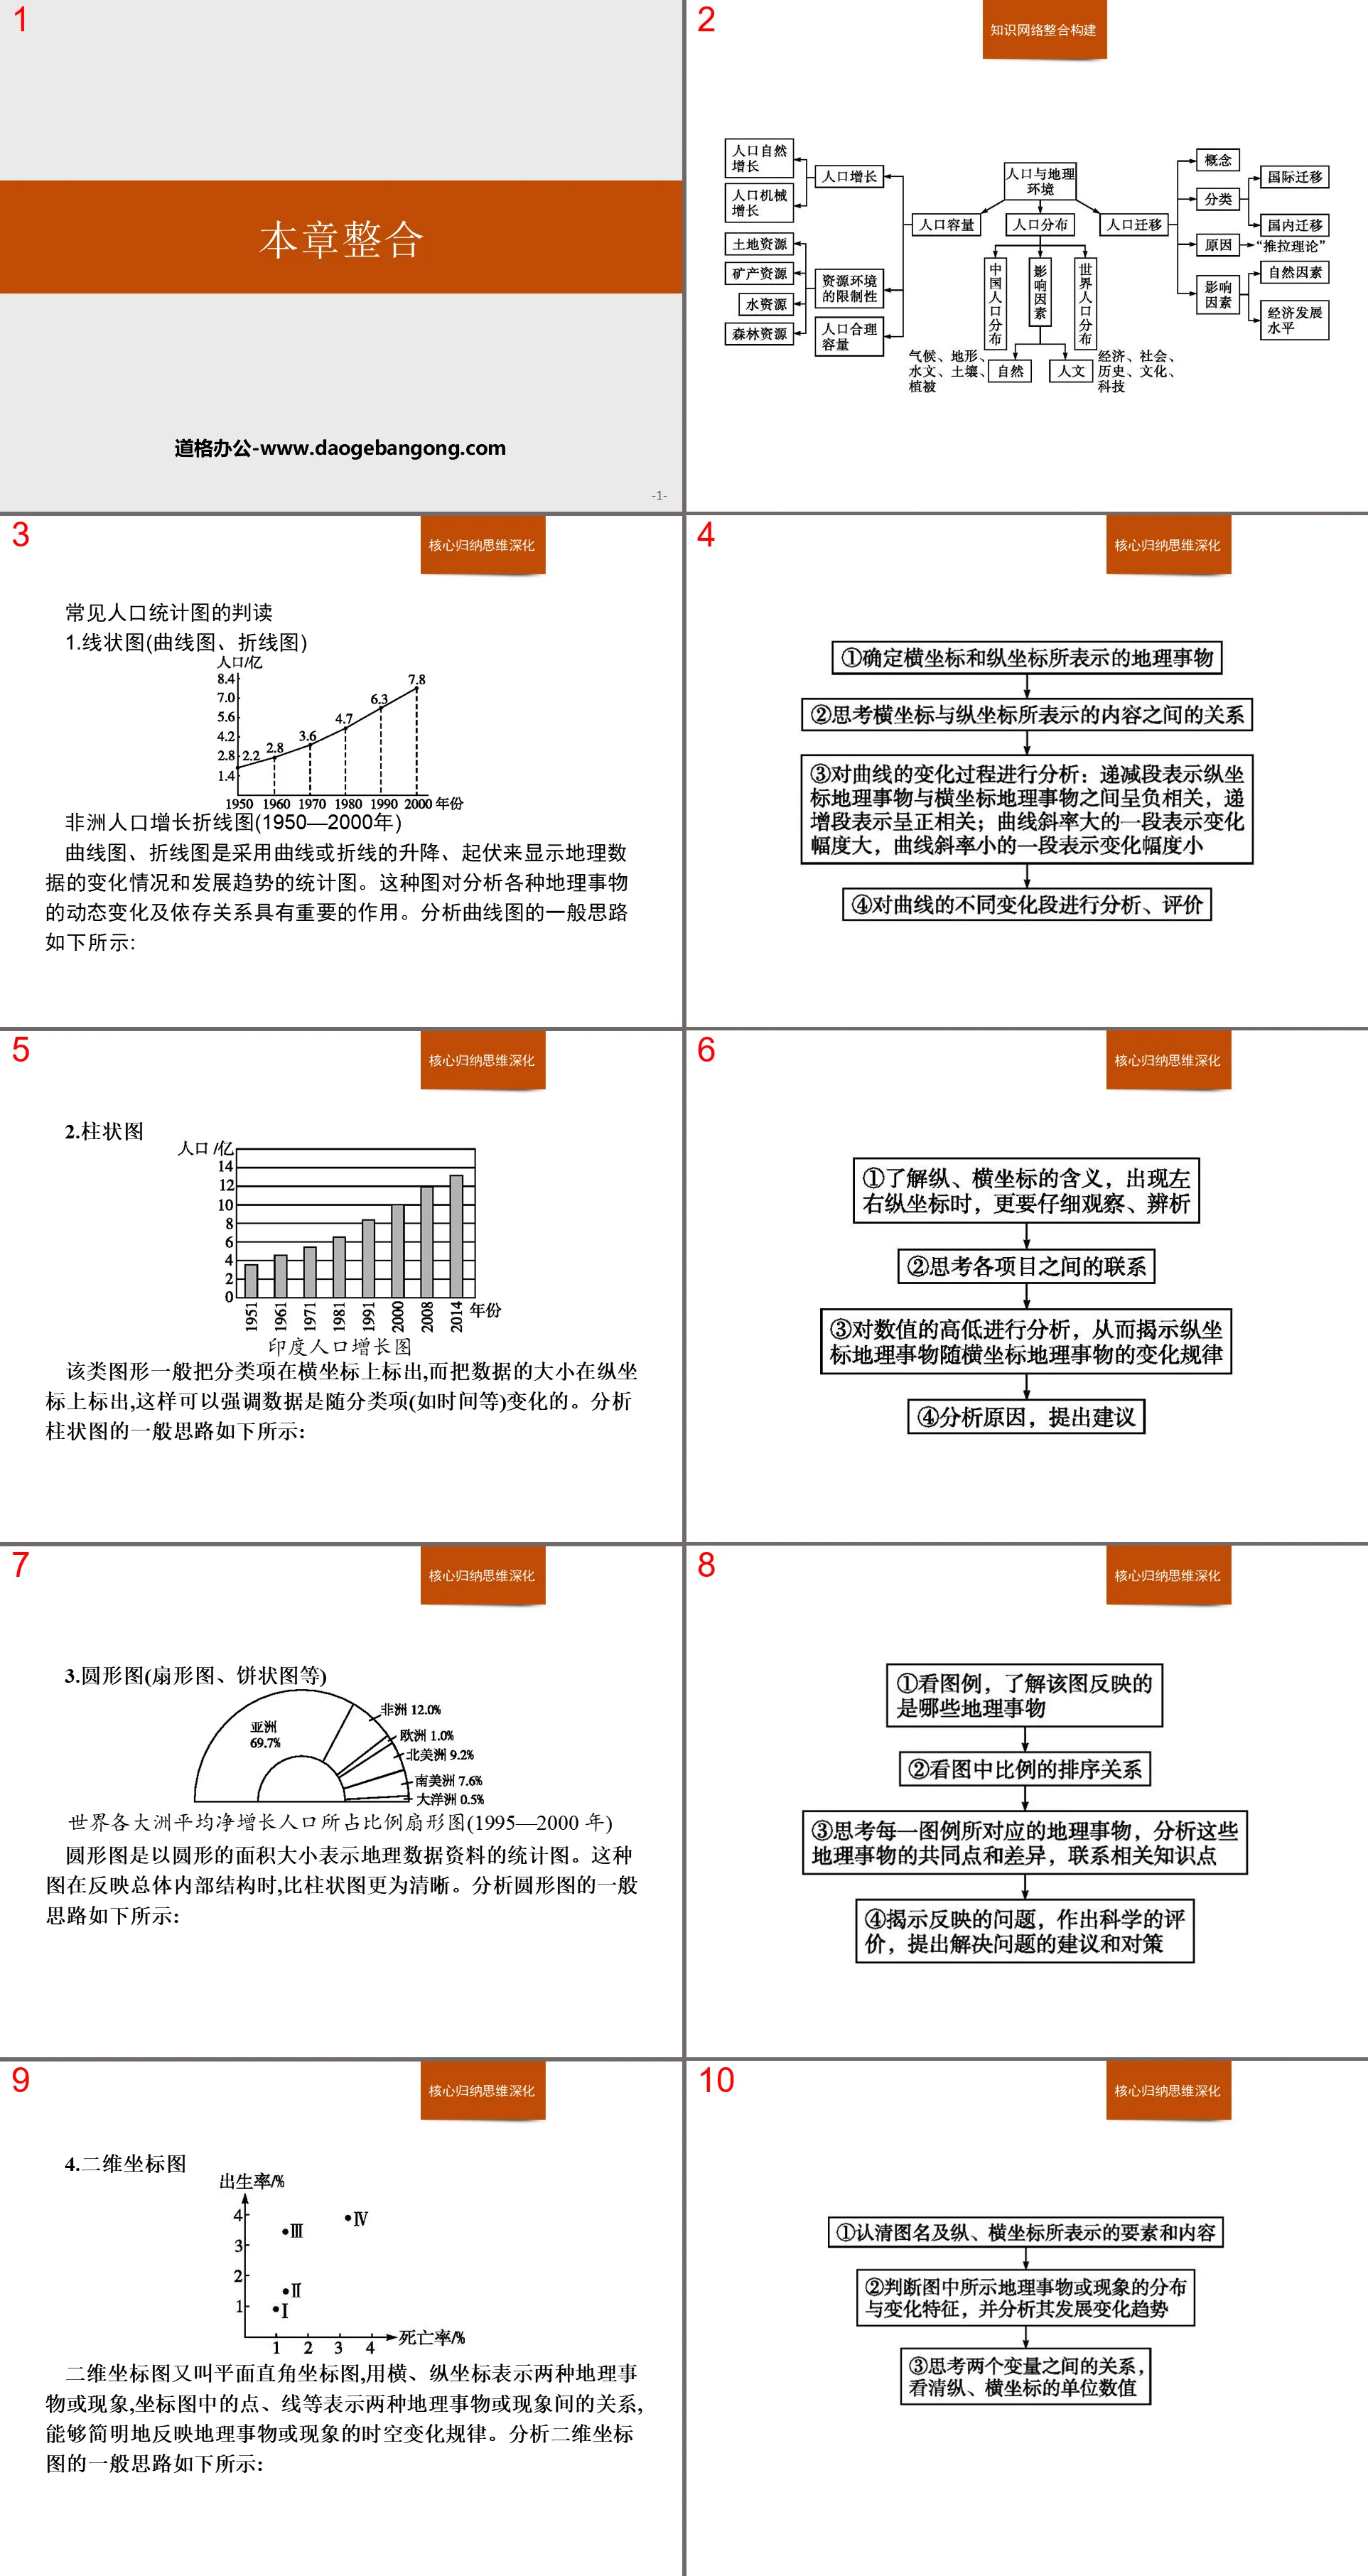
Interpretation of common demographic charts
1. Line graph (curve graph, line graph)
Curve charts and line charts are statistical charts that use the ups and downs and ups and downs of curves or polylines to display the changes and development trends of geographical data. This kind of graph plays an important role in analyzing the dynamic changes and dependencies of various geographical things. The general idea for analyzing curve graphs is as follows:
2. Histogram
This type of graphics generally marks the classification items on the abscissa and the size of the data on the ordinate, which can emphasize that the data changes with the classification items (such as time, etc.). The general idea of analyzing a histogram is as follows:
3. Circular charts (fan charts, pie charts, etc.)
A circular chart is a statistical chart that represents geographical data based on the area of a circle. This kind of graph reflects the overall internal structure more clearly than the histogram. The general idea of analyzing a circle chart is as follows:
4. Two-dimensional coordinate chart
A two-dimensional coordinate diagram is also called a plane rectangular coordinate diagram. It uses horizontal and vertical coordinates to represent two geographical things or phenomena. The points, lines, etc. in the coordinate diagram represent the relationship between the two geographical things or phenomena, and can concisely reflect the geographical things or phenomena. The laws of spatiotemporal changes of phenomena. The general idea of analyzing a two-dimensional coordinate graph is as follows:
5.Multiple coordinate value chart (planar square coordinate chart)
(1) Interpretation method.
A common multi-coordinate value diagram in high school is a flat square coordinate diagram. Two sides of the flat square coordinate diagram represent two variables respectively, and the other two sides represent one variable. When expressing population growth, the bottom edge is often used to represent the population death rate, the adjacent side represents the population birth rate, and the remaining two sides represent the natural growth rate of the population. In this type of graph, the birth rate and death rate data are easier to read, while the reading process of the natural population growth rate is more complicated, but a diagonal line of a square can be drawn, and the reading can be read along the diagonal direction.
(2)Case analysis.
As shown in the dynamic statistical chart of population growth in various continents in the world (above), first read the meaning of the coordinates. The lower abscissa represents the population death rate, the left ordinate represents the birth rate, and the upper abscissa and right ordinate represent the average annual natural population growth. Rate. Combined with the legend, we can read the changing trends of population birth rate, death rate, and natural growth rate in different time periods on each continent. For example, Asia had the highest natural population growth rate from 1960 to 1965. You can also compare major companies in the same time period
The difference in population growth between continents, for example, between 1995 and 2000, the continent with the lowest natural population growth rate was Europe, which had negative growth.
6.Triangle diagram
Triangular axis charts are often used to represent the percentage structure of geographical things with three variables.
(1) The key to reading pictures.
①The data in the figure only represent relative quantities, that is, "proportion" or "proportion", rather than absolute data.
②Each point in the figure can read three variables, and the sum of the proportions of each component must be 100%.
③There are only three components of this type of diagram.
④The three elements extend in the same direction from low to high on the number axis.
(2) Interpretation method.
①Read the origins and changing trends of the three coordinate axes, that is, the directions shown by arrows A, B, and C in the figure.
② Find another coordinate axis that intersects with the origin of the desired interpretation coordinate axis, which is called the adjacent axis. As shown in the figure, the adjacent axis to the A-axis is the C-axis.
Draw parallel lines a, b, and c parallel to the adjacent axes through the desired point (that is, converted into two-dimensional coordinates at the origin of the desired interpretation coordinate axis, referred to as "turn three into two").
Part Two: Practical Development of Subject Literacy
Examples of real-life applications of Population and Environment
population growth
(1) The population is growing too fast, the total number is too large, and the labor resources are abundant, but it will increase the pressure on resources, environment, employment, economy, etc., affecting economic development. The country should implement a family planning policy
(2) If the population growth is too slow, the problem of population aging will occur. The country should formulate policies to encourage childbirth and accept overseas immigrants.
Migration
(1) Areas where the population is mainly migrating, resulting in the loss of talents and labor force, should pay attention to the problems of left-behind elderly people, left-behind children, and left-behind women
(2) In areas where the population is mainly immigrated, the number of labor force increases, infrastructure construction should be strengthened, the legitimate rights and interests of migrant workers should be protected, and the increase in crime rate should be prevented.
(3) Increase transportation capacity between the main places of population migration and places of migration during the Spring Festival travel period
Reasonable population capacity
(1) The population size of a country or region cannot exceed the local population capacity
(2) The population size of a country and region is best controlled within the reasonable population capacity.
Regional culture and population
(1) The age at first marriage affects the birth rate of the population and the speed of population growth.
(2) The stability of marriage affects the birth rate
(3) Countries or regions with religious beliefs have higher birth rates and natural growth rates of the population
(4) Our country’s preference for boys over girls affects the gender ratio of our country’s population.
(5) my country’s traditional concept of “more children means more blessings” affects the birth rate and population growth
(6) After the reform and opening up, the concept of "we are at home all over the world" has affected the migration of my country's population
Typical Example 2 Population inversion refers to the phenomenon that the number of floating population exceeds that of local residents. In recent years, the age structure of Shanghai's floating population has become significantly younger, and they are mainly engaged in manufacturing. Read the picture below and complete the following questions.
(1) Shanghai’s population inversion area ()
A. The secondary industry develops rapidly
B. It is a high-end residential area
C. Transportation is mainly water transport
D. Labor costs are higher than in urban areas
(2) The phenomenon of population inversion in Shanghai shows that the city ()
A. The carrying capacity of resources and environment is gradually increasing
B. The level of urbanization begins to increase
C. The natural growth rate of population increases
D. The problem of population aging is prominent
Keywords: Hunan Education Edition high school geography compulsory course II PPT courseware free download, population and geographical environment PPT download, .PPT format;
For more information about the "Population and Geographic Environment" PPT courseware, please click on the "Population and Geographic Environment PPT" tab.
"Population Capacity" Population and Geographic Environment PPT Courseware:
"Population Capacity" Population and Geographic Environment PPT Courseware Part One: Explanation of Course Standards 1. Understand the characteristics of world population growth and know the factors that affect population growth. (Comprehensive thinking) 2. Use typical cases to analyze the limitations of land, minerals, fresh water, forests and other resources.
"Population Migration" Population and Geographic Environment PPT Courseware:
"Population Migration" Population and Geographic Environment PPT Courseware Part One: Explanation of Course Standards 1. Use information to describe the characteristics of population migration and its influencing factors. (Comprehensive thinking) 2. Combined with examples, understand the push-pull theory of population migration and clarify the main factors causing population migration.
"Population Distribution" Population and Geographic Environment PPT Courseware:
"Population Distribution" Population and Geographic Environment PPT Courseware Part One: Explanation of Course Standards 1. Use data to describe the characteristics of population distribution and its influencing factors. (Comprehensive thinking) 2. Combined with specific cases, analyze the impact of natural and human geographical conditions on population distribution. (district..
File Info
Update Time: 2024-10-02
This template belongs to Geography courseware Hunan Education Edition High School Geography Compulsory Course II industry PPT template
"Integration of this Chapter" Population and Geographic Environment PPT Courseware Simple campus recruitment activity planning plan summary enterprise and institution recruitment publicity lecture PPT template is a general PPT template for business post competition provided by the manuscript PPT, simple campus recruitment activity planning plan summary enterprise and institution recruitment promotion Lecture PPT template, you can edit and modify the text and pictures in the source file by downloading the source file. If you want more exquisite business PPT templates, you can come to grid resource. Doug resource PPT, massive PPT template slide material download, we only make high-quality PPT templates!
Tips: If you open the template and feel that it is not suitable for all your needs, you can search for related content "Integration of this Chapter" Population and Geographic Environment PPT Courseware is enough.
How to use the Windows system template
Directly decompress the file and use it with office or wps
How to use the Mac system template
Directly decompress the file and use it Office or wps can be used
Related reading
For more detailed PPT-related tutorials and font tutorials, you can view: Click to see
How to create a high-quality technological sense PPT? 4 ways to share the bottom of the box
Notice
Do not download in WeChat, Zhihu, QQ, built-in browsers, please use mobile browsers to download! If you are a mobile phone user, please download it on your computer!
1. The manuscript PPT is only for study and reference, please delete it 24 hours after downloading.
2. If the resource involves your legitimate rights and interests, delete it immediately.
3. Contact information: service@daogebangong.com
"Integration of this Chapter" Population and Geographic Environment PPT Courseware, due to usage restrictions, it is only for personal study and reference use. For commercial use, please go to the relevant official website for authorization.
(Personal non-commercial use refers to the use of this font to complete the display of personal works, including but not limited to the design of personal papers, resumes, etc.)
Preview
Related Search:
"Integration of this Chapter" Population and Geographic Environment PPT Courseware
2024-10-02
Copyright statement: This material is compiled and released by the user of Daoge Resources. The copyright belongs to the author. For commercial use, please contact the copyright owner. If there is any infringement, please contact the webmaster to remove the resource.
Download Points: 0.00
Free Download
Upgrade VIP
Favorite
Views: 2696 / Downloads: 767


